Kidswell Bio (Company note – 3Q update)

| Share price (3/4) | ¥134 | Dividend Yield (25/3 CE) | – % |
| 52weeks high/low | ¥185/88 | ROE(24/3 act) | -166.6 % |
| Avg Vol (3 month) | 685 thou shrs | Operating margin (24/3 act) | -54.9 % |
| Market Cap | ¥5.5 bn | Beta (5Y Monthly) | N/A |
| Enterprise Value | ¥6.5 bn | Shares Outstanding | 40.771 mn shrs |
| PER (25/3 CE) | – X | Listed market | TSE Growth |
| PBR (24/12 act) | 5.62 X |
| Click here for the PDF version of this page |
| PDF Version |
The biosimilar business has established a solid profitability trend, with the company making fine progress toward its FY2025/3 earnings forecast. Positive expectations are to mount for key upcoming events.
◇ FY2025/3 3Q Financial highlights: Steady profit progress
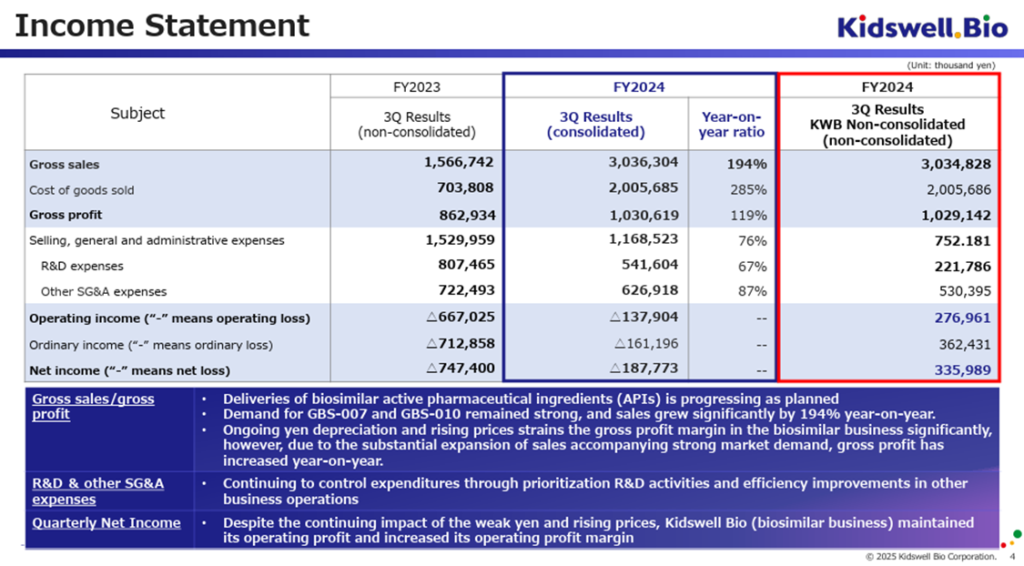
On February 12, 2025, the company announced its consolidated financial results for the third quarter of FY2025/3. On a cumulative basis, sales totaled 3.03 billion yen, operating loss was 130 million yen, ordinary loss was 160 million yen, and quarterly net loss attributable to owner of parent was 180 million yen. Compared to the non-consolidated figures from the same period of the previous year, sales increased by +194%, gross profit increased by +119%, and operating profit improved by 130 million yen, indicating steady progress.
In the cell therapy business, despite being in a consolidated loss position due to upfront R&D expenses associated with the steady progress of the clinical development for cerebral palsy (in the remote period), as mentioned later, the quality of earnings is improving.
In the biosimilar business, the company successfully supplied APIs as planned for GBS-007 and GBS-010, which continue to see strong demand, leading to significant revenue growth. Despite a decline in the gross profit margin due to the impact of weak yen and inflation, the total gross profit increased. Additionally, cost efficiencies in SG&A expenses have contributed to a reduction in operating losses. In the non-consolidated financial results, where the biosimilar business is the primary driver, an operating profit trend has been established, with profit levels increasing quarter by quarter.
◇ FY2025/3 Full-year earnings forecast maintained: Potential for outperformance
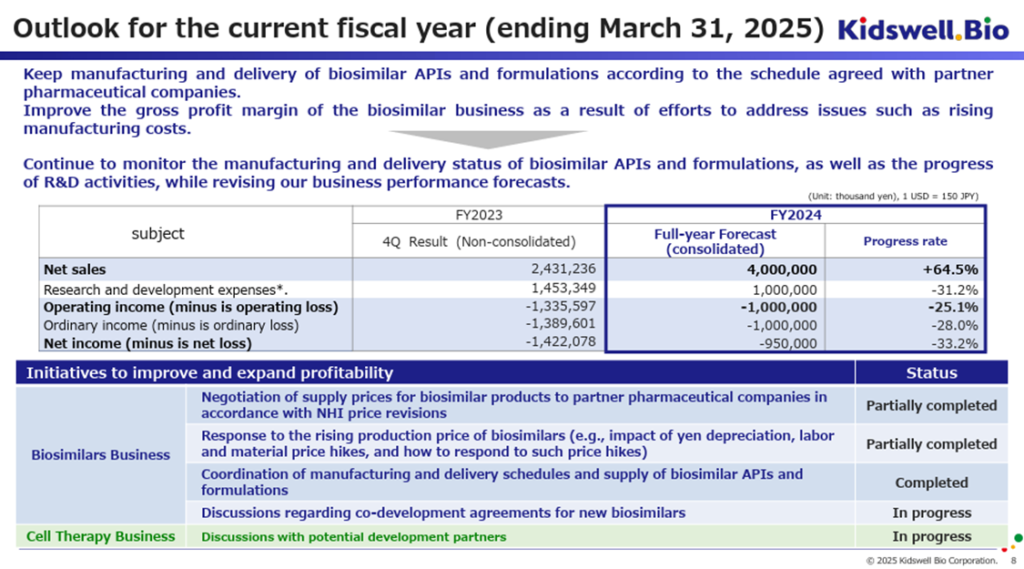
The company has maintained its full-year earnings forecast for FY2025/3, projecting sales of 4.0 billion yen, an operating loss of 1.0 billion yen, an ordinary loss of 1.0 billion yen, and a net loss attributable to owner of parent of 950 million yen. However, given the progress through 3Q, the forecast appears conservative.
Comparing the full-year forecast with the 3Q actual results suggests that 4Q (January–March) would require sales of 960 million yen and an operating loss of 860 million yen. According to the company, it is not anticipating a sudden decline in biosimilar sales or a sharp increase in R&D expenses during 4Q. Furthermore, the company aims to license out its cell therapy business during the rest of the current fiscal year, though this revenue is not included in the forecast.
As long as biosimilar sales remain strong, there is room for upside, particularly in profitability.
◇ Biosimilar business: Building on established profitability, the company lays the groundwork for further growth
The biosimilar business is a key pillar of the company’s future stable growth, as it leverages its strengths in an expanding market. Despite headwinds such as a weak yen and overseas inflation, the company has posted operating profit for three consecutive quarters.
By the end of 3Q, several key developments had emerged.
First, to expand its fifth and subsequent biosimilar products, the company has been engaged in discussions with multiple domestic and international pharmaceutical companies. It has set a concrete target of concluding co-development agreements, including those aimed at overseas market expansion, by the end of September 2025.
Second, to address the increasing working capital requirements driven by strong biosimilar demand and rising costs due to the weak yen and global inflation, the company has successfully negotiated and coordinated with partner pharmaceutical companies, reducing over 1 billion yen. This achievement indicates that similar measures could be taken if needed, mitigating concerns about potential working capital shortages.
Third, the company has reaffirmed that the transition to a new manufacturing system, designed to ensure a stable biosimilar supply and reduce production costs, will be postponed to FY2026 due to delays in regulatory approval. In FY2025, the company prioritizes the stable supply of biosimilars to medical institutions, meaning that additional API orders placed with existing contract manufacturers will be shipped first. As a result, the new manufacturing system‘s cost-reduction benefits will begin materializing in FY2026. However, the company’s ability to manage increased working capital has improved in conjunction with the effect of reducing manufacturing working capital, as well as through various measures such as refinancing via the issuance of new stock acquisition rights announced in December 2024 and the utilization of indirect financing. As a result, its risk resilience has strengthened.
◇Status of cell therapy business: Steady progress
Regarding the cell therapy business (regenerative medicine), which is expected to drive a significant increase in future business value, the key developments up to 3Q are as follows.
The first key development is that the clinical research on autologous SHED for cerebral palsy (in the remote period), led by Nagoya University, is progressing smoothly. Since patient registration began in October 2023, all cases have been successfully enrolled. SHED administration and subsequent observation for the first and second patients are currently ongoing. After the planned administration and observation of the third patient, interim analysis results of the clinical research are expected to be announced by Nagoya University around September 2025.
The second key development is the progress in corporate clinical trials for allogeneic SHED targeting cerebral palsy (in the remote period) in Japan, using the company’s established master cell bank (MCB). Preparations for manufacturing the investigational product and consultations with the PMDA are moving forward. The company has reaffirmed its commitment to signing agreements with development partners in FY2025/3 and aiming for the submission of clinical trial plans by the respective development partners in FY2026/3.
Additionally, efforts toward clinical development for cerebral palsy (in the remote period) in overseas markets are ongoing. The company has commissioned an overseas contract research organization (CRO) to evaluate the adequacy of its existing preclinical trial data, manufacturing processes, and future trial plans. The evaluation confirmed that the necessary data collection and process development are proceeding smoothly.
The third key development is an update on manufacturing technology. The company has completed pilot production for early-stage clinical trials and has successfully developed a proprietary large-scale culture method for late-stage clinical trials and commercialization. The findings will be presented at the International Society for Cell & Gene Therapy (ISCT) conference in the U.S. in May 2025. Furthermore, the company has signed a joint development agreement with NIPRO Corporation to apply this method to late-stage clinical trials and commercial production. It is advancing the technology transfer from its subsidiary, S-Quatre Corporation.
◇ Reducing dependence on equity financing
The company is working toward an early completion of fundraising through stock acquisition rights and is striving to create an environment where its business value is appropriately recognized in the stock market.
As mentioned, the company has successfully controlled the increased working capital requirements for the biosimilar business. In addition, on December 26, 2024, the company resolved to repurchase and cancel its 15th and 18th stock acquisition rights (existing rights) and issue the 23rd and 24th stock acquisition rights (new rights) for refinancing. The payment for issuing the new stock acquisition rights was completed on January 14, 2025. By reducing the number of issued shares by 7.1% and shortening the exercise period, the company aims to complete fundraising quickly while mitigating concerns about stock dilution.
From now on, both the biosimilar and cell therapy businesses will require continued investment in R&D for further expansion. The company will focus on the biosimilar business to address this, while its consolidated subsidiary, S-Quatre, will specialize in the cell therapy business. The company plans to flexibly utilize various funding sources by appropriately prioritizing projects, including development partners, government grants, and indirect financing.
◇ Earnings guidance & key business events toward FY2027/3 profitability
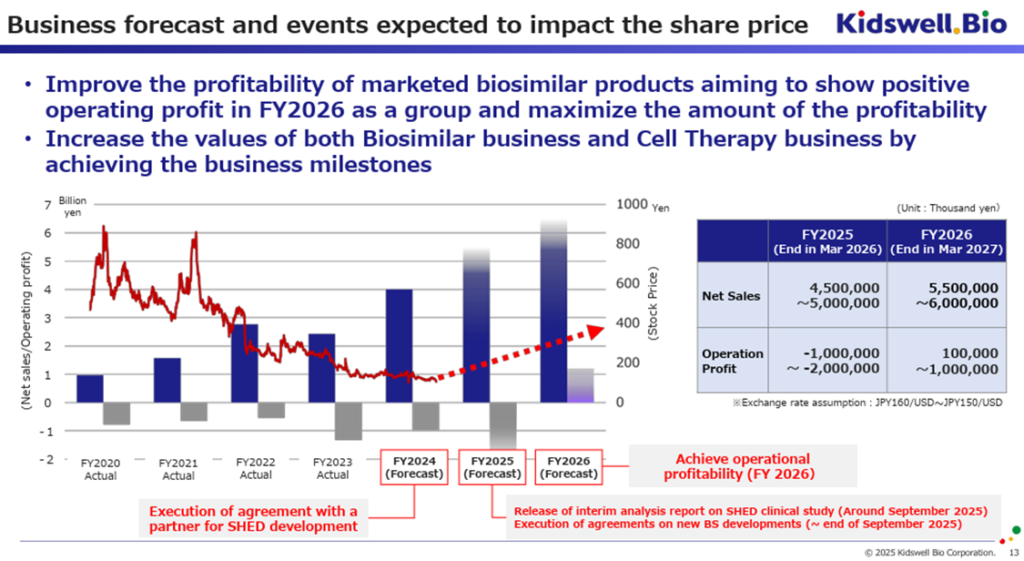
In its 3Q earnings presentation materials, the company provided a range-based earnings forecast for FY2026/3 and FY2027/3. When listed alongside the earnings forecast for the FY2025/3, it is as follows.
FY2025/3: Sales: 4.0 billion yen, Operating Loss: 1.0 billion yen
FY2026/3: Sales: 4.5-5.0 billion yen, Operating Loss: 1.0-2.0 billion yen
FY2027/3: Sales: 5.5-6.0 billion yen, Operating Profit: 1.0-10.0 billion yen (Achieving operating profitability)
*Assumed Exchange Rate: 150-160 JPY/USD
For FY2026/3, as cost reductions for biosimilars are not expected, the company anticipates revenue growth but also a likely expansion of losses. However, for FY2027/3, the company aims to achieve operating profitability.
However, in addition to financial performance, several key business events are scheduled as follows:
FY2025/3: Signing of agreements with SHED development partners.
FY2026/3: Announcement of interim analysis results from the Nagoya University-led clinical research on SHED (expected around September 2025)
Conclusion of joint commercialization agreements for new biosimilars and other products (by the end of September 2025)
Submission of clinical trial plans by SHED development partners (noted in company materials)
In other words, while FY2026/3 is expected to be financially challenging, these upcoming events will be crucial in shaping the company’s future business value. Although exchange rate trends remain uncertain, a shift toward yen appreciation would provide a clear upside to profitability in the biosimilar business. Furthermore, if the company enhances its financial management, diversifies its funding sources, and alleviates concerns over stock dilution through refinancing, investors will likely factor these developments into the stock price accordingly.
◇ Stock price trends & key points to watch
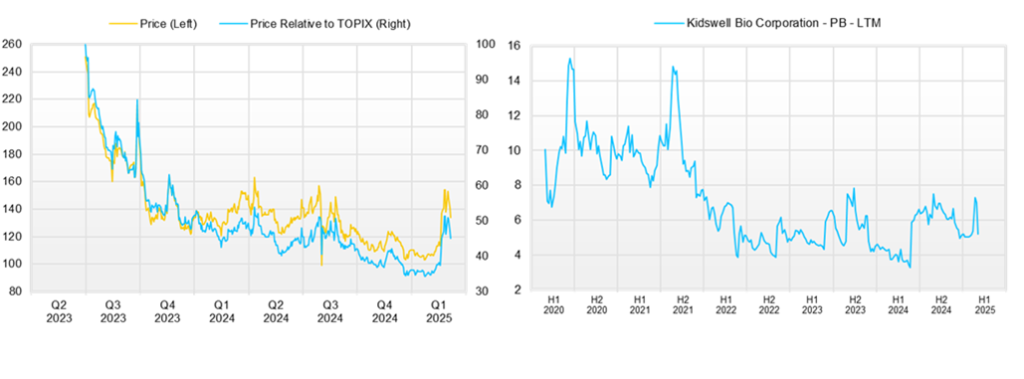
The company’s stock had been on a long-term decline but began to rebound in February 2025, continuing to perform steadily after the 3Q earnings announcement. This suggests that the equity market is recognizing the company’s efforts to enhance its corporate value, appreciating its business potential, and becoming less concerned about stock dilution.
If the stock price reflects the company’s business value properly, key factors to watch in the near term will be the final full-year earnings results for FY2025/3 (whether they exceed expectations) and the outcomes of the aforementioned business events.
Additionally, attention should remain on exchange rate trends, global inflation, and the company’s ability to manage its finances effectively.
Key financial data
| Unit: million yen | 2019/3 | 2020/3 | 2021/3 | 2023/3 | 2024/3 | 2025/3 CE |
| Sales | 1,078 | 997 | 1,569 | 2,776 | 2,431 | 4,000 |
| EBIT (Operating Income) | -1,161 | -970 | -976 | -551 | -1,336 | -1,000 |
| Pretax Income | -7,314 | -1,000 | -550 | -656 | -1,421 | |
| Net Profit Attributable to Owner of Parent | -7,316 | -1,001 | -551 | -657 | -1,422 | -950 |
| Cash & Short-Term Investments | 2,033 | 1,461 | 1,161 | 1,067 | 2,231 | |
| Total assets | 3,592 | 3,934 | 3,470 | 3,895 | 5,086 | |
| Total Debt | 2,575 | 2,575 | 2,575 | 2,575 | 2,575 | |
| Net Debt | 344 | 344 | 344 | 344 | 344 | |
| Total liabilities | 2,105 | 2,324 | 1,767 | 2,661 | 4,254 | |
| Total Shareholders’ Equity | 831 | 831 | 831 | 831 | 831 | |
| Net Operating Cash Flow | -1,325 | -1,267 | -1,170 | -1,421 | -454 | |
| Net Investing Cash Flow | -137 | -22 | 527 | -29 | 0 | |
| Net Financing Cash Flow | 1,222 | 718 | 369 | 1,356 | 1,618 | |
| Free Cash Flow | -1,327 | -1,267 | ||||
| ROA (%) | -216.99 | -26.61 | -14.88 | -17.85 | -31.67 | |
| ROE (%) | -346.86 | -64.66 | -33.25 | -44.78 | -137.73 | |
| EPS (Yen) | -264.7 | -34.8 | -17.9 | -20.8 | -40.2 | -23.7 |
| BPS (Yen) | 53.8 | 54.4 | 54.2 | 38.5 | 21.4 | |
| Dividend per Share (Yen) | 0.00 | 0.00 | 0.00 | 0.00 | 0.00 | 0.00 |
| Shares Outstanding (Million shares) | 27.65 | 29.06 | 31.44 | 31.90 | 37.31 |
Source: Omega Investment from company data, rounded to the nearest whole number.
Share price

Quarterly topics
3Q earnings results

Source: company materials
Outlook for FY2025/3

Source: company materials
FY2026 Business outlook and expected key events

Source: company materials
Financial data (quarterly basis)
| Unit: million yen | 2023/3 | 2024/3 | 2025/3 | ||||||
| 3Q | 4Q | 1Q | 2Q | 3Q | 4Q | 1Q | 2Q | 3Q | |
| (Income Statement) | |||||||||
| Sales | 611 | 1,049 | 46 | 536 | 985 | 864 | 483 | 1,267 | 1,286 |
| Year-on-year | -5.0% | 464.2% | -92.5% | 6.1% | 61.3% | -17.6% | 950.4% | 136.4% | 30.6% |
| Cost of Goods Sold (COGS) | 233 | 597 | 1 | 351 | 352 | 688 | 259 | 998 | 748 |
| Gross Income | 378 | 453 | 45 | 185 | 633 | 176 | 224 | 269 | 538 |
| Gross Income Margin | 61.8% | 43.2% | 98.1% | 34.5% | 64.3% | 20.4% | 46.3% | 21.2% | 41.8% |
| SG&A Expense | 524 | 868 | 500 | 449 | 580 | 845 | 383 | 372 | 414 |
| EBIT (Operating Income) | -147 | -415 | -455 | -265 | 53 | -669 | -159 | -104 | 125 |
| Year-on-year | -915.9% | 90.4% | 1097.7% | -638.6% | -135.9% | 60.9% | -65.1% | -60.9% | 136.8% |
| Operating Income Margin | -24.0% | -39.6% | -989.7% | -49.4% | 5.3% | -77.3% | -32.9% | -8.2% | 9.7% |
| EBITDA | -146 | -415 | -455 | -264 | 53 | -668 | -159 | -103 | |
| Pretax Income | -152 | -462 | -470 | -309 | 35 | -676 | -176 | -65 | 107 |
| Consolidated Net Income | -152 | -463 | -471 | -310 | 33 | -675 | -177 | -65 | 54 |
| Minority Interest | 0 | 0 | 0 | 0 | 0 | 0 | 0 | 0 | 0 |
| Net Income ATOP | -152 | -463 | -471 | -310 | 33 | -675 | -177 | -65 | 54 |
| Year-on-year | -141.3% | 1.3% | 481.4% | -909.1% | -121.6% | 45.9% | -62.5% | -79.0% | 64.4% |
| Net Income Margin | -24.9% | -44.1% | -1023.6% | -57.8% | 3.3% | -78.0% | -36.6% | -5.1% | 4.2% |
| (Balance Sheet) | |||||||||
| Cash & Short-Term Investments | 1,500 | 1,067 | 625 | 622 | 2,187 | 2,231 | 1,167 | 1,695 | 1,318 |
| Total assets | 4,173 | 3,895 | 3,044 | 3,194 | 5,199 | 5,086 | 4,609 | 4,646 | 4,575 |
| Total Debt | 2,075 | 1,950 | 1,850 | 1,775 | 2,275 | 2,575 | 2,402 | 2,131 | 2,034 |
| Net Debt | 575 | 883 | 1,225 | 1,153 | 88 | 344 | 1,235 | 436 | 715 |
| Total liabilities | 2,485 | 2,661 | 2,276 | 2,119 | 3,755 | 4,254 | 3,895 | 3,789 | 3,523 |
| Total Shareholders’ Equity | 1,688 | 1,234 | 769 | 1,075 | 1,444 | 831 | 714 | 857 | 1,052 |
| (Profitability %) | |||||||||
| ROA | -16.14 | -17.85 | -28.50 | -37.43 | -25.82 | -31.67 | -29.48 | -22.54 | -17.65 |
| ROE | -34.05 | -44.78 | -86.81 | -100.55 | -77.27 | -137.73 | -152.15 | -91.46 | -69.11 |
| (Per-share) Unit: JPY | |||||||||
| EPS | -4.8 | -14.4 | -14.7 | -9.3 | 0.9 | -17.5 | -4.5 | -1.6 | 1.3 |
| BPS | 52.7 | 38.5 | 24.0 | 30.0 | 37.6 | 21.4 | 18.1 | 21.1 | 25.9 |
| Dividend per Share | 0.00 | 0.00 | 0.00 | 0.00 | 0.00 | 0.00 | 0.00 | 0.00 | 0.00 |
| Shares Outstanding(million shares) | 31.90 | 32.06 | 32.06 | 37.09 | 37.31 | 38.43 | 39.41 | 40.66 | 40.66 |
Source: Omega Investment from company materials
Financial data (full-year basis)
| Unit: million yen | 2014/3 | 2015/3 | 2016/3 | 2017/3 | 2018/3 | 2019/3 | 2020/3 | 2021/3 | 2022/3 | 2023/3 | 2024/3 |
| (Income Statement) | |||||||||||
| Sales | 301 | 61 | 1,161 | 1,089 | 1,060 | 1,022 | 1,078 | 997 | 1,569 | 2,776 | 2,431 |
| Year-on-year | 397.8% | -79.9% | 1817.7% | -6.2% | -2.7% | -3.6% | 5.5% | -7.5% | 57.5% | 76.9% | -12.4% |
| Cost of Goods Sold | 142 | 15 | 501 | 398 | 423 | 413 | 653 | 120 | 553 | 1,251 | 1,393 |
| Gross Income | 159 | 45 | 660 | 692 | 637 | 609 | 425 | 877 | 1,017 | 1,525 | 1,038 |
| Gross Income Margin | 52.8% | 74.5% | 56.9% | 63.5% | 60.1% | 59.6% | 39.4% | 88.0% | 64.8% | 54.9% | 42.7% |
| SG&A Expense | 672 | 403 | 1,480 | 1,876 | 1,551 | 1,414 | 1,586 | 1,847 | 1,992 | 2,076 | 2,374 |
| EBIT (Operating Income) | -512 | -358 | -820 | -1,184 | -913 | -806 | -1,161 | -970 | -976 | -551 | -1,336 |
| Year-on-year | 43.1% | -30.1% | 129.1% | 44.4% | -22.9% | -11.8% | 44.2% | -16.5% | 0.6% | -43.5% | 142.4% |
| Operating Income Margin | -170.0% | -591.6% | -70.7% | -108.7% | -86.2% | -78.8% | -107.8% | -97.3% | -62.2% | -19.8% | -54.9% |
| EBITDA | -512 | -358 | -820 | -1,184 | -913 | -805 | -1,161 | -969 | -973 | -550 | -1,335 |
| Pretax Income | -517 | -374 | -786 | -1,222 | -903 | -854 | -7,314 | -1,000 | -550 | -656 | -1,421 |
| Consolidated Net Income | -519 | -377 | -788 | -1,225 | -905 | -856 | -7,316 | -1,001 | -551 | -657 | -1,422 |
| Minority Interest | 0 | 0 | 0 | 0 | 0 | 0 | 0 | 0 | 0 | 0 | 0 |
| Net Income ATOP | -519 | -377 | -788 | -1,225 | -905 | -856 | -7,316 | -1,001 | -551 | -657 | -1,422 |
| Year-on-year | 37.7% | -27.4% | 108.9% | 55.5% | -26.1% | -5.3% | 754.4% | -86.3% | -45.0% | 19.3% | 116.3% |
| Net Income Margin | -172.3% | -622.9% | -67.9% | -112.4% | -85.4% | -83.8% | -678.9% | -100.5% | -35.1% | -23.7% | -58.5% |
| (Balance Sheet) | |||||||||||
| Cash & Short-Term Investments | 1,610 | 887 | 817 | 2,380 | 1,891 | 2,009 | 2,033 | 1,461 | 1,161 | 1,067 | 2,231 |
| Total assets | 1,887 | 922 | 1,694 | 3,706 | 3,025 | 3,151 | 3,592 | 3,934 | 3,470 | 3,895 | 5,086 |
| Total Debt | 775 | 0 | 810 | 0 | 0 | 0 | 1,225 | 1,100 | 700 | 1,950 | 2,575 |
| Net Debt | -835 | -887 | -7 | -2,380 | -1,891 | -2,009 | -808 | -361 | -461 | 883 | 344 |
| Total liabilities | 834 | 34 | 1,291 | 206 | 421 | 420 | 2,105 | 2,324 | 1,767 | 2,661 | 4,254 |
| Total Shareholders’ Equity | 1,053 | 888 | 403 | 3,500 | 2,604 | 2,731 | 1,487 | 1,610 | 1,703 | 1,234 | 831 |
| (Cash Flow) | |||||||||||
| Net Operating Cash Flow | -730 | -305 | -607 | -1,759 | -438 | -860 | -1,325 | -1,267 | -1,170 | -1,421 | -454 |
| Capital Expenditure | 0 | 0 | 2 | 0 | 0 | 0 | 2 | 3 | 0 | 0 | 0 |
| Net Investing Cash Flow | -2 | -0 | -122 | -150 | -50 | -0 | -137 | -22 | 527 | -29 | 0 |
| Net Financing Cash Flow | 1,454 | 907 | 947 | 3,472 | 0 | 978 | 1,222 | 718 | 369 | 1,356 | 1,618 |
| (Profitability %) | |||||||||||
| ROA | -36.97 | -26.84 | -60.21 | -45.35 | -26.88 | -27.73 | -216.99 | -26.61 | -14.88 | -17.85 | -31.67 |
| ROE | -53.51 | -38.85 | -122.00 | -62.74 | -29.64 | -32.10 | -346.86 | -64.66 | -33.25 | -44.78 | -137.73 |
| (Per-share) Unit: JPY | |||||||||||
| EPS | -60.0 | -59.6 | -75.7 | -68.5 | -47.3 | -43.8 | -264.7 | -34.8 | -17.9 | -20.8 | -40.2 |
| BPS | 110.4 | 106.7 | 34.9 | 182.9 | 136.1 | 134.3 | 53.8 | 54.4 | 54.2 | 38.5 | 21.4 |
| Dividend per Share | 0.00 | 0.00 | 0.00 | 0.00 | 0.00 | 0.00 | 0.00 | 0.00 | 0.00 | 0.00 | 0.00 |
| Shares Outstanding (million shrs) | 8.59 | 9.54 | 10.85 | 18.74 | 19.14 | 19.68 | 27.65 | 29.06 | 31.44 | 31.90 | 37.31 |
Source: Omega Investment from company materials
