2026-04-10
Home
Japanese

Omega Investment Co., Ltd.
Chiome Bioscience (Company note – 4Q update)

| Share price (3/14) | ¥156 | Dividend Yield (25/12 CE) | – % |
| 52weeks high/low | ¥75/304 | ROE(24/12 act) | -66.8 % |
| Avg Vol (3 month) | 5,927.7 thou shrs | Operating margin (TTM) | -132.0 % |
| Market Cap | ¥10.5 bn | Beta (5Y Monthly) | 0.6 |
| Enterprise Value | ¥9.7 bn | Shares Outstanding | 67.369 mn shrs |
| PER (25/12 CE) | – X | Listed market | TSE Growth |
| PBR (24/12 act) | 5.47 X |
| Click here for the PDF version of this page |
| PDF Version |
The development period for two clinical-stage products has been extended to maximize product value, temporarily revising the plan to achieve single-year profitability by FY2025. Under the new president, the Company aims to maximize clinical development product value and foster new business growth.
◇ FY12/2024 full-year : Highlights of Financial Results: Successful out-licensing of PFKR led to increased revenue and reduced losses
On February 13, 2025, Chiome Bioscience (hereafter referred to as “the Company”) announced its full-year results for FY12/2024, demonstrating increased revenue and reduced losses. Sales amounted to 780 million yen (up 14% YoY), while the operating loss was 1.03 billion yen (vs. a 1.20 billion yen loss in the previous period), the ordinary loss was 1.01 billion yen (vs. a 1.21 billion yen loss), and the net loss was 1.02 billion yen (vs. a 1.22 billion yen loss). Despite a decrease in revenue from the Drug Discovery Support Business, the deficit was reduced due to the recording of a one-off payment from the conclusion of a licensing agreement in the Drug Discovery and Development Business and a decrease in the amount recorded for investigational drug manufacturing costs and other items in R&D expenses.
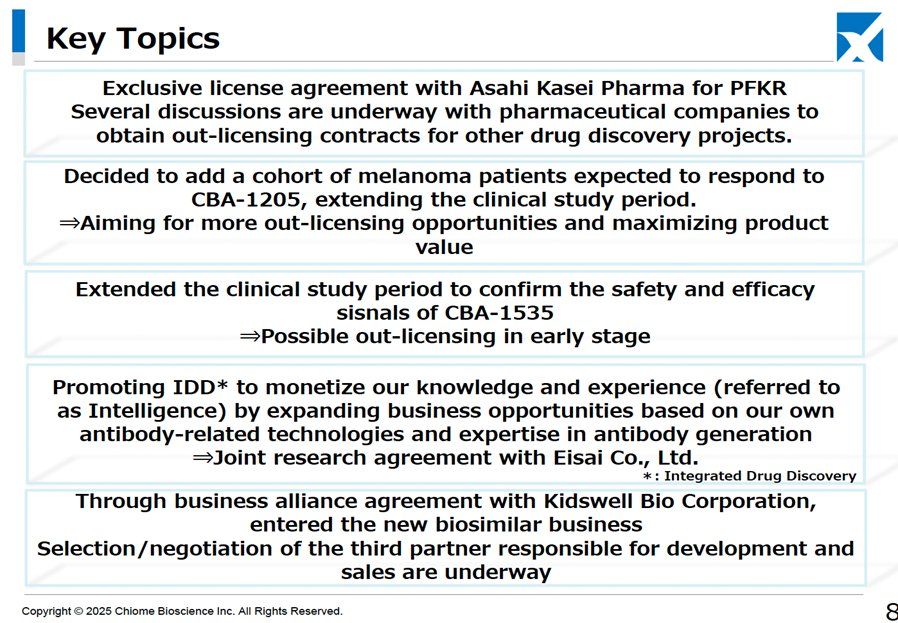
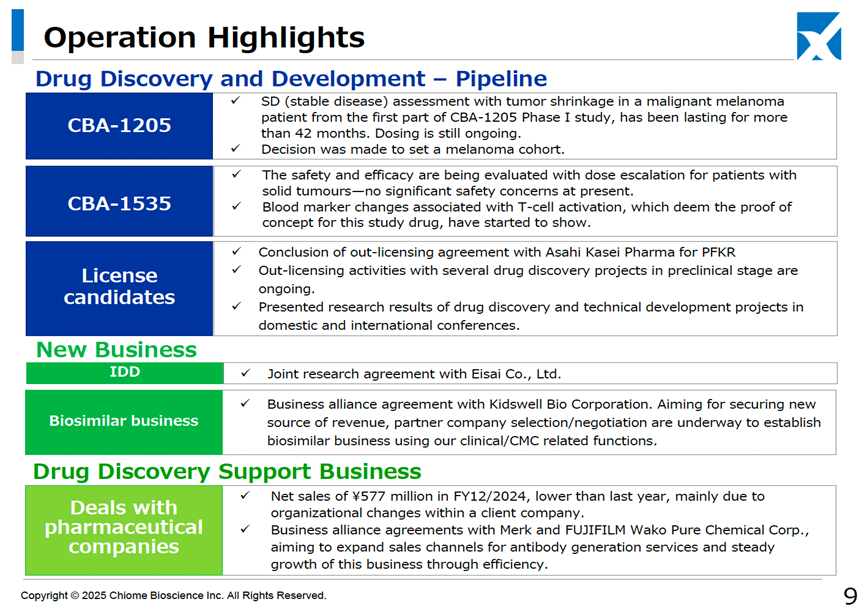
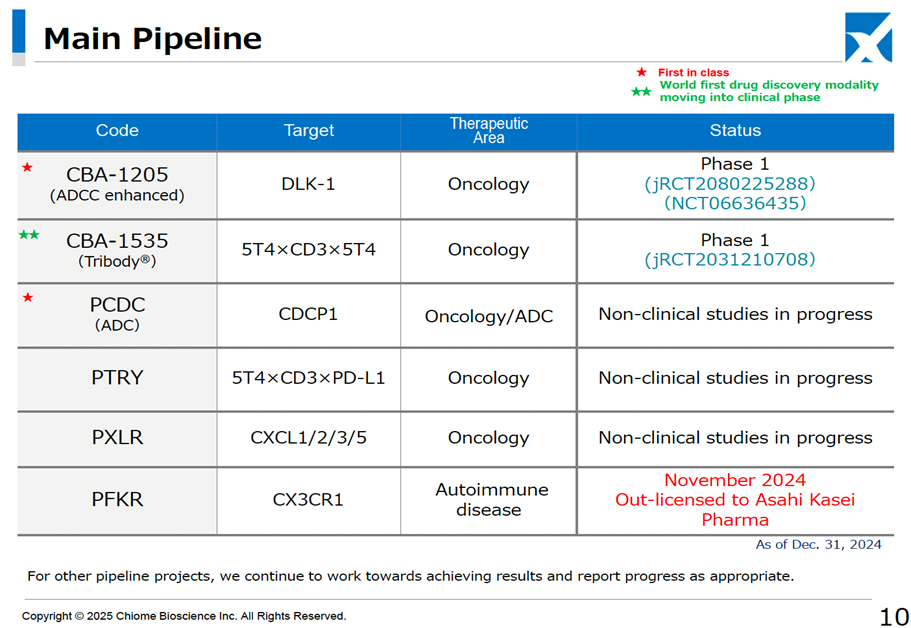
In the Drug Discovery and Development Business, in November 2024, the Company granted exclusive worldwide development, manufacturing, and sales rights for PFKR, a humanized anti-CX3CR1 antibody, to Asahi Kasei Pharma, including sublicensing rights. This agreement generated a one-time contract payment of 200 million yen, with the potential to receive up to approximately 24.8 billion yen as development and sales progresses. This achievement represented a significant milestone for the company.
In the Drug Discovery Support Business, the Company continues to engage in antibody generation, affinity maturation, and protein preparation work using its proprietary ADLib® system-based antibody generation technology platform. It has received orders for these services from notable companies such as Ono Pharmaceutical and Chugai Pharmaceutical. The Company finalized an entrustment agreement with Takeda Pharmaceutical during the current period. It established a business alliance with Merck Ltd. and FUJIFILM Wako Pure Chemical to expand its service sales channels. However, despite progress in acquiring new customers, sales remained at 570 million yen (down 100 million yen YoY) due to the impact of organizational changes with existing customers. Segment profit was 300 million yen (down 90 million yen YoY)
On the balance sheet, cash and deposits increased by 730 million yen YoY, reaching a balance of 2.06 billion yen. Liabilities decreased by 40 million yen, while net assets rose by 760 million yen due to the exercise of stock acquisition rights. The total number of shares issued at the end of the period was 66.9 million, compared to 52.6 million at the end of the previous period.
The above is a summary of the financial results. These are typical for bio-ventures, where initial drug discovery and development costs are incurred ahead, and the immediate impact on the share price is expected to be limited.
◇ FY12/2025 full-year earnings forecast: The Company forecasts full-year sales of 500 million yen for the Drug Discovery Support Business. It has revised its plan to achieve profitability in a single year by 2025
The Company has only disclosed its full-year sales forecast for the Drug Discovery Support Business, targeting 500 million yen for the new fiscal year (down 80 million yen YoY).
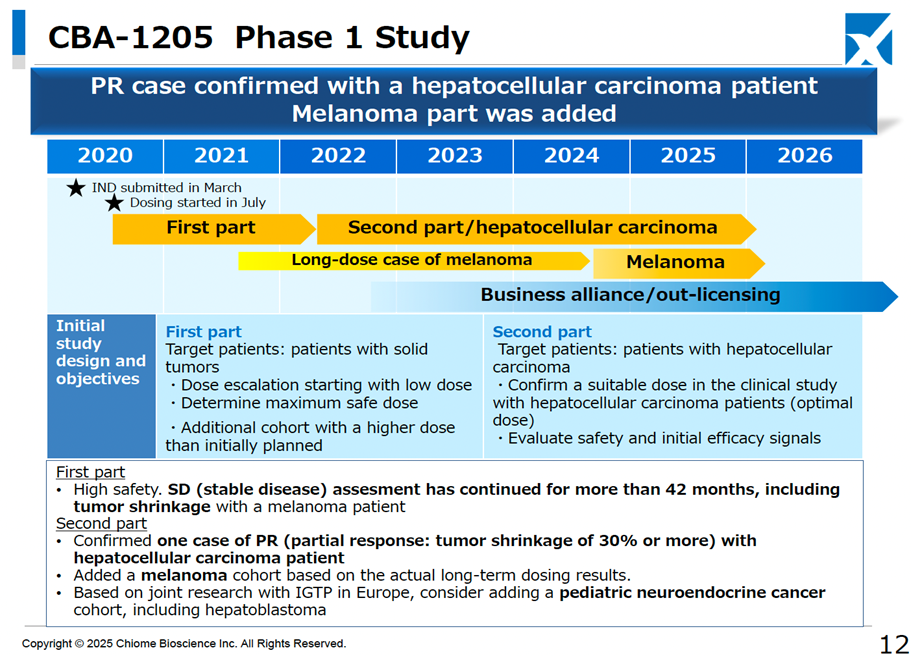
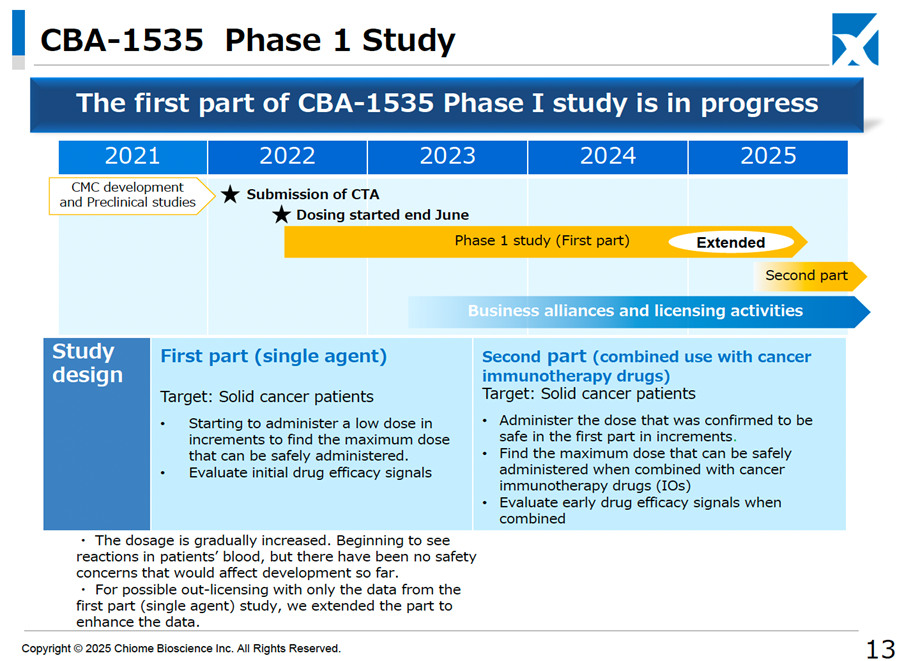
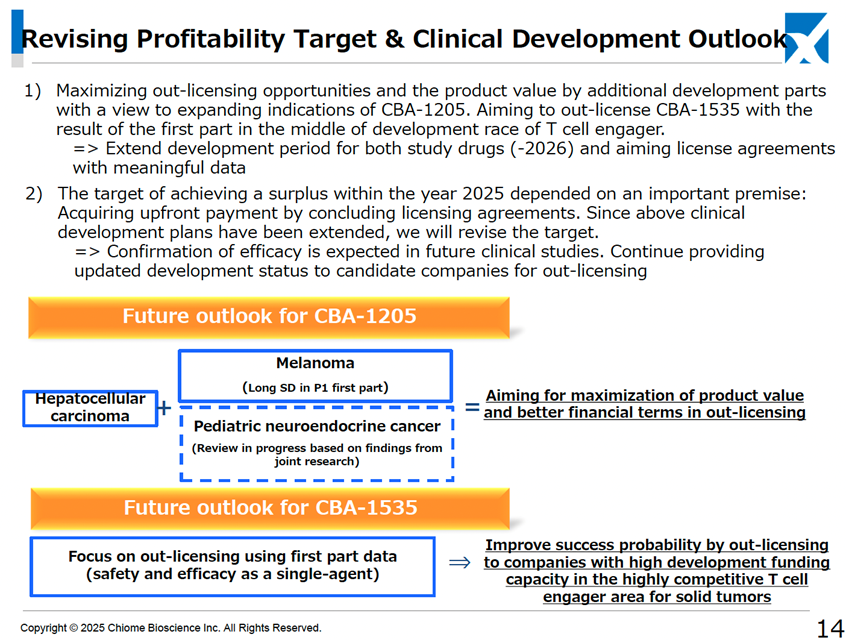
It has also revised its strategy to achieve single-year profitability by 2025. The original profitability plan was based on receiving a one-time licensing fee for both CBA-1205 and CBA-1535 in clinical development. However, the development policy has been updated, with additional clinical trials for CBA-1205 being considered for pediatric neuroendocrine carcinoma, alongside its existing indications for hepatocellular carcinoma and melanoma. For CBA-1535, data expansion for the first half of the Phase I monotherapy trial is being prepared to facilitate early out-licensing. Consequently, the development period for both drugs will be more extended than previously anticipated.
Unfortunately, the possibility of a delay in achieving profitability in a single year has increased, but this is an extension of the development period to ensure and improve the economic value of both drugs. Given that working capital has been secured, the impact is expected to be generally neutral.
The development pipeline has progressed smoothly, with no significant changes other than the successful conclusion of the PFKR licensing agreement.
◇ Change of President and Development of New Business
At the general shareholders’ meeting in March 2025, the company’s presidency is set to transition from Mr. Kobayashi to Mr. Koike, currently the Executive Director and Head of the Research Division.
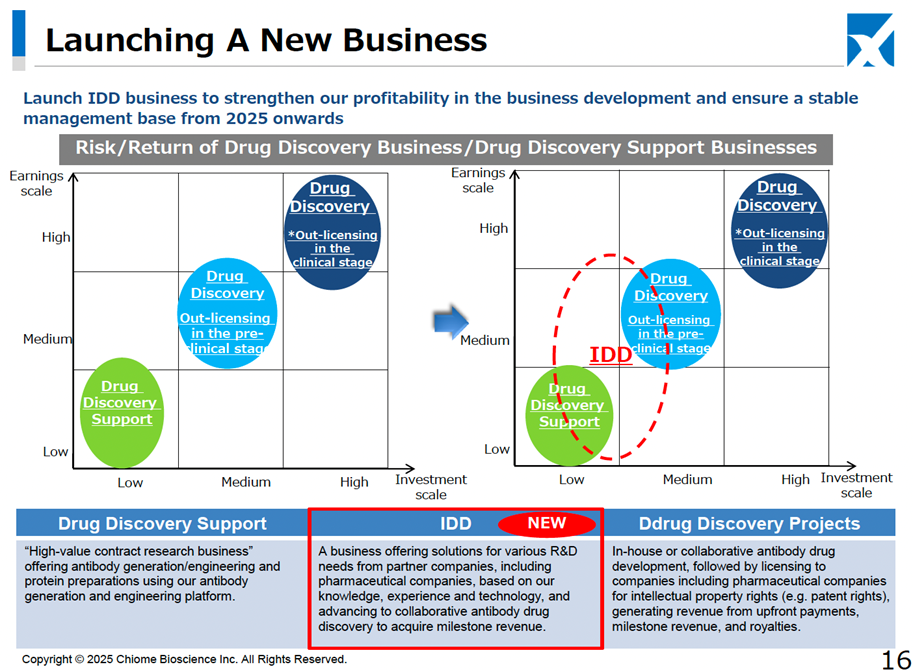
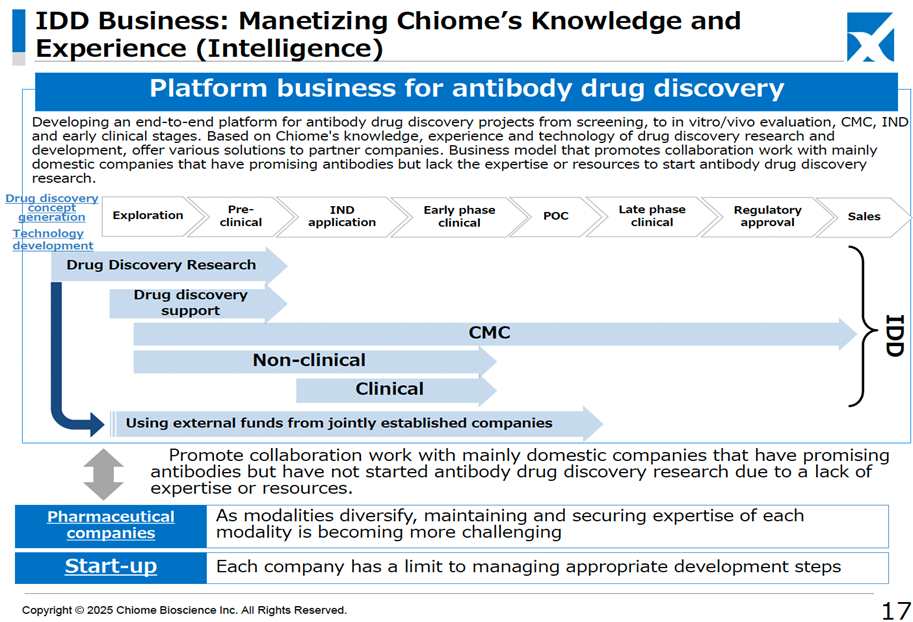
In addition, as a new business for the company, on top of the previously announced entry into the biosimilar business through a business alliance with Kidswell Bio, it was announced that it would launch a platform-type business (IDD business) for antibody drug discovery and development. This new business model involves leveraging the company’s extensive antibody drug discovery expertise to support pharmaceutical companies and start-ups, generating revenue by assisting in promising antibody research projects that lack in-house R&D capabilities. This model bridges the gap between the low-risk, low-return Drug Discovery Support Business and the high-risk, high-return Drug Discovery and Development Business. It is expected to contribute to revenue diversification and stabilization alongside the biosimilar business. As part of this strategy, the Company has already announced a joint research agreement with Eisai and OmniAb, Inc.
◇ Share price trend and future highlights
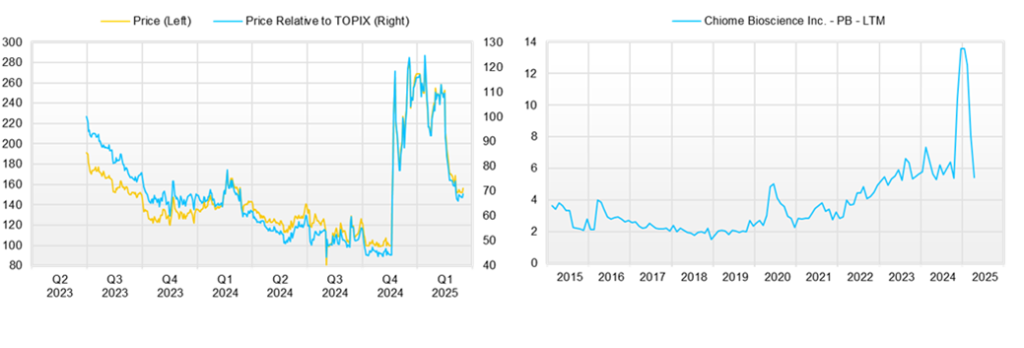
The Company’s share price, which had been on a gentle downward trend, surged from around 100 yen to 300 yen after announcing the PFKR licensing agreement. However, after the full-year results were announced, the share price adjusted to the 160 yen range.
The recent decline in the share price is primarily attributed to the company’s revised forecast regarding achieving profitability by the end of December 2025. Nevertheless, the current share price remains approximately 60% higher than the pre-announcement level of 100 yen, reflecting market optimism about the potential of the Drug Discovery and expectations for a transformative shift in the company’s business model under new leadership, focusing on revenue diversification and stabilization.
Key points to monitor in the near term include: 1.Can the Company successfully license out its in-house developed products, such as CBA-1205 and CBA-1535, following the PFKR licensing agreement, and are the economic terms of these agreements favorable? 2.Whether the Company can achieve single-year profitability at an early stage. 3.Whether the biosimilar and IDD businesses will contribute to improving overall profitability as they gain momentum.
Company profile
Chiome Bioscience Inc. is a bio venture company that challenges unmet needs through antibody drug discovery and development based on its proprietary ADLib/Tribody technology. The Company has positioned its Drug Discovery and Development Business as a pillar of growth. (This business involves the in-house or joint development of antibody drugs for diseases with high unmet medical needs and the licensing of intellectual property rights such as patents for the resulting antibodies to pharmaceutical companies, etc., to generate income from one-time contract fees, milestone payments, and royalties, etc.) The Company has a pipeline of around 10 products, three of which are in clinical trials, and in November 2024, it licensed out one preclinical program. In addition, the Company has built up a track record in its Drug Discovery Support Business (a high-value-added contract research business that provides antibody generation, antibody engineering, and protein preparation services using the Company’s antibody drug discovery technology platform, mainly to major domestic pharmaceutical companies). It has also started to expand into the biosimilar business and IDD Business.
Key financial data
| Unit: million yen | 2020/12 | 2021/12 | 2022/12 | 2023/12 | 2024/12 | 2025/12CE |
| Sales | 481 | 713 | 631 | 682 | 781 | NA |
| EBIT (Operating Income) | -1,284 | -1,334 | -1,259 | -1,205 | -1,031 | NA |
| Pretax Income | -1,291 | -1,466 | -1,238 | -1,215 | -1,018 | NA |
| Net Profit Attributable to Owner of Parent | -1,294 | -1,480 | -1,243 | -1,220 | -1,021 | NA |
| Cash & Short-Term Investments | 2,686 | 1,791 | 1,727 | 1,326 | 2,063 | |
| Total assets | 3,495 | 2,339 | 2,215 | 1,751 | 2,469 | |
| Total Debt | 291 | 291 | 291 | 291 | 282 | |
| Net Debt | -1,035 | -1,035 | -1,035 | -1,035 | -1,782 | |
| Total liabilities | 385 | 446 | 425 | 594 | 549 | |
| Total Shareholders’ Equity | 1,158 | 1,158 | 1,158 | 1,158 | 1,920 | |
| Net Operating Cash Flow | -1,360 | -1,131 | -1,191 | -1,069 | -1,001 | |
| Capital Expenditure | 0 | 0 | 0 | 0 | 0 | |
| Net Investing Cash Flow | -4 | -35 | 0 | 0 | 0 | |
| Net Financing Cash Flow | 1,944 | 271 | 1,127 | 667 | 1,738 | |
| ROA (%) | -41.06 | -50.73 | -54.57 | -61.51 | -48.37 | |
| ROE (%) | -45.15 | -59.16 | -67.48 | -82.76 | -66.33 | |
| EPS (Yen) | -36.1 | -36.7 | -28.3 | -24.6 | -17.5 | |
| BPS (Yen) | 78.7 | 46.4 | 37.0 | 22.0 | 28.7 | |
| Dividend per Share (Yen) | 0.00 | 0.00 | 0.00 | 0.00 | 0.00 | |
| Shares Outstanding (Million shares) | 58.28 | 58.28 | 58.28 | 58.28 | 66.97 |
Source: Omega Investment from company data, rounded to the nearest whole number.
Share price
Quarterly topics
Source: company materials
Source: company materials
Source: company materials
Source: company materials
Source: company materials
Source: company materials
Source: company materials
Source: company materials
Financial data (quarterly basis)
| Unit: million yen | 2022/12 | 2023/12 | 2024/12 | ||||||
| 4Q | 1Q | 2Q | 3Q | 4Q | 1Q | 2Q | 3Q | 4Q | |
| (Income Statement) | |||||||||
| Sales | 197 | 169 | 189 | 165 | 158 | 130 | 134 | 159 | 358 |
| Year-on-year | 15.1% | 31.8% | 26.6% | 6.2% | -19.6% | -23.5% | -29.2% | -3.8% | 126.1% |
| Cost of Goods Sold (COGS) | 83 | 73 | 77 | 67 | 67 | 73 | 56 | 74 | 145 |
| Gross Income | 114 | 96 | 113 | 98 | 92 | 57 | 78 | 85 | 213 |
| Gross Income Margin | 57.8% | 56.6% | 59.5% | 59.6% | 57.8% | 44.0% | 58.0% | 53.4% | 59.5% |
| SG&A Expense | 333 | 322 | 546 | 344 | 391 | 379 | 337 | 425 | 323 |
| EBIT (Operating Income) | -219 | -226 | -433 | -246 | -300 | -322 | -259 | -340 | -110 |
| Year-on-year | -54.6% | -53.5% | 48.0% | -5.4% | 36.7% | 42.6% | -40.2% | 38.1% | -63.3% |
| Operating Income Margin | -111.3% | -133.4% | -228.6% | -149.0% | -189.3% | -248.5% | -193.1% | -213.9% | -30.7% |
| EBITDA | -219 | -226 | -433 | -246 | -300 | -322 | -259 | -340 | -110 |
| Pretax Income | -214 | -226 | -435 | -254 | -300 | -303 | -259 | -351 | -105 |
| Consolidated Net Income | -215 | -228 | -436 | -255 | -302 | -304 | -260 | -352 | -105 |
| Minority Interest | 0 | 0 | 0 | 0 | 0 | 0 | 0 | 0 | 0 |
| Net Income ATOP | -215 | -228 | -436 | -255 | -302 | -304 | -260 | -352 | -105 |
| Year-on-year | -66.2% | -53.8% | 56.5% | -0.7% | 40.1% | 33.5% | -40.4% | 38.0% | -65.1% |
| Net Income Margin | -109.2% | -134.4% | -230.1% | -154.3% | -190.3% | -234.5% | -193.9% | -221.2% | -29.4% |
| (Balance Sheet) | |||||||||
| Cash & Short-Term Investments | 1,727 | 1,566 | 1,245 | 1,342 | 1,326 | 1,325 | 1,104 | 1,241 | 2,063 |
| Total assets | 2,215 | 2,086 | 1,686 | 1,753 | 1,751 | 1,754 | 1,557 | 1,694 | 2,469 |
| Total Debt | 184 | 301 | 298 | 316 | 291 | 314 | 292 | 303 | 282 |
| Net Debt | -1,543 | -1,265 | -947 | -1,026 | -1,035 | -1,012 | -812 | -938 | -1,782 |
| Total liabilities | 425 | 524 | 541 | 542 | 594 | 506 | 487 | 478 | 549 |
| Total Shareholders’ Equity | 1,791 | 1,562 | 1,145 | 1,211 | 1,158 | 1,248 | 1,071 | 1,216 | 1,920 |
| (Profitability %) | |||||||||
| ROA | -54.57 | -46.44 | -62.98 | -59.13 | -61.51 | -67.53 | -69.09 | -70.61 | -48.37 |
| ROE | -67.48 | -60.83 | -86.66 | -79.25 | -82.76 | -92.28 | -101.15 | -100.30 | -66.33 |
| (Per-share) Unit: JPY | |||||||||
| EPS | -4.6 | -4.7 | -9.0 | -5.2 | -5.8 | -5.6 | -4.6 | -6.1 | -1.3 |
| BPS | 37.0 | 32.3 | 23.6 | 23.9 | 22.0 | 22.4 | 19.0 | 19.9 | 28.7 |
| Dividend per Share | 0.00 | 0.00 | 0.00 | 0.00 | 0.00 | 0.00 | 0.00 | 0.00 | 0.00 |
| Shares Outstanding(million shares) | 48.42 | 48.42 | 48.50 | 50.01 | 52.19 | 55.40 | 56.39 | 61.24 | 66.97 |
Source: Omega Investment from company materials
Financial data (full-year basis)
| Unit: million yen | 2015/12 | 2016/12 | 2017/12 | 2018/12 | 2019/12 | 2020/12 | 2021/12 | 2022/12 | 2023/12 | 2024/12 |
| (Income Statement) | ||||||||||
| Sales | 280 | 252 | 260 | 213 | 448 | 481 | 713 | 631 | 682 | 781 |
| Year-on-year | -24.4% | -10.0% | 3.0% | -18.1% | 110.3% | 7.4% | 48.3% | -11.5% | 8.2% | 14.4% |
| Cost of Goods Sold | 225 | 228 | 94 | 107 | 167 | 238 | 292 | 283 | 285 | 348 |
| Gross Income | 55 | 25 | 166 | 106 | 281 | 243 | 421 | 348 | 398 | 433 |
| Gross Income Margin | 19.8% | 9.7% | 64.0% | 49.6% | 62.7% | 50.5% | 59.0% | 55.1% | 58.3% | 55.4% |
| SG&A Expense | 1,325 | 1,067 | 1,054 | 1,645 | 1,683 | 1,526 | 1,755 | 1,606 | 1,603 | 1,464 |
| EBIT (Operating Income) | -1,270 | -1,042 | -888 | -1,539 | -1,402 | -1,284 | -1,334 | -1,259 | -1,205 | -1,031 |
| Year-on-year | 10.0% | -17.9% | -14.8% | 73.4% | -8.9% | -8.4% | 3.9% | -5.7% | -4.2% | -14.5% |
| Operating Income Margin | -453.4% | -413.3% | -341.6% | -723.1% | -313.2% | -266.9% | -187.2% | -199.5% | -176.6% | -132.0% |
| EBITDA | -1,168 | -929 | -877 | -1,532 | -1,397 | -1,280 | -1,331 | -1,257 | -1,204 | -1,030 |
| Pretax Income | -1,281 | -1,501 | -880 | -1,531 | -1,401 | -1,291 | -1,466 | -1,238 | -1,215 | -1,018 |
| Consolidated Net Income | -1,283 | -1,491 | -883 | -1,534 | -1,404 | -1,294 | -1,480 | -1,243 | -1,220 | -1,021 |
| Minority Interest | 0 | 0 | 0 | 0 | 0 | 0 | 0 | 0 | 0 | 0 |
| Net Income ATOP | -1,283 | -1,491 | -883 | -1,534 | -1,404 | -1,294 | -1,480 | -1,243 | -1,220 | -1,021 |
| Year-on-year | 11.5% | 16.3% | -40.8% | 73.8% | -8.5% | -7.8% | 14.4% | -16.0% | -1.8% | -16.3% |
| Net Income Margin | -457.9% | -591.2% | -339.6% | -720.5% | -313.6% | -269.1% | -207.6% | -197.0% | -178.8% | -130.7% |
| (Balance Sheet) | ||||||||||
| Cash & Short-Term Investments | 4,100 | 4,553 | 4,027 | 2,329 | 2,106 | 2,686 | 1,791 | 1,727 | 1,326 | 2,063 |
| Total assets | 4,919 | 4,789 | 4,419 | 2,831 | 2,808 | 3,495 | 2,339 | 2,215 | 1,751 | 2,469 |
| Total Debt | 100 | 54 | 4 | 0 | 0 | 180 | 183 | 184 | 291 | 282 |
| Net Debt | -4,000 | -4,499 | -4,023 | -2,329 | -2,106 | -2,506 | -1,608 | -1,543 | -1,035 | -1,782 |
| Total liabilities | 355 | 224 | 202 | 154 | 187 | 385 | 446 | 425 | 594 | 549 |
| Total Shareholders’ Equity | 4,564 | 4,565 | 4,218 | 2,677 | 2,622 | 3,110 | 1,893 | 1,791 | 1,158 | 1,920 |
| (Cash Flow) | ||||||||||
| Net Operating Cash Flow | -1,245 | -970 | -867 | -1,689 | -1,537 | -1,360 | -1,131 | -1,191 | -1,069 | -1,001 |
| Capital Expenditure | 168 | 11 | 5 | 0 | 0 | 0 | 0 | 0 | 0 | 0 |
| Net Investing Cash Flow | -1,780 | 1,989 | -137 | 0 | -26 | -4 | -35 | 0 | 0 | 0 |
| Net Financing Cash Flow | 124 | 1,434 | 479 | -10 | 1,341 | 1,944 | 271 | 1,127 | 667 | 1,738 |
| (Profitability %) | ||||||||||
| ROA | -22.95 | -30.72 | -19.17 | -42.30 | -49.79 | -41.06 | -50.73 | -54.57 | -61.51 | -48.37 |
| ROE | -24.69 | -32.67 | -20.10 | -44.49 | -52.99 | -45.15 | -59.16 | -67.48 | -82.76 | -66.33 |
| (Per-share) Unit: JPY | ||||||||||
| EPS | -58.3 | -65.9 | -33.5 | -57.3 | -44.6 | -36.1 | -36.7 | -28.3 | -24.6 | -17.5 |
| BPS | 207.0 | 179.3 | 157.5 | 99.9 | 78.8 | 78.7 | 46.4 | 37.0 | 22.0 | 28.7 |
| Dividend per Share | 0.00 | 0.00 | 0.00 | 0.00 | 0.00 | 0.00 | 0.00 | 0.00 | 0.00 | 0.00 |
| Shares Outstanding (million shares) | 22.05 | 25.31 | 26.78 | 26.78 | 33.28 | 39.51 | 40.31 | 48.42 | 52.19 | 66.97 |
Source: Omega Investment from company materials