2026-04-10
Home
Japanese

Omega Investment Co., Ltd.
Sansei Landic (Company note – 4Q update)

| Share price (4/8) | ¥988 | Dividend Yield (25/12 CE) | 4.3 % |
| 52weeks high/low | ¥834/1,156 | ROE(24/12 act) | 8.5 % |
| Avg Vol (3 month) | 22.2 thou shrs | Operating margin (24/12 act) | 7.3 % |
| Market Cap | ¥8.48 bn | Beta (5Y Monthly) | 0.33 |
| Enterprise Value | ¥21.13 bn | Shares Outstanding | 8.584 mn shrs |
| PER (25/12 CE) | 7.6 X | Listed market | TSE Standard |
| PBR (24/12 act) | 0.6 X |
| Click here for the PDF version of this page |
| PDF version |
No surprises in the FY12/2024 results. FY12/2025 is projected to see increased revenue and profit. Laying the foundation for sustainable growth.
◇ FY12/2024 full-year highlights of financial results: Revenue up, profit down, but in line with company forecast
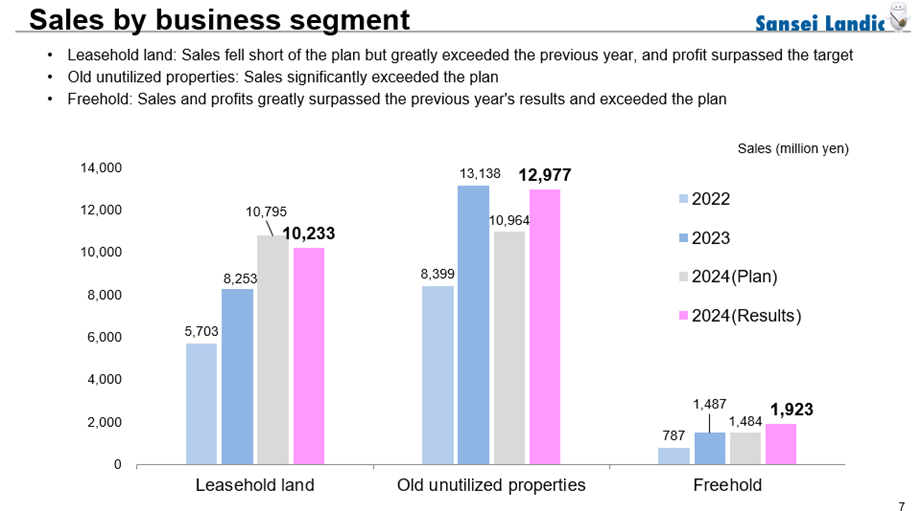
Sansei Landic (hereinafter, “the Company”) announced its financial results for FY12/2024 on February 14, 2025. While profit declined year on year, revenue reached a record high, and both revenue and profit exceeded the Company’s forecasts. Operating income and ordinary income remained above the levels recorded two fiscal years ago. Moreover, the Company’s annual property purchases exceeded its plan, and the financial forecast for FY12/2025 calls for modest growth in both revenue and profit. Overall, the results present a positive impression.
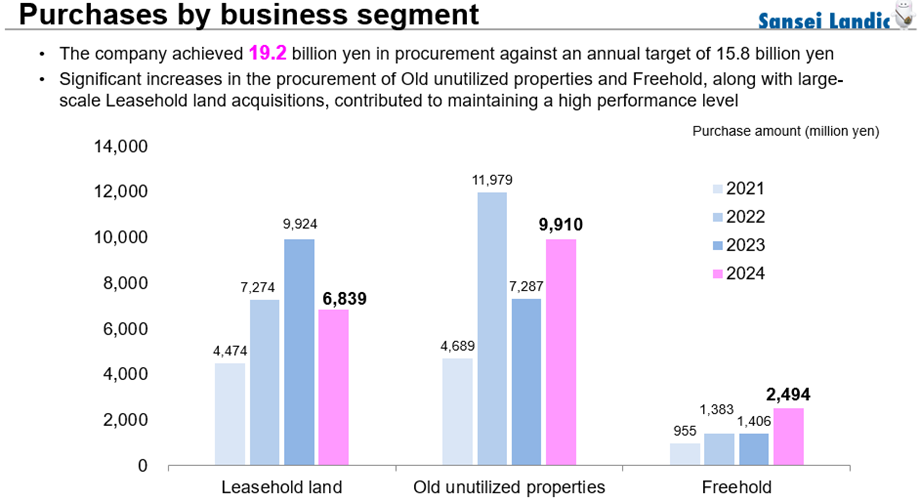
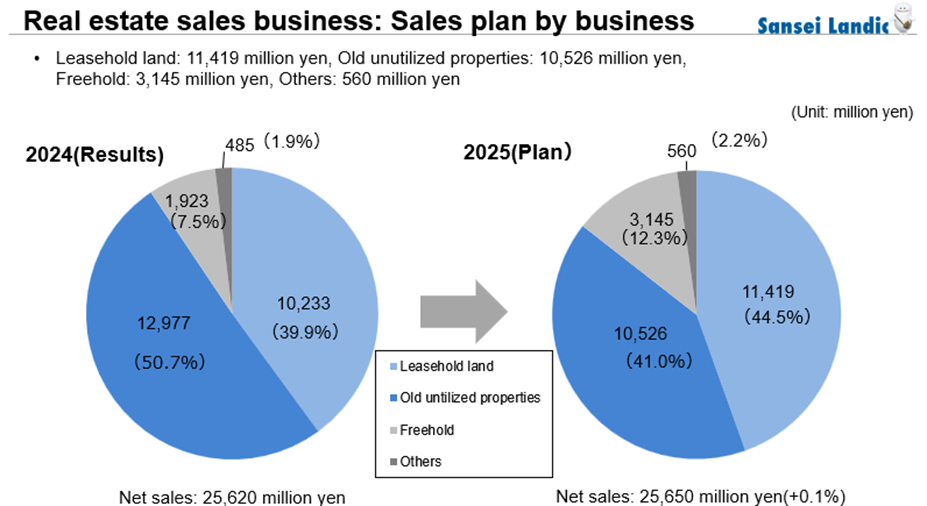
Specifically, sales were 25.62 billion yen (+ 10% YoY), operating income was 1.88 billion yen (- 12% YoY), ordinary income was 1.58 billion yen (- 10% YoY), and net profit attributable to owner of parent was 1.05 billion yen (- 11% YoY). The breakdown of sales was as follows: Leasehold land 10.23 billion yen (+ 24% YoY), Old unutilized properties 12.97 billion yen (- 1% YoY), and Freehold 1.92 billion yen (+ 29% YoY). Although the gross profit margin declined due to underperformance in some Old unutilized properties, the profit margins for Leasehold land and Freehold exceeded expectations. The annual dividend per share was 41 yen (16 yen for the first half and 25 yen for the year-end), an increase of 8 yen from the previous year.
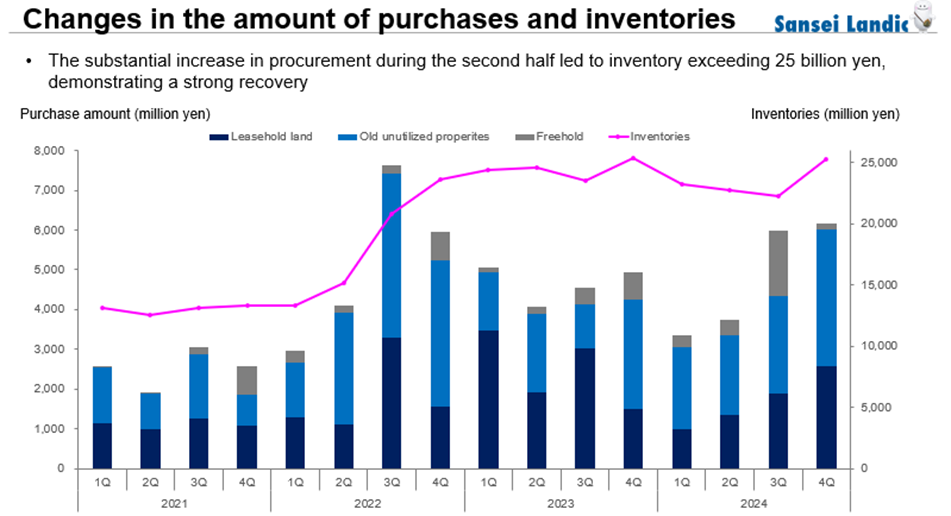
Cumulative property purchases totaled 19.24 billion yen (+ 3% YoY), significantly exceeding the planned 15.8 billion yen. By category, Leasehold land declined to 6.83 billion yen (- 31% YoY), while Old unutilized properties rose to 9.91 billion yen (+ 36% YoY) and Freehold to 2.49 billion yen (+ 77% YoY). Compared to two years ago, Leasehold land was down only 6%, and there seems little need for excessive concern.
On the balance sheet, the balance of real estate for sale was 25.3 billion yen, almost unchanged from the end of the previous fiscal year. While sales activities proceeded smoothly and cash on hand increased, the Company acquired rental real estate, resulting in higher interest-bearing debt. However, the structure of the balance sheet has not changed significantly.
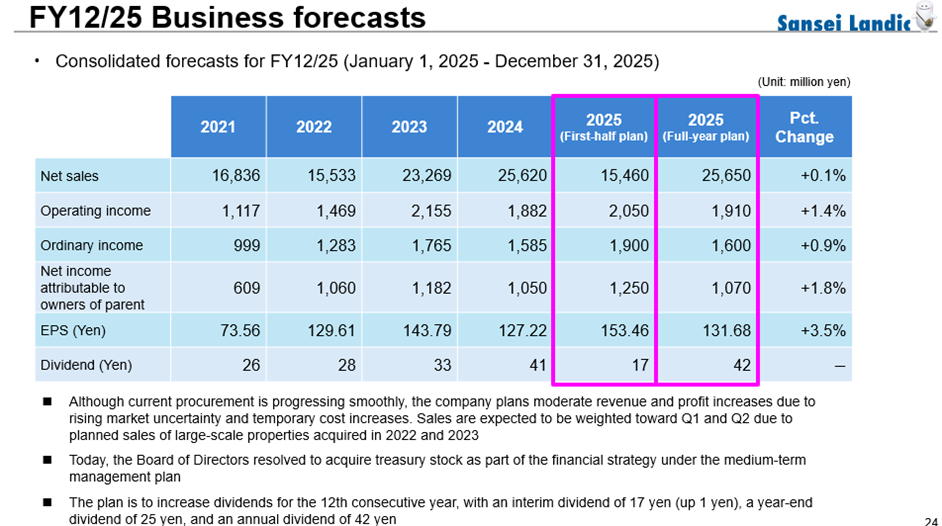
◇ FY12/2025 Financial Forecast: The earnings are biased for 1H. A slight increase in revenue and profit is projected for the full year.
The Company’s financial forecast for FY2025 assumes earnings are biased for the first half, with a slight increase in revenue and profit expected for the full year. Specifically, the first-half forecast includes sales of 15.46 billion yen (+ 19% YoY), operating income of 2.05 billion yen (+ 99% YoY), ordinary income of 1.90 billion yen (+ 120% YoY), and net profit attributable to owner of parent of 1.25 billion yen (+ 118% YoY). The full-year forecast includes sales of 25.65 billion yen (+ 0.1% YoY), operating income of 1.91 billion yen (+ 1.4% YoY), ordinary income of 1.60 billion yen (+ 0.9% YoY), and net profit attributable to owner of parent of 1.07 billion yen (+ 1.8%).
The sales breakdown for the full year is as follows: Leasehold land 11.41 billion yen (+ 11% YoY), Old unutilized properties 10.52 billion yen (- 18% YoY), and Freehold 3.14 billion yen (+ 63% YoY).
The full-year forecast is generally reasonable. This is because purchases and inventories for FY12/2024 were approximately on par with those of FY12/2023, interest rates are rising and uncertainty remains in the real estate market, and the Company aims for steady growth while maintaining its purchase standards.
In addition, fluctuations in semi-annual profit and loss are inevitable due to the nature of the Company’s flow-type business. Large transactions are expected to be concentrated in the first half of this fiscal year.
◇ Strengthened shareholder returns
To supplement the conservative FY12/2025 financial forecast, the Company has strengthened its shareholder return policy. The total shareholder return ratio is expected to exceed 50%, which can be regarded as a shareholder-conscious initiative.
First, the annual dividend per share is projected at 42 yen (17 yen for the first half and 25 yen for the year-end), a 1 yen increase from the previous year. The dividend payout ratio is forecast at 31.9%, remaining nearly unchanged, and this would mark the twelfth consecutive year of dividend increases.
Furthermore, the Company will conduct its third share buyback program. Between February 17, 2025, and May 14, 2025, it plans to repurchase 240,000 shares from the market (equivalent to 2.9% of the total number of outstanding shares, excluding treasury shares) at a total cost of 200 million yen.
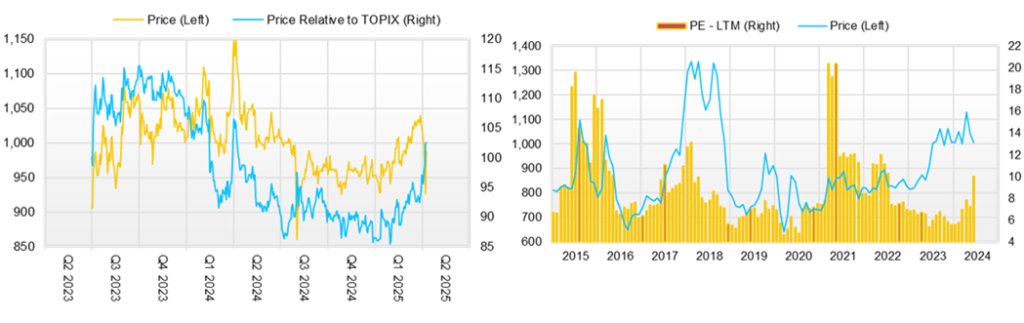
◇ Share price trend and future highlights
Following the announcement of the Q2 financial results and the new medium-term management plan on August 9, the stock price has gradually increased, moving within the 950 yen to 1,000 yen range. Although the stock price temporarily declined after the announcement of the latest financial results, it quickly rebounded. With a valuation of PER of 8 times forecast earnings, PBR of 0.65 times, and a forecast dividend yield of 4.2%, there is no sign of overheating of the share price. This suggests the market rates the Company’s stable growth path and proactive shareholder returns well.
From this perspective, key points to monitor going forward include:
– Trends in the real estate market,
– The trajectory of purchases and earnings for the full FY12/2025,
– Progress updates on the new medium-term management plan – notably, the effects of strengthening measures in the core businesses of Leasehold land and Old unutilized properties, results of commercialization assessments in derivative businesses such as co- ownership, ownership period, and leasehold rights, and the initial developments in the regional revitalization business. Should the Company’s performance plateau in the second half, it will be necessary to hear some positive updates in these areas around that time.
Additionally, the Company is currently restructuring its branding strategy. This could increase recognition of its real estate businesses, such as Leasehold land, and strengthen the Company’s positioning. With its 50th anniversary coming up in February 2026, positive expectations, including for shareholder returns, are likely to rise.
Company profile
Sansei Landic Co., Ltd. operates a real estate rights adjustment business. The Company makes a profit by adjusting the rights to properties it has purchased, mainly leasehold land and old unutilized properties, and then reselling them. It has captured stable profit opportunities in niche markets. In August 2024, the Company announced a new medium-term plan covering the period from August 2024 to fiscal 2027. ROE and PBR are expected to improve due to the growth strategy and improved capital efficiency.
Key financial data
| Unit: million yen | 2020/12 | 2021/12 | 2022/12 | 2023/12 | 2024/12 | 2025/12 CE |
| Sales | 17,775 | 16,836 | 15,533 | 23,269 | 25,620 | 25,650 |
| EBIT (Operating Income) | 847 | 1,118 | 1,469 | 2,155 | 1,883 | 1,910 |
| Pretax Income | 712 | 1,004 | 1,270 | 1,756 | 1,585 | 1,600 |
| Net Profit Attributable to Owner of Parent | 358 | 609 | 1,060 | 1,183 | 1,051 | 1,070 |
| Cash & Short-Term Investments | 4,330 | 5,361 | 3,837 | 3,770 | 5,013 | |
| Total assets | 20,071 | 20,051 | 28,977 | 30,976 | 33,107 | |
| Total Debt | 16,879 | 16,879 | 16,879 | 16,879 | 18,506 | |
| Net Debt | 13,109 | 13,109 | 13,109 | 13,109 | 13,493 | |
| Total liabilities | 10,004 | 9,749 | 17,921 | 18,899 | 20,349 | |
| Total Shareholders’ Equity | 12,077 | 12,077 | 12,077 | 12,077 | 12,759 | |
| Net Operating Cash Flow | -917 | 1,705 | -9,268 | -12 | 1,143 | |
| Capital Expenditure | 21 | 40 | 28 | 304 | 138 | |
| Net Investing Cash Flow | -288 | -51 | -267 | -766 | -715 | |
| Net Financing Cash Flow | 953 | -608 | 7,971 | 303 | 1,223 | |
| Free Cash Flow | -291 | -291 | -291 | -291 | 1,049 | |
| ROA (%) | 1.82 | 3.04 | 4.32 | 3.95 | 3.28 | |
| ROE (%) | 3.58 | 5.98 | 9.93 | 10.23 | 8.46 | |
| EPS (Yen) | 42.3 | 73.6 | 129.6 | 143.8 | 127.2 | 129.3 |
| BPS (Yen) | 1,192.9 | 1,249.5 | 1,356.8 | 1,465.5 | 1,541.8 | |
| Dividend per Share (Yen) | 25.00 | 26.00 | 28.00 | 33.00 | 41.00 | 42.00 |
| Shares Outstanding (Million Shares) | 8.47 | 8.47 | 8.49 | 8.58 | 8.58 |
Source: Omega Investment from company data, rounded to the nearest whole number.
Share price
FY12/24 full-year financial result
Source: Company materials
Source: Company materials
Source: Company materials
Source: Company materials
Source: Company materials
Source: Company materials
Financial data (quarterly basis)
| Unit: million yen | 2022/12 | 2023/12 | 2024/12 | ||||||
| 4Q | 1Q | 2Q | 3Q | 4Q | 1Q | 2Q | 3Q | 4Q | |
| (Income Statement) | |||||||||
| Sales | 4,272 | 6,486 | 5,494 | 7,485 | 3,804 | 7,207 | 5,785 | 8,358 | 4,270 |
| Year-on-year | 17.4% | 45.9% | 47.6% | 141.8% | -11.0% | 11.1% | 5.3% | 11.7% | 12.3% |
| Cost of Goods Sold (COGS) | 3,065 | 4,320 | 3,858 | 5,681 | 3,067 | 5,521 | 4,228 | 6,448 | 3,122 |
| Gross Income | 1,207 | 2,166 | 1,635 | 1,803 | 737 | 1,686 | 1,558 | 1,910 | 1,149 |
| Gross Income Margin | 28.2% | 33.4% | 29.8% | 24.1% | 19.4% | 23.4% | 26.9% | 22.9% | 26.9% |
| SG&A Expense | 938 | 1,048 | 1,097 | 1,128 | 914 | 1,115 | 1,102 | 1,125 | 1,077 |
| EBIT (Operating Income) | 269 | 1,118 | 539 | 676 | -177 | 571 | 455 | 785 | 72 |
| Year-on-year | 197.7% | 150.0% | 15.6% | 135.5% | -165.8% | -49.0% | -15.5% | 16.2% | -140.5% |
| Operating Income Margin | 6.3% | 17.2% | 9.8% | 9.0% | -4.7% | 7.9% | 7.9% | 9.4% | 1.7% |
| EBITDA | 286 | 1,145 | 559 | 692 | -161 | 587 | 476 | 806 | 92 |
| Pretax Income | 205 | 1,046 | 378 | 587 | -254 | 493 | 369 | 728 | -4 |
| Consolidated Net Income | 151 | 684 | 256 | 387 | -144 | 328 | 245 | 485 | -7 |
| Minority Interest | 0 | 0 | 0 | 0 | 0 | 0 | 0 | 0 | 0 |
| Net Income ATOP | 151 | 684 | 256 | 387 | -144 | 328 | 245 | 485 | -7 |
| Year-on-year | 145.2% | 82.2% | -24.4% | 97.9% | -195.1% | -52.0% | -4.0% | 25.2% | -94.9% |
| Net Income Margin | 3.5% | 10.5% | 4.7% | 5.2% | -3.8% | 4.6% | 4.2% | 5.8% | -0.2% |
| (Balance Sheet) | |||||||||
| Cash & Short-Term Investments | 3,837 | 3,569 | 4,266 | 5,388 | 3,770 | 4,479 | 4,988 | 4,728 | 5,013 |
| Total assets | 28,977 | 29,627 | 30,777 | 30,632 | 30,976 | 30,487 | 30,561 | 29,940 | 33,107 |
| Total Debt | 16,399 | 16,061 | 16,520 | 16,262 | 16,879 | 16,787 | 16,211 | 15,595 | 18,506 |
| Net Debt | 12,562 | 12,493 | 12,254 | 10,874 | 13,109 | 12,308 | 11,223 | 10,867 | 13,493 |
| Total liabilities | 17,921 | 18,064 | 18,944 | 18,412 | 18,899 | 18,354 | 18,163 | 17,173 | 20,349 |
| Total Shareholders’ Equity | 11,056 | 11,563 | 11,833 | 12,220 | 12,077 | 12,133 | 12,398 | 12,768 | 12,759 |
| (Profitability %) | |||||||||
| ROA | 4.32 | 5.50 | 4.81 | 5.08 | 3.95 | 2.75 | 2.66 | 3.02 | 3.28 |
| ROE | 9.93 | 12.43 | 11.42 | 12.79 | 10.23 | 6.98 | 6.74 | 7.32 | 8.46 |
| (Per-share) Unit: JPY | |||||||||
| EPS | 18.6 | 83.5 | 31.0 | 47.0 | -17.4 | 39.8 | 29.7 | 58.6 | -1.0 |
| BPS | 1,356.8 | 1,406.1 | 1,435.9 | 1,482.9 | 1,465.5 | 1,472.3 | 1,501.2 | 1,542.9 | 1,541.8 |
| Dividend per Share | 28.00 | 0.00 | 0.00 | 0.00 | 33.00 | 0.00 | 16.00 | 0.00 | 25.00 |
| Shares Outstanding(Million shares) | 8.49 | 8.58 | 8.58 | 8.58 | 8.58 | 8.58 | 8.58 | 8.58 | 8.58 |
Source: Omega Investment from company materials
Financial data (full-year basis)
| Unit: million yen | 2014/12 | 2015/12 | 2016/12 | 2017/12 | 2018/12 | 2019/12 | 2020/12 | 2021/12 | 2022/12 | 2023/12 | 2024/12 |
| (Income Statement) | |||||||||||
| Sales | 10,446 | 11,569 | 12,300 | 13,099 | 16,833 | 18,020 | 17,775 | 16,836 | 15,533 | 23,269 | 25,620 |
| Year-on-year | 13.7% | 10.8% | 6.3% | 6.5% | 28.5% | 7.1% | -1.4% | -5.3% | -7.7% | 49.8% | 10.1% |
| Cost of Goods Sold | 7,055 | 7,798 | 8,344 | 8,566 | 12,028 | 12,902 | 13,788 | 12,468 | 10,486 | 16,927 | 19,318 |
| Gross Income | 3,391 | 3,770 | 3,957 | 4,532 | 4,805 | 5,119 | 3,986 | 4,368 | 5,047 | 6,342 | 6,302 |
| Gross Income Margin | 32.5% | 32.6% | 32.2% | 34.6% | 28.5% | 28.4% | 22.4% | 25.9% | 32.5% | 27.3% | 24.6% |
| SG&A Expense | 2,204 | 2,216 | 2,295 | 2,434 | 2,702 | 2,891 | 2,750 | 2,877 | 3,031 | 3,569 | 4,420 |
| EBIT (Operating Income) | 1,187 | 1,300 | 1,446 | 1,762 | 1,766 | 1,861 | 847 | 1,118 | 1,469 | 2,155 | 1,883 |
| Year-on-year | 31.6% | 9.6% | 11.2% | 21.9% | 0.2% | 5.4% | -54.5% | 31.9% | 31.5% | 46.7% | -12.6% |
| Operating Income Margin | 11.4% | 11.2% | 11.8% | 13.5% | 10.5% | 10.3% | 4.8% | 6.6% | 9.5% | 9.3% | 7.3% |
| EBITDA | 1,260 | 1,406 | 1,532 | 1,833 | 1,822 | 1,912 | 896 | 1,161 | 1,517 | 2,236 | 1,962 |
| Pretax Income | 1,044 | 1,196 | 1,329 | 1,672 | 1,539 | 1,759 | 712 | 1,004 | 1,270 | 1,756 | 1,585 |
| Consolidated Net Income | 626 | 724 | 854 | 1,111 | 1,007 | 1,159 | 358 | 609 | 1,060 | 1,183 | 1,051 |
| Minority Interest | 0 | 0 | 0 | 0 | 0 | 0 | 0 | 0 | 0 | 0 | 0 |
| Net Income ATOP | 626 | 724 | 854 | 1,111 | 1,007 | 1,159 | 358 | 609 | 1,060 | 1,183 | 1,051 |
| Year-on-year | 37.5% | 15.6% | 17.9% | 30.2% | -9.4% | 15.1% | -69.1% | 70.5% | 73.9% | 11.6% | -11.2% |
| Net Income Margin | 6.0% | 6.3% | 6.9% | 8.5% | 6.0% | 6.4% | 2.0% | 3.6% | 6.8% | 5.1% | 4.1% |
| (Balance Sheet) | |||||||||||
| Cash & Short-Term Investments | 2,276 | 2,254 | 2,435 | 3,558 | 3,594 | 4,134 | 4,330 | 5,361 | 3,837 | 3,770 | 5,013 |
| Total assets | 8,793 | 11,398 | 10,833 | 16,916 | 16,777 | 19,294 | 20,071 | 20,051 | 28,977 | 30,976 | 33,107 |
| Total Debt | 2,414 | 3,958 | 2,712 | 7,439 | 6,048 | 7,203 | 8,342 | 8,108 | 16,399 | 16,879 | 18,506 |
| Net Debt | 139 | 1,704 | 277 | 3,881 | 2,454 | 3,069 | 4,012 | 2,747 | 12,562 | 13,109 | 13,493 |
| Total liabilities | 3,531 | 5,363 | 3,977 | 8,909 | 7,869 | 9,399 | 10,004 | 9,749 | 17,921 | 18,899 | 20,349 |
| Total Shareholders’ Equity | 5,262 | 6,034 | 6,856 | 8,006 | 8,908 | 9,895 | 10,067 | 10,302 | 11,056 | 12,077 | 12,759 |
| (Cash Flow) | |||||||||||
| Net Operating Cash Flow | 1,761 | -1,451 | 1,611 | -3,666 | 1,617 | -420 | -917 | 1,705 | -9,268 | -12 | 1,143 |
| Capital Expenditure | 91 | 58 | 111 | 57 | 66 | 61 | 21 | 40 | 28 | 304 | 138 |
| Net Investing Cash Flow | -111 | -116 | -184 | 107 | -64 | -71 | -288 | -51 | -267 | -766 | -715 |
| Net Financing Cash Flow | -612 | 1,588 | -1,278 | 4,667 | -1,495 | 984 | 953 | -608 | 7,971 | 303 | 1,223 |
| Free Cash Flow | 1,697 | -1,491 | 1,536 | -3,692 | 1,572 | -446 | -923 | 1,682 | -9,282 | -291 | 1,049 |
| (Profitability %) | |||||||||||
| ROA | 7.07 | 7.17 | 7.68 | 8.01 | 5.98 | 6.42 | 1.82 | 3.04 | 4.32 | 3.95 | 3.28 |
| ROE | 13.72 | 12.82 | 13.24 | 14.96 | 11.90 | 12.32 | 3.58 | 5.98 | 9.93 | 10.23 | 8.46 |
| (Per-share) Unit: JPY | |||||||||||
| EPS | 90.2 | 90.1 | 104.9 | 134.4 | 119.6 | 137.1 | 42.3 | 73.6 | 129.6 | 143.8 | 127.2 |
| BPS | 664.8 | 744.2 | 841.3 | 958.0 | 1,054.5 | 1,170.2 | 1,192.9 | 1,249.5 | 1,356.8 | 1,465.5 | 1,541.8 |
| Dividend per Share | 6.00 | 10.00 | 12.00 | 18.00 | 21.00 | 23.00 | 25.00 | 26.00 | 28.00 | 33.00 | 41.00 |
| Shares Outstanding (Million shares) | 7.91 | 8.11 | 8.15 | 8.35 | 8.45 | 8.46 | 8.47 | 8.47 | 8.49 | 8.58 | 8.58 |
Source: Omega Investment from company materials