2026-03-12
Home
Japanese

Omega Investment Co., Ltd.
Hamee (Company note – Q3 update)

| Share price (4/14) | ¥1,136 | Dividend Yield (25/4 CE) | 1.9 % |
| 52weeks high/low | ¥830/1,425 | ROE(24/4) | 11.8 % |
| Avg Vol (3 month) | 58 thou shrs | Operating margin (24/4) | 10.9 % |
| Market Cap | ¥18.5 bn | Beta (5Y Monthly) | 1.3 |
| Enterprise Value | ¥18.1 bn | Shares Outstanding | 16.3 mn shrs |
| PER (25/4 CE) | 13.3 X | Listed market | TSE Standard |
| PBR (24/4 act) | 1.7 X |
| Click here for the PDF version of this page |
| PDF version |
Cumulative Q3 results: Significant increases in net sales and operating profit, surpassing company forecasts.
◇ Q3 FY04/2025 financial highlights: Substantial increases in revenue and profit
Hamee (hereinafter, the Company) announced its financial results for the third quarter of FY04/2025 on March 14, 2025, reporting significant increases in net sales, operating profit, ordinary profit, and quarterly net profit attributable to owner of parent. Net sales, operating profit, and ordinary profit all exceeded the Company’s forecast. Quarterly net profit attributable to owner of parent appears to have landed within the expected range, despite the posting of valuation losses on equity-method affiliates.
Specifically, for the cumulative Q3 period, the Company recorded net sales of 17.33 billion yen (+35% YoY), operating profit of 1.93 billion yen (+42% YoY), ordinary profit of 2.02 billion yen (+40% YoY), and quarterly net profit attributable to owner of parent of 1.06 billion yen (+53% YoY). The third quarter represents the Company’s peak period. It performed well during this phase, making significant progress toward its full-year forecast (net sales: 87%, operating profit: 93%).
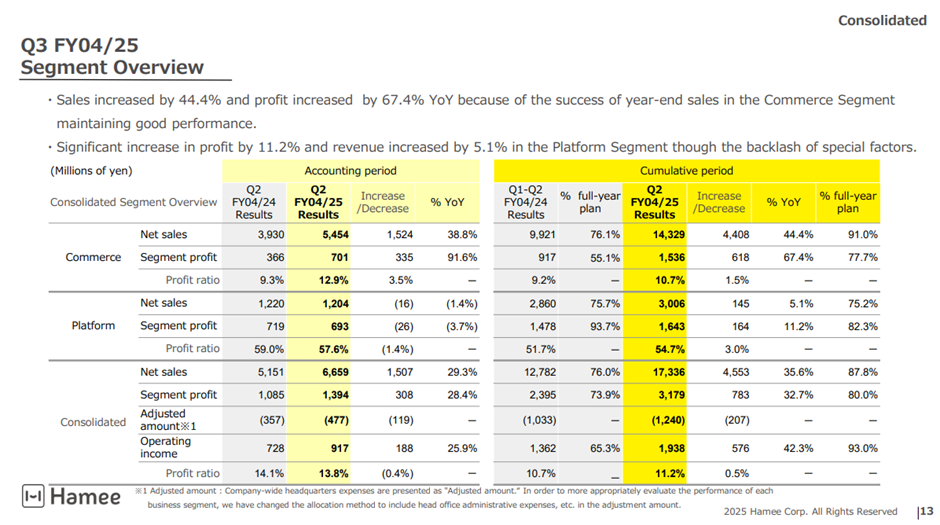
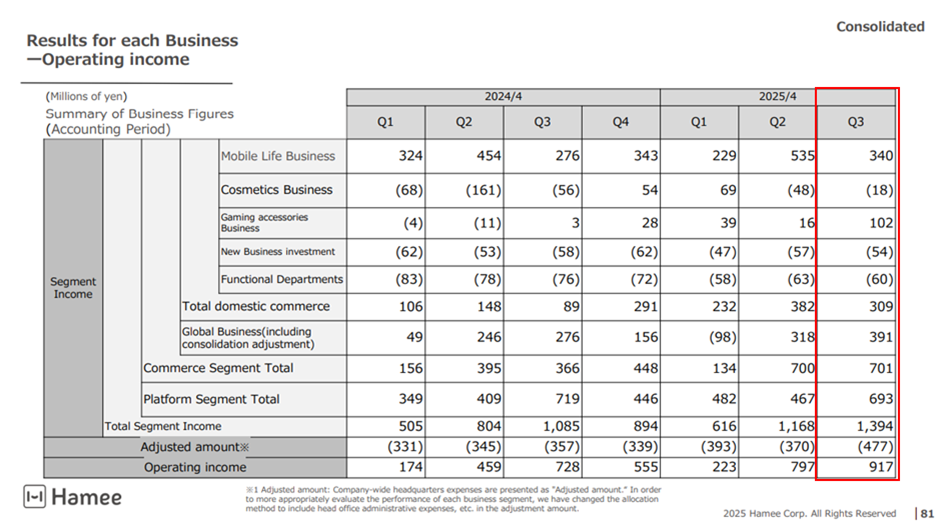
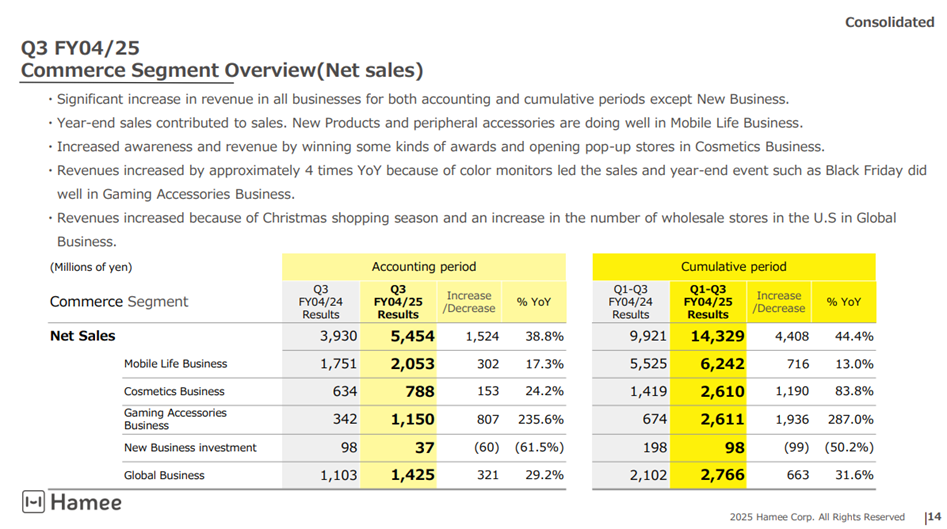
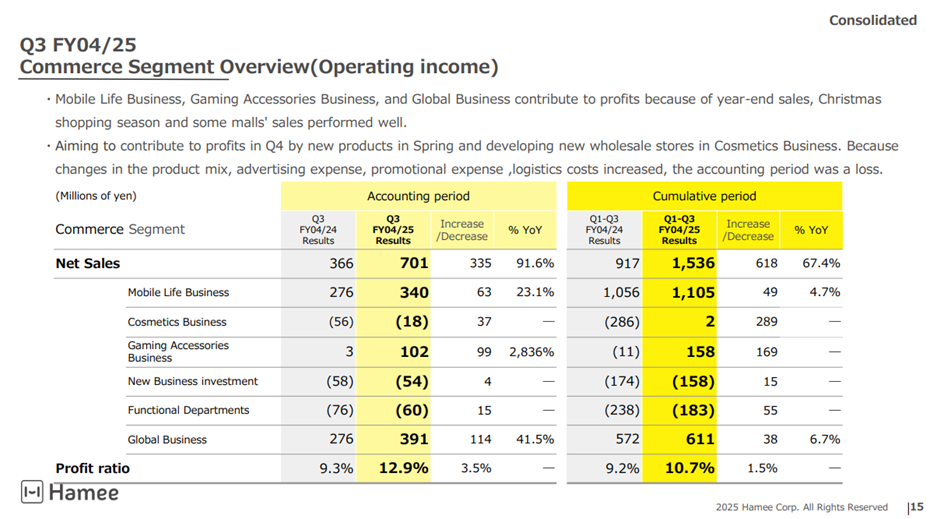
By segment, the Commerce Segment posted a 44% increase in revenue and a 67% increase in profit, while the Platform Segment recorded a 5% increase in revenue and an 11% increase in profit. Both segments continue to show steady growth. Overall, the results are positive.
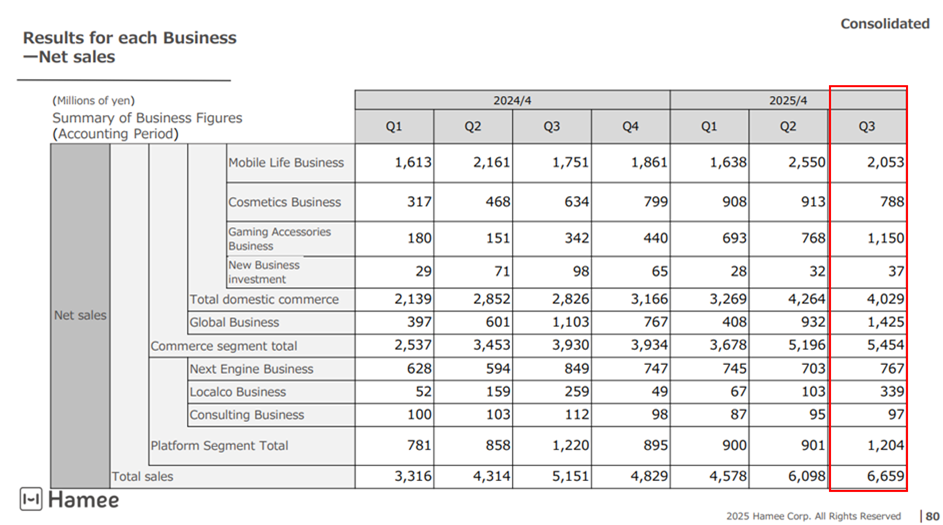
When looking at the Commerce Segment in more detail, the Mobile Life, Cosmetics, Gaming Accessories, and Global Businesses all recorded steady revenue growth. The Company is reducing dependence on any single business and gradually forming a diversified business portfolio.
The Mobile Life Business continues to contribute steadily to profits. Accessories leveraging the latest iPhone models and MagSafe functionality performed well, and the product lineup is expanding to include new series, such as BeBling and cases compatible with Galaxy devices. Sales have been in line with expectations, leading to steady profit growth.
The Gaming Accessories Business posted a high revenue growth rate and began contributing to profits. Under spatial appeal, the Company launched a lineup of high-performance new monitors in various colors, including white, along with original monitor arms and other accessories, resulting in a sharp increase in sales. Going forward, the Company plans to strengthen its lineup of monitor-related peripherals and enhance customer engagement through digital transformation (DX) to achieve sustainable growth.
The Global Business also performed strongly, benefiting from the Christmas shopping season. Sales channels in the U.S. are expanding, and plans are underway to expand into South Korea and Europe. Manufacturing profits are also increasing.
A challenge was seen in the Cosmetics Business. While quarterly sales continued to increase YoY, they declined QoQ in Q3. This was due to a shift in popular products from base makeup to skincare items and a rise in promotional expenses, which led to modest profit growth. However, new product launches are scheduled for Q4, and the Company is enhancing promotional efforts targeting consumers in their teens to 30s, suggesting the potential for profit recovery.
The Platform Segment is steadily growing in real terms.
At first glance, growth may have slowed compared to Q2, but this is primarily due to a one-time revenue boost of 140 million yen in Q3 of the previous year, resulting from a sales collaboration with Mercari. Excluding this effect, segment net sales are estimated to have increased 10.5% YoY, and operating profit rose 22.7% YoY, indicating continued healthy growth. The segment operating margin also rose by three percentage points to 54.7%, reflecting a highly profitable structure appropriate for the Platform Business.
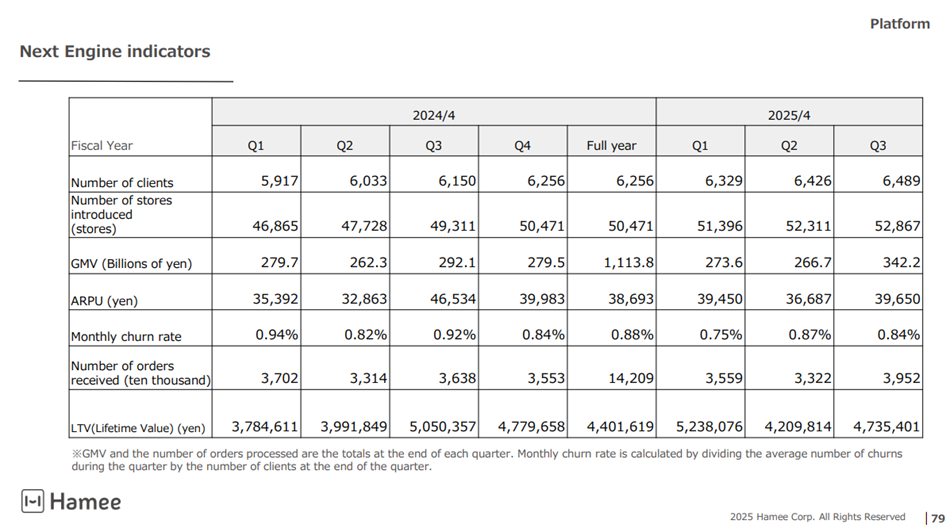
The core NextEngine Business remains highly profitable. The number of clients continues to grow net, the churn rate remains low and stable, and the number of processed orders steadily increases. Order volume from high-spending clients has been growing steadily against a recovery in consumer demand within the e-commerce market. ARPU saw a slight increase for the Q3 accounting period (November to January), excluding the temporary impact of the Mercari-related boost.
The Localco and Consulting Businesses are also generating solid profits. However, the launch of the encer mall business is off to a slow start.
Like the Commerce Segment, the e-commerce market is expected to remain firm for Q4 due to seasonal demand related to the new lifestyle season. The Platform Segment—centered on the NextEngine Business—is also projected to maintain steady performance.
◇ Full-Year Forecast: No Change from Initial Plan
There have been no changes to the full-year earnings or dividend forecasts. The Company continues to project net sales of 19.74 billion yen (+12% YoY), operating profit of 2.08 billion yen (+8% YoY), ordinary profit of 2.05 billion yen (+1% YoY), and net profit attributable to owner of parent of 1.36 billion yen (+21% YoY). Earnings per share are projected to be 83.69 yen, and the annual dividend per share is expected to remain unchanged at 22.50 yen.
As mentioned earlier, progress through the cumulative Q3 period is substantial. In Q4, the Commerce Segment is expected to benefit from demand related to the new lifestyle season and product rollouts. At the same time, similar effects are also anticipated in the Platform Segment. The success of several major game titles in the gaming market may also serve as a tailwind for the Company’s gaming accessories.
The full-year forecast remains unchanged due to the Company’s conservative disclosure policy, and there appears to be no indication of any significant negative factors anticipated for Q4.
It should also be noted that the reorganization plan involving a stock distribution-type spin-off of NE Corporation, which oversees the Platform Segment, and its planned listing has not changed. The Company intends to apply for NE Inc.’s listing in 2025.
◇ Stock Price Trend and Key Points to Watch Going Forward
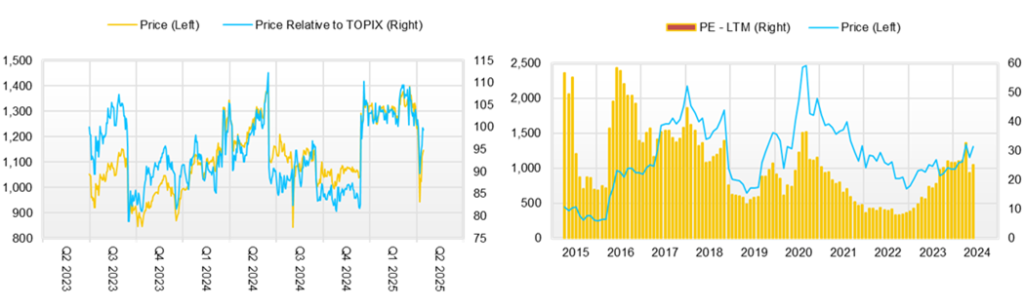
Following the announcement of Q1 results in September, the stock price generally hovered in the 1,000–1,100 yen range. However, after the Q2 results were announced, the stock rose to the 1,200–1,400 yen range on increased trading volume. Since the announcement of Q3 results, the stock price has continued to trade within this range, but there are signs of upward momentum.
This trend may be attributed to several factors: both segments delivered strong results again in Q3 following Q2; expectations are rising that Q4 results will exceed the Company’s forecast; and anticipation is building that the upcoming spin-off IPO will eliminate the conglomerate discount and lead to further gains in the stock price. In terms of valuation, the stock is trading at a PER of 15.2x and a PBR of 2.0x based on the Company’s forecast EPS, suggesting potential for further re-rating.
Key points to watch in the near term include:
(1) The extent to which full-year results exceed the Company’s forecast;
(2) In the Commerce Segment, whether the Mobile Life Business continues its growth trajectory and whether the Gaming Accessories and Global Businesses also maintain momentum, with the Cosmetics Business showing signs of a renewed growth phase and improved profitability;
(3) In the Platform Segment, whether the number of processed orders and ARPU increase steadily, leveraging the recovery of the e-commerce market, thereby reinforcing the Company’s position as an e-commerce platformer and maintaining high profitability;
(4) Whether the recently added Localco Business, including its e-commerce sales of traditional crafts, helps drive further growth of the Platform Segment; and
(5) Progress in materializing the organizational restructuring plan.
Company profile
◇Hamee Corp. (hereafter referred to as the Company) was founded in 1997, went public on the TSE Mothers in 2015 and is currently listed on the Standard Market. The Company operates through the Spin-off of two segments. The Commerce Segment, which includes Mobile Accessories, the Cosmetics Business, the Gaming Accessories Business, and the Global Business. the Platform Segment is mainly engaged in the provision of cloud-based (SaaS) EC Attractions “NextEngine”, which automates operations related to online shop management and enables cross-mall, multi-store order processing and centralized inventory management.
The Company is planning a reorganization by 2025. It plans to conduct a share-distribution-type spin-off of NE Inc., which is in charge of the Platform Segment, and list NE Inc. on the stock exchange. This series of reorganizations aims to avoid the conglomerate discount, efficiently operate each of the two segments, and appropriately and timely reflect the value of each business in the share price.
Key financial data
| Unit: million yen | 2020/4 | 2021/4 | 2022/4 | 2023/4 | 2024/4 | 2025/4 CE |
| Sales | 11,325 | 12,363 | 13,413 | 14,038 | 17,612 | 19,745 |
| EBIT (Operating Income) | 1,745 | 2,180 | 2,202 | 1,251 | 1,964 | |
| Pretax Income | 1,582 | 2,144 | 2,463 | 1,396 | 2,009 | |
| Net Profit Attributable to Owner of Parent | 1,069 | 1,556 | 1,744 | 945 | 1,122 | 1,362 |
| Cash & Short-Term Investments | 3,453 | 3,355 | 4,026 | 3,536 | 4,022 | |
| Total assets | 8,097 | 8,342 | 10,524 | 12,392 | 14,885 | |
| Total Debt | 1,740 | 104 | 544 | 1,300 | 2,327 | |
| Net Debt | -1,713 | -3,251 | -3,482 | -2,236 | -1,694 | |
| Total liabilities | 3,272 | 1,814 | 2,271 | 3,431 | 4,728 | |
| Total Shareholders’ Equity | 4,824 | 6,528 | 8,253 | 8,961 | 10,157 | |
| Net Operating Cash Flow | 1,934 | 1,941 | 1,186 | 695 | 886 | |
| Capital Expenditure | 649 | 351 | 1,018 | 487 | 477 | |
| Net Investing Cash Flow | -1,020 | -412 | -886 | -1,507 | -877 | |
| Net Financing Cash Flow | 933 | -1,736 | 298 | 263 | 380 | |
| Free Cash Flow | 1,440 | 1,760 | 362 | 405 | 577 | |
| ROA (%) | 15.43 | 18.94 | 18.49 | 8.25 | 8.22 | |
| ROE (%) | 23.73 | 27.42 | 23.60 | 10.98 | 11.73 | |
| EPS (Yen) | 67.4 | 98.4 | 109.7 | 59.4 | 70.4 | 85.4 |
| BPS (Yen) | 305.5 | 411.1 | 519.1 | 563.0 | 637.6 | |
| Dividend per Share (Yen) | 7.00 | 10.00 | 22.50 | 22.50 | 22.50 | 22.50 |
| Shares Outstanding (Million Shares) | 16.10 | 16.21 | 16.27 | 16.27 | 16.28 |
Source: Omega Investment from company data, rounded to the nearest whole number.
Share price
Overview of Q3 FY04/2025
Overview of Company-wide Performance
Source: Company material
Source: Company material
Source: Company material
Source: Company material
Source: Company material
Source: Company material
Financial data (quarterly basis)
| Unit: million yen | 2023/04 | 2024/04 | 2025/04 | ||||||
| 3Q | 4Q | 1Q | 2Q | 3Q | 4Q | 1Q | 2Q | 3Q | |
| (Income Statement) | |||||||||
| Sales | 3,909 | 3,496 | 3,317 | 4,315 | 5,151 | 4,829 | 4,579 | 6,099 | 6,659 |
| Year-on-year | -3.0% | 1.8% | 6.8% | 22.3% | 31.8% | 38.1% | 38.1% | 41.3% | 29.3% |
| Cost of Goods Sold (COGS) | 1,410 | 1,517 | 1,279 | 1,631 | 1,858 | 1,977 | 1,841 | 2,628 | 2,668 |
| Gross Income | 2,499 | 1,979 | 2,038 | 2,684 | 3,293 | 2,852 | 2,738 | 3,471 | 3,991 |
| Gross Income Margin | 63.9% | 56.6% | 61.4% | 62.2% | 63.9% | 59.1% | 59.8% | 56.9% | 59.9% |
| SG&A Expense | 1,903 | 1,894 | 1,863 | 2,224 | 2,565 | 2,306 | 2,505 | 2,691 | 3,074 |
| EBIT (Operating Income) | 595 | 85 | 187 | 470 | 756 | 551 | 233 | 780 | 917 |
| Year-on-year | -19.5% | -74.0% | -24.8% | 44.1% | 27.0% | 545.8% | 24.7% | 65.9% | 21.3% |
| Operating Income Margin | 15.2% | 2.4% | 5.6% | 10.9% | 14.7% | 11.4% | 5.1% | 12.8% | 13.8% |
| EBITDA | 724 | 332 | 377 | 670 | 953 | 749 | 435 | 941 | 1,163 |
| Pretax Income | 485 | 174 | 205 | 492 | 737 | 576 | 200 | 811 | 702 |
| Consolidated Net Income | 320 | 130 | -133 | 334 | 492 | 428 | 101 | 564 | 400 |
| Minority Interest | 0 | 0 | 0 | 0 | 0 | 0 | 0 | 0 | 0 |
| Net Income ATOP | 320 | 130 | -133 | 334 | 492 | 428 | 101 | 564 | 400 |
| Year-on-year | -36.6% | -55.8% | -164.0% | 16.1% | 53.6% | 228.4% | -176.6% | 68.8% | -18.6% |
| Net Income Margin | 8.2% | 3.7% | -4.0% | 7.8% | 9.5% | 8.9% | 2.2% | 9.3% | 6.0% |
| (Balance Sheet) | |||||||||
| Cash & Short-Term Investments | 3,396 | 3,536 | 3,176 | 2,983 | 3,430 | 4,022 | 3,642 | 3,912 | 4,204 |
| Total assets | 12,374 | 12,392 | 12,350 | 13,197 | 14,210 | 14,885 | 15,295 | 16,838 | 18,197 |
| Total Debt | 1,008 | 1,300 | 1,700 | 1,650 | 1,928 | 2,327 | 3,232 | 3,980 | 3,927 |
| Net Debt | -2,388 | -2,236 | -1,476 | -1,333 | -1,502 | -1,694 | -410 | 68 | -277 |
| Total liabilities | 3,460 | 3,431 | 3,608 | 4,040 | 4,566 | 4,728 | 5,242 | 6,490 | 7,553 |
| Total Shareholders’ Equity | 8,914 | 8,961 | 8,742 | 9,156 | 9,644 | 10,157 | 10,053 | 10,348 | 10,644 |
| (Profitability %) | |||||||||
| ROA | 9.64 | 8.25 | 5.31 | 5.29 | 6.20 | 8.22 | 9.81 | 10.56 | 9.22 |
| ROE | 13.26 | 10.98 | 7.12 | 7.41 | 8.88 | 11.73 | 14.43 | 16.26 | 14.73 |
| (Per-share) Unit: yen | |||||||||
| EPS | 20.1 | 8.2 | -8.3 | 21.0 | 30.9 | 26.9 | 6.4 | 35.4 | 25.1 |
| BPS | 560.4 | 563.0 | 549.2 | 575.0 | 605.6 | 637.6 | 630.7 | 648.8 | 667.4 |
| Dividend per Share | 0.00 | 22.50 | 0.00 | 0.00 | 0.00 | 22.50 | 0.00 | 0.00 | 0.00 |
| Shares outstanding (Million Shares) | 16.27 | 16.28 | 16.28 | 16.28 | 16.28 | 16.28 | 16.29 | 16.29 | 16.29 |
Source: Omega Investment from company materials
Financial data (full-year basis)
| Unit: million yen | 2016/04 | 2017/04 | 2018/04 | 2019/04 | 2020/04 | 2021/04 | 2022/04 | 2023/04 | 2024/04 |
| (Income Statement) | |||||||||
| Sales | 6,500 | 8,503 | 9,379 | 10,300 | 11,325 | 12,363 | 13,413 | 14,038 | 17,612 |
| Year-on-year | 14.9% | 30.8% | 10.3% | 9.8% | 10.0% | 9.2% | 8.5% | 4.7% | 25.5% |
| Cost of Goods Sold | 3,816 | 4,485 | 4,618 | 5,056 | 4,894 | 4,802 | 4,892 | 5,563 | 6,745 |
| Gross Income | 2,684 | 4,018 | 4,761 | 5,244 | 6,431 | 7,562 | 8,522 | 8,476 | 10,867 |
| Gross Income Margin | 41.3% | 47.3% | 50.8% | 50.9% | 56.8% | 61.2% | 63.5% | 60.4% | 61.7% |
| SG&A Expense | 2,237 | 2,916 | 3,381 | 4,080 | 4,686 | 5,382 | 6,319 | 7,225 | 8,959 |
| EBIT (Operating Income) | 447 | 1,102 | 1,380 | 1,164 | 1,745 | 2,180 | 2,202 | 1,251 | 1,964 |
| Year-on-year | 32.8% | 146.8% | 25.2% | -15.7% | 50.0% | 24.9% | 1.0% | -43.2% | 57.0% |
| Operating Income Margin | 6.9% | 13.0% | 14.7% | 11.3% | 15.4% | 17.6% | 16.4% | 8.9% | 11.1% |
| EBITDA | 521 | 1,272 | 1,627 | 1,525 | 2,227 | 2,694 | 2,840 | 2,042 | 2,749 |
| Pretax Income | 426 | 1,010 | 1,259 | 1,179 | 1,582 | 2,144 | 2,463 | 1,396 | 2,009 |
| Consolidated Net Income | 258 | 696 | 873 | 821 | 1,069 | 1,556 | 1,744 | 945 | 1,122 |
| Minority Interest | 0 | 0 | 0 | 0 | 0 | 0 | 0 | 0 | 0 |
| Net Income ATOP | 258 | 696 | 873 | 821 | 1,069 | 1,556 | 1,744 | 945 | 1,122 |
| Year-on-year | 33.8% | 169.7% | 25.4% | -5.9% | 30.2% | 45.5% | 12.0% | -45.8% | 18.6% |
| Net Income Margin | 4.0% | 8.2% | 9.3% | 8.0% | 9.4% | 12.6% | 13.0% | 6.7% | 6.4% |
| (Balance Sheet) | |||||||||
| Cash & Short-Term Investments | 1,103 | 1,324 | 1,695 | 1,660 | 3,453 | 3,355 | 4,026 | 3,536 | 4,022 |
| Total assets | 3,016 | 4,240 | 5,042 | 5,761 | 8,097 | 8,342 | 10,524 | 12,392 | 14,885 |
| Total Debt | 383 | 468 | 298 | 500 | 1,740 | 104 | 544 | 1,300 | 2,327 |
| Net Debt | -720 | -856 | -1,397 | -1,160 | -1,713 | -3,251 | -3,482 | -2,236 | -1,694 |
| Total liabilities | 1,022 | 1,484 | 1,445 | 1,572 | 3,272 | 1,814 | 2,271 | 3,431 | 4,728 |
| Total Shareholders’ Equity | 1,994 | 2,756 | 3,597 | 4,189 | 4,824 | 6,528 | 8,253 | 8,961 | 10,157 |
| (Cash Flow) | |||||||||
| Net Operating Cash Flow | 71 | 576 | 1,246 | 651 | 1,934 | 1,941 | 1,186 | 695 | 886 |
| Capital Expenditure | 189 | 228 | 437 | 291 | 649 | 351 | 1,018 | 487 | 477 |
| Net Investing Cash Flow | -263 | -433 | -674 | -671 | -1,020 | -412 | -886 | -1,507 | -877 |
| Net Financing Cash Flow | -139 | 69 | -230 | -7 | 933 | -1,736 | 298 | 263 | 380 |
| Free Cash Flow | 52 | 464 | 960 | 526 | 1,440 | 1,760 | 362 | 405 | 577 |
| (Profitability %) | |||||||||
| ROA | 8.71 | 19.18 | 18.81 | 15.21 | 15.43 | 18.94 | 18.49 | 8.25 | 8.22 |
| ROE | 13.83 | 29.30 | 27.48 | 21.10 | 23.73 | 27.42 | 23.60 | 10.98 | 11.73 |
| Net Profit Margin | 3.97 | 8.18 | 9.31 | 7.97 | 9.44 | 12.59 | 13.00 | 6.73 | 6.37 |
| Asset Turnover | 2.19 | 2.34 | 2.02 | 1.91 | 1.63 | 1.50 | 1.42 | 1.23 | 1.29 |
| Financial Leverage | 1.59 | 1.53 | 1.46 | 1.39 | 1.54 | 1.45 | 1.28 | 1.33 | 1.43 |
| (Per-share) Unit: JPY | |||||||||
| EPS | 16.6 | 44.2 | 54.7 | 51.2 | 67.4 | 98.4 | 109.7 | 59.4 | 70.4 |
| BPS | 127.2 | 174.0 | 224.1 | 263.0 | 305.5 | 411.1 | 519.1 | 563.0 | 637.6 |
| Dividend per Share | 1.50 | 4.50 | 5.50 | 6.50 | 7.00 | 10.00 | 22.50 | 22.50 | 22.50 |
| Shares Outstanding (Million Shares) |
15.55 | 15.74 | 15.94 | 16.08 | 16.10 | 16.21 | 16.27 | 16.27 | 16.28 |
Source: Omega Investment from company materials