2026-03-12
Home
Japanese

Omega Investment Co., Ltd.
Itoki (Company note – 1Q update)

| Share price (5/26) | ¥1,956 | Dividend Yield (25/12 CE) | 3.32 % |
| 52weeks high/low | ¥1,062/1,980 | ROE(24/12 act) | 13.79 % |
| Avg Vol (3 month) | 214 thou shrs | Operating margin (24/12 act) | 7.3 % |
| Market Cap | ¥104.4 bn | Beta (5Y Monthly) | 0.35 |
| Enterprise Value | ¥114.6 bn | Shares Outstanding | 53.38 mn shrs |
| PER (25/12 CE) | 12.03 X | Listed market | TSE Prime |
| PBR (24/12 act) | 1.87 X |
| Click here for the PDF version of this page |
| PDF Version |
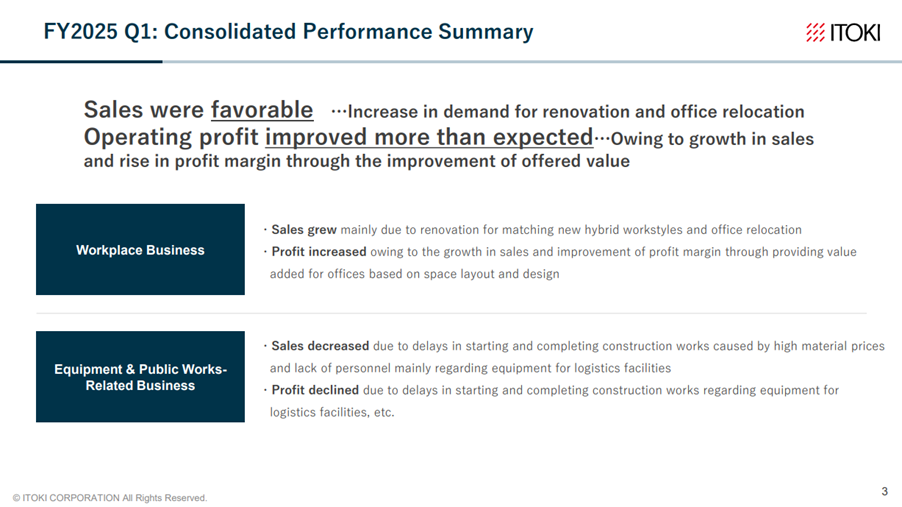
1Q results were favorable. Business strategy was successful in the Workplace Business.
◇ FY12/2025 1Q Results highlights: Workplace Business as the growth driver
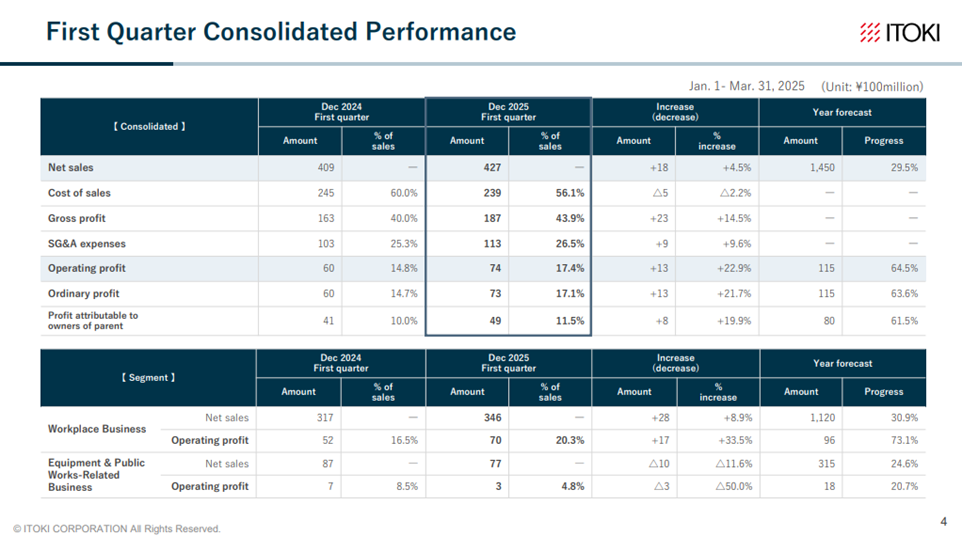
On May 2, 2025, Itoki announced its 1Q results for FY12/2025. The Workplace Business served as the key driver, leading to both revenue and profit growth. Net sales was 42.74 billion yen (+4% YoY), operating profit was 7.42 billion yen (+22% YoY), ordinary profit was 7.31 billion yen (+21% YoY), and net profit attributable to owner of parent was 4.91 billion yen (+19% YoY).
Before delving into the performance analysis, it is worth noting that, following an administrative warning from the Japan Fair Trade Commission (JFTC) in November 2024, Itoki initiated measures to improve its transaction practices with logistics subcontractors and submitted a report to the JFTC by March 17, 2025.
While these organizational improvements were being implemented, performance remained solid. The Workplace Business continued to lead the way, showing that the company’s business strategy is aligned with market trends. Sales in the segment was 34.6 billion yen (+2.8 billion yen YoY), operating profit was 7.0 billion yen (+1.7 billion yen YoY), and the operating profit margin reached 20.3% (+3.8pt YoY). With the rising demand for office space renewal as a pillar of customers’ investment in human capital (i.e., recruitment, retention, and productivity enhancement), the company is expanding its fully integrated sales approach, including design, specification, and construction, to beyond the Tokyo metropolitan area. As a result, in addition to price revisions, profitability has improved through a range of multifaceted initiatives.
Meanwhile, the Equipment & Public Works-Related Business posted lower revenue and operating profit. Sales was 7.7 billion yen (-1.0 billion yen YoY), operating profit was 0.3 billion yen (-0.3 billion yen YoY), and the segment margin was 4.8% (-3.7pt YoY). The decline was primarily due to delays in the construction start and completion of logistics facilities by customers, caused by rising material costs. However, profitability was maintained, and the segment’s overall contribution remains small. Overall, Q1 performance appears to have exceeded expectations.
On the balance sheet, short-term borrowings increased to cover working capital. However, there are currently no significant concerns.
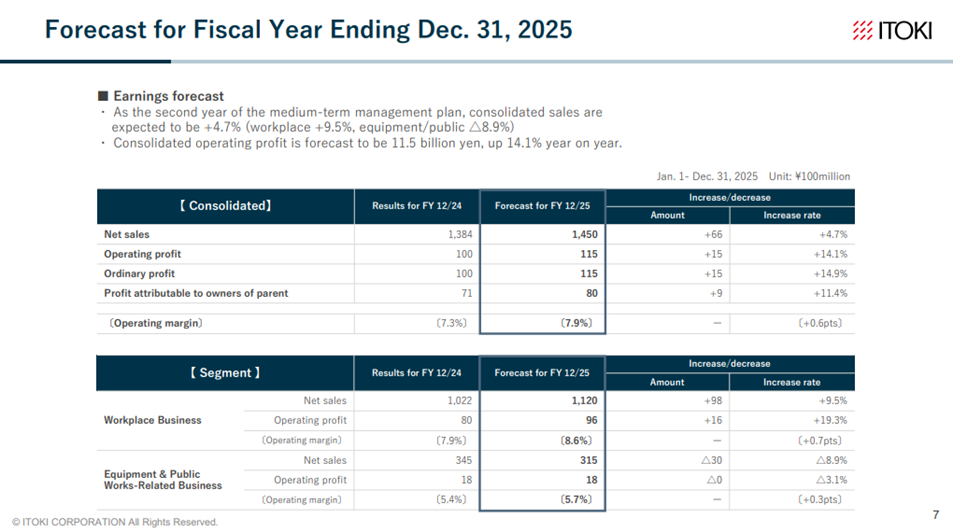
◇ FY12/2025 Full-year earnings forecast: No change to the revenue and profit growth forecast; progress is steady
The company maintained its guidance for FY12/2025: Net sales of 145.0 billion yen (+4% YoY), operating profit of 11.5 billion yen (+14% YoY), ordinary profit of 11.5 billion yen (+14% YoY), and net profit attributable to owner of parent of 8.0 billion yen (+11% YoY), aiming to achieve record earnings again. The dividend per share remains unchanged at 65 yen (+10 yen YoY), with a projected payout ratio of 40%.
The outlook for achieving these targets remains solid.
First, 1Q progress rates were 29.5% for net sales and 64.5% for operating profit. Within this, the Workplace Business showed 30.9% progress on sales and 73.1% on operating profit, indicating that revenue is on track and profits are ahead of schedule.
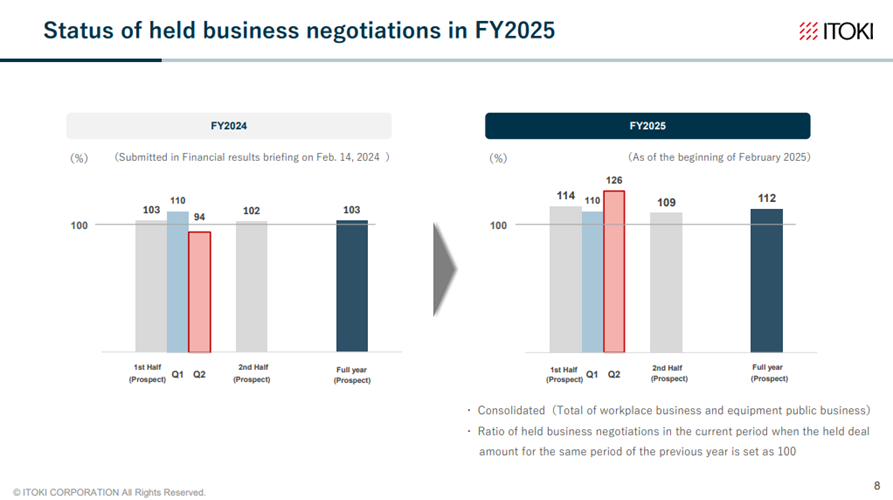
Although profit growth stalled in 2Q of the previous fiscal year, which negatively impacted the stock market, similar concerns are limited this fiscal year. According to company interviews, demand for office renewals remains strong nationwide, supported by the human capital investment theme, and the deal pipeline is robust. Given the company’s value-added proposals and prior price revisions, stable earnings growth is expected.
Second, although the Equipment & Public Works-Related Business is currently sluggish, 1Q results were better than expected, and its contribution to overall profit is limited.
◇ Share price trends and future points of interest
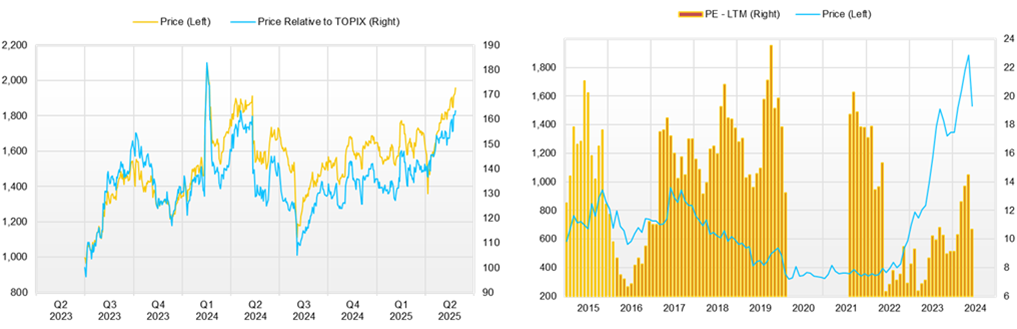
The company’s stock has been trading between 1,500 and 1,800 yen since the beginning of the year. While it briefly fell below 1,400 yen in early April due to a market-wide downturn triggered by U.S. tariff hikes, it quickly rebounded and continued to rise steadily after the announcement of 1Q results. Currently, it has exceeded 1,800 yen, approaching the previous high of 2,200 yen, which was recorded in February 2024.
This performance likely reflects market appreciation for the company’s effective strategy and revenue growth in the Workplace Business, along with significant improvements in profitability.
However, valuation metrics such as PER and PBR do not suggest overheating. If the following factors become more evident, the stock may exceed the 2,200 yen level, driven by increased growth expectations and a reduced risk of future performance volatility:
– Continued earnings expansion beyond 2Q, further raising confidence in the FY12/2025 forecast.
– Contribution to FY12/2026 (final year of the medium-term plan) earnings growth from both core businesses.
– Emergence of new growth drivers beyond the current plan: Office 3.0, specialized facilities, and overseas expansion.
– Enhanced earnings stability through recurring revenue and diversified income sources.
– Clarification of long-term financial targets and the company’s stance on M&A.
If updates are provided during the upcoming IR Day or 2Q results announcement, the stock may gain further upward momentum. Investors should closely monitor both earnings progress and management’s responses.
Company profile
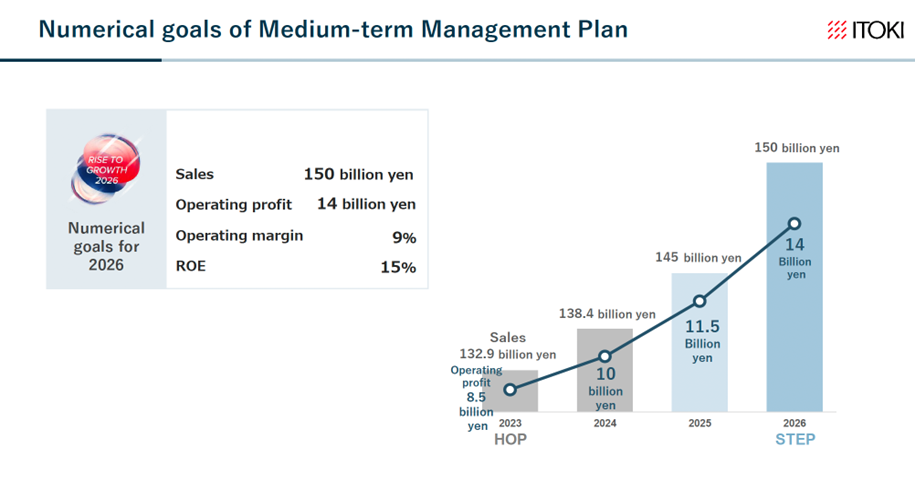
Itoki Corporation (Itoki) is an office furniture manufacturer that designs tomorrow’s “workstyles”. It was founded in 1890. In addition to office furniture manufacturing, the company is also involved in construction and interior decoration. In 2022, Koji Minato was appointed president, and the company’s corporate structure has been transformed under his leadership. The company has advocated Office DX and Office 3.0 and is working to add high value. Under its three-year medium-term management plan, RISE TO GROWTH 2026, which ends in FY2026, the company is promoting the priority strategy ‘7 Flags’ and ESG strategies under the theme of ‘enhancing sustainable growth’. The plan aims to achieve sales of 150 billion yen, operating profit of 14 billion yen and ROE of 15% in FY2026.
Key financial data
| Unit: million yen | 2020/12 | 2021/12 | 2022/12 | 2023/12 | 2024/12 | 2025/12 CE |
| Sales | 116,210 | 115,905 | 123,324 | 132,985 | 138,460 | 145,000 |
| EBIT (Operating Income) | 1,585 | 2,561 | 4,582 | 8,524 | 10,078 | 11,500 |
| Pretax Income | 1,277 | 1,523 | 8,372 | 8,378 | 10,071 | |
| Net Profit Attributable to Owner of Parent | -235 | 1,166 | 5,294 | 5,905 | 7,183 | 8,000 |
| Cash & Short-Term Investments | 18,246 | 17,451 | 26,976 | 24,795 | 22,482 | |
| Total assets | 105,096 | 103,898 | 115,288 | 117,437 | 120,521 | |
| Total Debt | 17,308 | 17,308 | 17,308 | 17,308 | 37,533 | |
| Net Debt | -7,487 | -7,487 | -7,487 | -7,487 | 15,051 | |
| Total liabilities | 60,901 | 58,818 | 65,374 | 62,434 | 71,174 | |
| Total Shareholders’ Equity | 54,960 | 54,960 | 54,960 | 54,960 | 49,260 | |
| Net Operating Cash Flow | 4,561 | 2,774 | 5,804 | 6,321 | -1,000 | |
| Capital Expenditure | 3,316 | 3,316 | 3,316 | 3,316 | 6,036 | |
| Net Investing Cash Flow | -1,152 | -1,170 | 4,923 | -4,012 | -7,107 | |
| Net Financing Cash Flow | -2,267 | -2,658 | -1,426 | -4,148 | 5,905 | |
| Free Cash Flow | 3,005 | 3,005 | 3,005 | 3,005 | -4,146 | |
| ROA (%) | -0.22 | 1.12 | 4.83 | 5.08 | 6.04 | |
| ROE (%) | -0.53 | 2.63 | 11.17 | 11.27 | 13.79 | |
| EPS (Yen) | -5.2 | 25.8 | 117.0 | 130.3 | 147.0 | 162.6 |
| BPS (Yen) | 970.4 | 993.9 | 1,101.3 | 1,212.0 | 1,001.1 | |
| Dividend per Share (Yen) | 13.00 | 15.00 | 37.00 | 42.00 | 55.00 | 65.00 |
| Shares Outstanding (Million shares) | 45.66 | 45.66 | 45.66 | 45.66 | 53.38 |
Source: Omega Investment from company data, rounded to the nearest whole number.
Share price
Quarterly topics
【Financial highlights】
Source: Company materials
【Analysis of changes in operating profits】
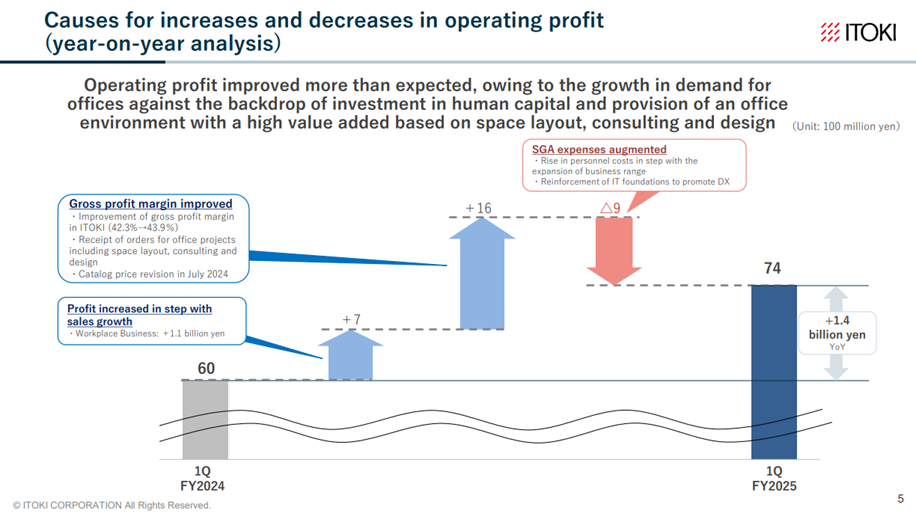
Source: Company materials
【Performance in each segment】
Source: Company materials
【Earnings forecast for FY ending December 2025】
Source: Company materials
【Earnings forecast for FY2025 in the Medium-term Management Plan 】
Source: Company material
【Status of held business negotiations in FY2025】
Source: Company material
Financial data (quarterly basis)
| Unit: million yen | 2023/12 | 2024/12 | 2025/12 | ||||||
| 1Q | 2Q | 3Q | 4Q | 1Q | 2Q | 3Q | 4Q | 1Q | |
| (Income Statement) | |||||||||
| Sales | 36,965 | 31,225 | 28,667 | 36,128 | 40,918 | 31,592 | 29,613 | 36,337 | 42,744 |
| Year-on-year | 4.6% | 9.9% | 9.4% | 8.3% | 10.7% | 1.2% | 3.3% | 0.6% | 4.5% |
| Cost of Goods Sold (COGS) | 22,216 | 18,955 | 17,483 | 22,090 | 24,545 | 19,888 | 17,644 | 21,182 | 23,993 |
| Gross Income | 14,749 | 12,270 | 11,184 | 14,038 | 16,373 | 11,704 | 11,969 | 15,155 | 18,751 |
| Gross Income Margin | 39.9% | 39.3% | 39.0% | 38.9% | 40.0% | 37.0% | 40.4% | 41.7% | 43.9% |
| SG&A Expense | 9,970 | 10,047 | 11,006 | 12,694 | 10,333 | 10,878 | 11,029 | 12,883 | 11,328 |
| EBIT (Operating Income) | 4,779 | 2,223 | 178 | 1,344 | 6,040 | 826 | 940 | 2,272 | 7,423 |
| Year-on-year | 20.5% | 444.9% | -162.2% | 171.5% | 26.4% | -62.8% | 428.1% | 69.0% | 22.9% |
| Operating Income Margin | 12.9% | 7.1% | 0.6% | 3.7% | 14.8% | 2.6% | 3.2% | 6.3% | 17.4% |
| EBITDA | 5,522 | 2,906 | 910 | 2,079 | 6,753 | 1,582 | 1,684 | 3,166 | 8,189 |
| Pretax Income | 4,804 | 2,275 | 363 | 936 | 6,006 | 1,328 | 1,035 | 1,702 | 7,257 |
| Consolidated Net Income | 3,297 | 1,411 | 202 | 997 | 4,104 | 985 | 725 | 1,409 | 4,910 |
| Minority Interest | 1 | 0 | 0 | 0 | 2 | 1 | 11 | 25 | -6 |
| Net Income ATOP | 3,296 | 1,411 | 202 | 996 | 4,101 | 985 | 714 | 1,383 | 4,916 |
| Year-on-year | -2.7% | 389.9% | -227.0% | -44.0% | 24.4% | -30.2% | 253.5% | 38.9% | 19.9% |
| Net Income Margin | 8.9% | 4.5% | 0.7% | 2.8% | 10.0% | 3.1% | 2.4% | 3.8% | 11.5% |
| (Balance Sheet) | |||||||||
| Cash & Short-Term Investments | 20,908 | 24,788 | 23,292 | 24,795 | 24,751 | 28,513 | 30,536 | 22,482 | 24,296 |
| Total assets | 115,841 | 111,693 | 111,573 | 117,437 | 127,459 | 120,701 | 120,935 | 120,521 | 132,329 |
| Total Debt | 18,387 | 17,361 | 17,342 | 17,308 | 38,662 | 41,566 | 42,881 | 37,924 | 44,114 |
| Net Debt | -2,521 | -7,427 | -5,950 | -7,487 | 13,911 | 13,053 | 12,345 | 15,442 | 19,818 |
| Total liabilities | 64,090 | 58,270 | 57,730 | 62,434 | 81,595 | 73,584 | 73,305 | 71,174 | 80,689 |
| Total Shareholders’ Equity | 51,709 | 53,379 | 53,800 | 54,960 | 45,818 | 47,068 | 47,571 | 49,260 | 51,562 |
| (Profitability %) | |||||||||
| ROA | 4.49 | 5.67 | 6.09 | 5.08 | 5.52 | 5.41 | 5.85 | 6.04 | 6.16 |
| ROE | 10.45 | 12.45 | 13.12 | 11.27 | 13.76 | 12.51 | 13.41 | 13.79 | 16.43 |
| (Per-share) Unit: JPY | |||||||||
| EPS | 72.8 | 31.1 | 4.5 | 22.0 | 85.7 | 20.0 | 14.5 | 28.1 | 99.9 |
| BPS | 1,141.9 | 1,177.1 | 1,186.4 | 1,212.0 | 933.1 | 956.6 | 966.8 | 1,001.1 | 1,047.9 |
| Dividend per Share | 0.00 | 0.00 | 0.00 | 42.00 | 0.00 | 0.00 | 0.00 | 55.00 | 0.00 |
| Shares Outstanding(million shares) | 45.66 | 45.66 | 45.66 | 45.66 | 53.38 | 53.38 | 53.38 | 53.38 | 53.38 |
Source: Omega Investment from company materials
Financial data (full-year basis)
| Unit: million yen | 2014/12 | 2015/12 | 2016/12 | 2017/12 | 2018/12 | 2019/12 | 2020/12 | 2021/12 | 2022/12 | 2023/12 | 2024/12 |
| (Income Statement) | |||||||||||
| Sales | 102,993 | 106,516 | 101,684 | 108,684 | 118,700 | 122,174 | 116,210 | 115,905 | 123,324 | 132,985 | 138,460 |
| Year-on-year | -0.5% | 3.4% | -4.5% | 6.9% | 9.2% | 2.9% | -4.9% | -0.3% | 6.4% | 7.8% | 4.1% |
| Cost of Goods Sold | 66,858 | 68,424 | 65,071 | 70,012 | 77,479 | 80,712 | 74,536 | 74,186 | 77,575 | 80,744 | 83,259 |
| Gross Income | 36,135 | 38,092 | 36,613 | 38,672 | 41,221 | 41,462 | 41,674 | 41,719 | 45,749 | 52,241 | 55,201 |
| Gross Income Margin | 35.1% | 35.8% | 36.0% | 35.6% | 34.7% | 33.9% | 35.9% | 36.0% | 37.1% | 39.3% | 39.9% |
| SG&A Expense | 33,711 | 33,949 | 33,862 | 35,761 | 39,336 | 40,776 | 40,089 | 39,158 | 41,167 | 43,717 | 45,123 |
| EBIT (Operating Income) | 2,424 | 4,143 | 2,751 | 2,911 | 1,885 | 686 | 1,585 | 2,561 | 4,582 | 8,524 | 10,078 |
| Year-on-year | -40.5% | 70.9% | -33.6% | 5.8% | -35.2% | -63.6% | 131.0% | 61.6% | 78.9% | 86.0% | 18.2% |
| Operating Income Margin | 2.4% | 3.9% | 2.7% | 2.7% | 1.6% | 0.6% | 1.4% | 2.2% | 3.7% | 6.4% | 7.3% |
| EBITDA | 5,055 | 6,551 | 5,316 | 5,551 | 4,615 | 4,436 | 5,603 | 6,148 | 7,821 | 11,417 | 13,185 |
| Pretax Income | 3,171 | 4,246 | 2,918 | 3,401 | 3,083 | 938 | 1,277 | 1,523 | 8,372 | 8,378 | 10,071 |
| Consolidated Net Income | 2,355 | 4,631 | 1,850 | 2,442 | 1,744 | -579 | -355 | 933 | 5,181 | 5,907 | 7,223 |
| Minority Interest | 195 | 101 | -56 | 40 | 19 | -28 | -119 | -233 | -113 | 1 | 39 |
| Net Income ATOP | 2,160 | 4,530 | 1,907 | 2,402 | 1,725 | -550 | -235 | 1,166 | 5,294 | 5,905 | 7,183 |
| Year-on-year | -44.8% | 109.7% | -57.9% | 26.0% | -28.2% | -131.9% | -57.3% | -596.2% | 354.0% | 11.5% | 21.6% |
| Net Income Margin | 2.1% | 4.3% | 1.9% | 2.2% | 1.5% | -0.5% | -0.2% | 1.0% | 4.3% | 4.4% | 5.2% |
| (Balance Sheet) | |||||||||||
| Cash & Short-Term Investments | 22,132 | 21,533 | 19,839 | 19,977 | 16,529 | 17,030 | 18,246 | 17,451 | 26,976 | 24,795 | 22,482 |
| Total assets | 96,721 | 98,175 | 95,681 | 102,451 | 108,710 | 108,778 | 105,096 | 103,898 | 115,288 | 117,437 | 120,521 |
| Total Debt | 18,916 | 18,927 | 19,931 | 17,892 | 16,834 | 22,166 | 21,742 | 20,091 | 19,487 | 17,308 | 37,533 |
| Net Debt | -3,216 | -2,606 | 92 | -2,085 | 305 | 5,136 | 3,496 | 2,640 | -7,489 | -7,487 | 15,051 |
| Total liabilities | 53,532 | 50,864 | 50,275 | 54,997 | 61,200 | 62,940 | 60,901 | 58,818 | 65,374 | 62,434 | 71,174 |
| Total Shareholders’ Equity | 41,632 | 45,677 | 44,949 | 46,863 | 46,857 | 45,370 | 43,812 | 44,931 | 49,871 | 54,960 | 49,260 |
| (Cash Flow) | |||||||||||
| Net Operating Cash Flow | 5,715 | 4,522 | 5,073 | 3,565 | 1,384 | 3,586 | 4,561 | 2,774 | 5,804 | 6,321 | -1,000 |
| Capital Expenditure | 1,400 | 1,114 | 1,641 | 1,333 | 3,477 | 3,226 | 1,729 | 2,110 | 4,145 | 3,316 | 6,036 |
| Net Investing Cash Flow | -1,742 | -803 | -4,044 | -2,971 | -3,094 | -3,221 | -1,152 | -1,170 | 4,923 | -4,012 | -7,107 |
| Net Financing Cash Flow | -2,179 | -3,807 | -2,571 | -706 | -2,463 | 0 | -2,267 | -2,658 | -1,426 | -4,148 | 5,905 |
| Free Cash Flow | 4,315 | 3,408 | 3,664 | 2,342 | -1,924 | 635 | 2,832 | 664 | 1,659 | 3,005 | -4,146 |
| (Profitability %) | |||||||||||
| ROA | 2.25 | 4.65 | 1.97 | 2.42 | 1.63 | -0.51 | -0.22 | 1.12 | 4.83 | 5.08 | 6.04 |
| ROE | 5.22 | 10.38 | 4.21 | 5.23 | 3.68 | -1.19 | -0.53 | 2.63 | 11.17 | 11.27 | 13.79 |
| (Per-share) Unit: JPY | |||||||||||
| EPS | 42.8 | 91.6 | 40.1 | 52.7 | 37.8 | -12.1 | -5.2 | 25.8 | 117.0 | 130.3 | 147.0 |
| BPS | 825.8 | 953.5 | 986.8 | 1,028.9 | 1,027.4 | 995.8 | 970.4 | 993.9 | 1,101.3 | 1,212.0 | 1,001.1 |
| Dividend per Share | 13.00 | 13.00 | 13.00 | 13.00 | 13.00 | 13.00 | 13.00 | 15.00 | 37.00 | 42.00 | 55.00 |
| Shares Outstanding (million shares) | 52.14 | 52.14 | 52.14 | 52.14 | 45.61 | 45.66 | 45.66 | 45.66 | 45.66 | 45.66 | 53.38 |
Source: Omega Investment from company materials