2026-03-12
Home
Japanese

Omega Investment Co., Ltd.
Chiome Bioscience (Company note – 1Q update)

| Share price (6/10) | ¥154 | Dividend Yield (25/12 CE) | – % |
| 52weeks high/low | ¥145/155 | ROE(24/12 act) | -66.8 % |
| Avg Vol (3 month) | 1,404.2 thou shrs | Operating margin (TTM) | -132.0 % |
| Market Cap | ¥10.4 bn | Beta (5Y Monthly) | 0.2 |
| Enterprise Value | ¥8.0 bn | Shares Outstanding | 68.053 mn shrs |
| PER (25/12 CE) | – X | Listed market | TSE Growth |
| PBR (24/12 act) | 5.96 X |
| Click here for the PDF version of this page |
| PDF version |
Increase in revenue, deficit reduction. Steady progress in both Drug Discovery and Development and Drug Discovery Support.
◇ FY12/2025 1Q Financial results highlights: Increase in revenue, reduction in deficit
Chiome Bioscience Inc. (hereinafter referred to as “the Company”) announced its financial results for the first quarter of FY12/2025 on May 12, 2025, reporting a revenue increase and a deficit reduction. Net sales were 130 million yen (up 7% YoY), operating loss was 260 million yen (vs. a loss of 320 million yen in the same period of the previous year), ordinary loss was 260 million yen (vs. a loss of 300 million yen), and net loss for the quarter was 260 million yen (vs. a loss of 300 million yen).
In the Drug Discovery Support Business, which serves as the revenue base, orders from existing customers have been progressing steadily, and profit and loss have improved due to reduced R&D expenses resulting from a decline in large equipment costs. By segment, the Drug Discovery and Development Business recorded a reduced deficit, and the Drug Discovery Support Business recorded increased revenue and profit. Overall, the results appear to be generally in line with expectations.
There were no significant changes to the balance sheet.
◇ Business progress: Steady progress in both businesses
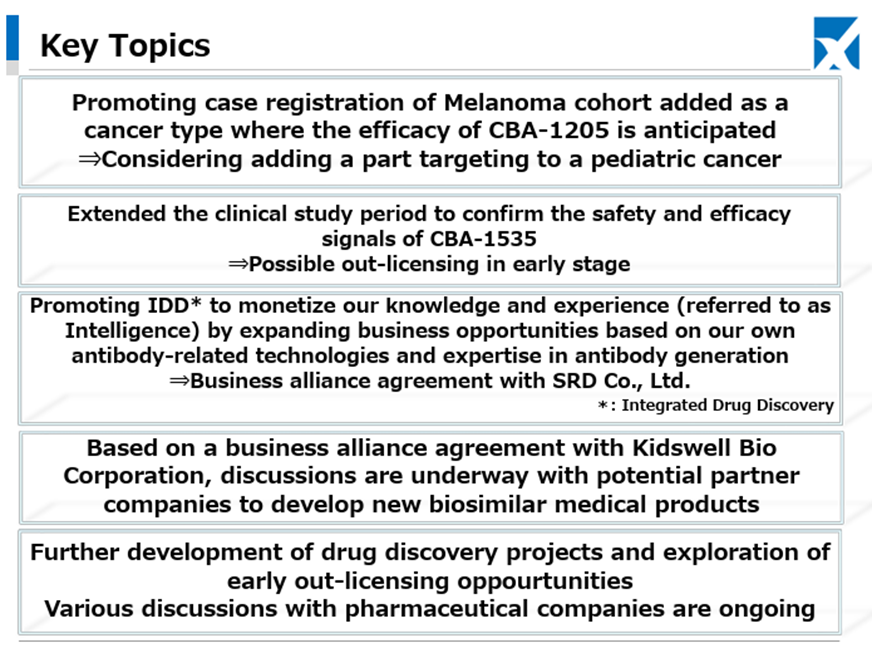
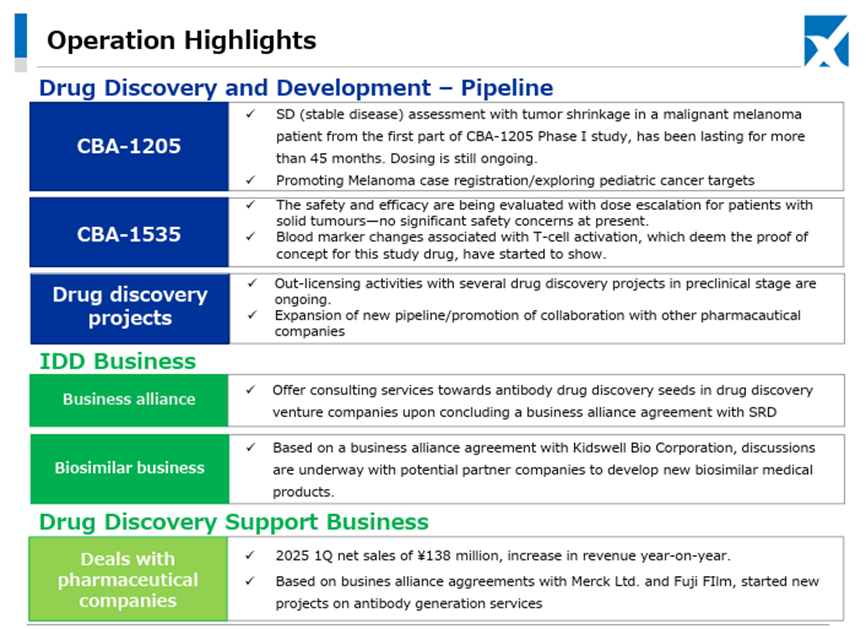
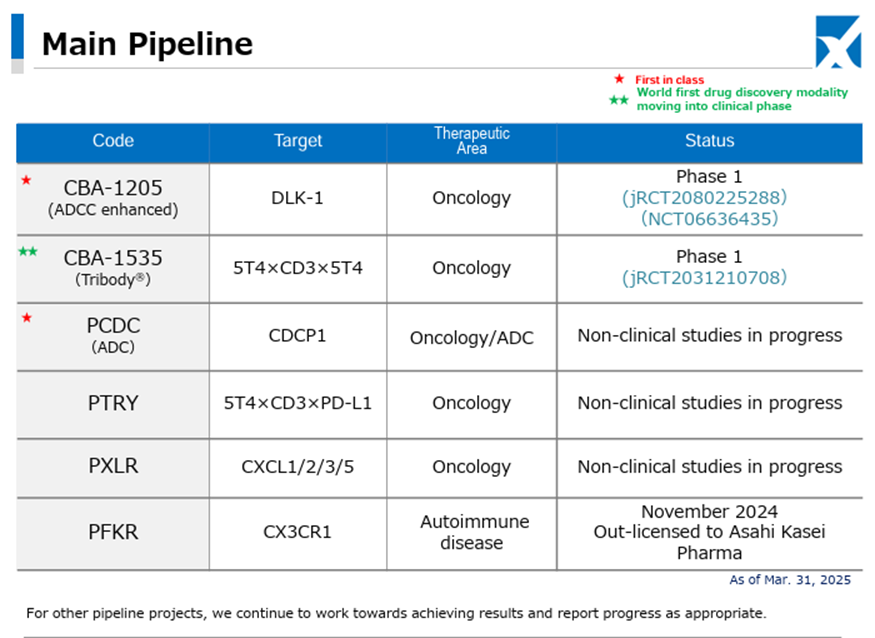
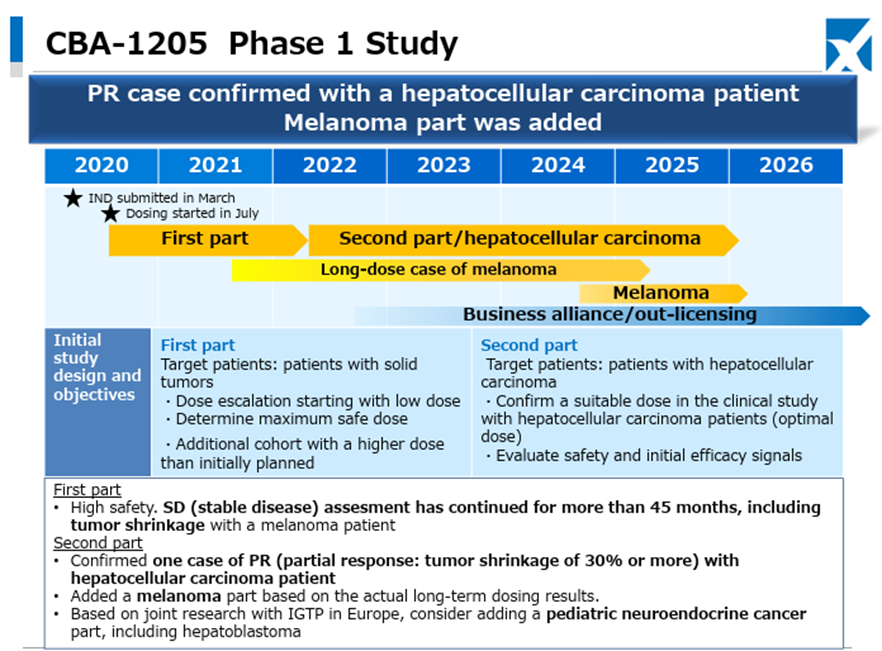
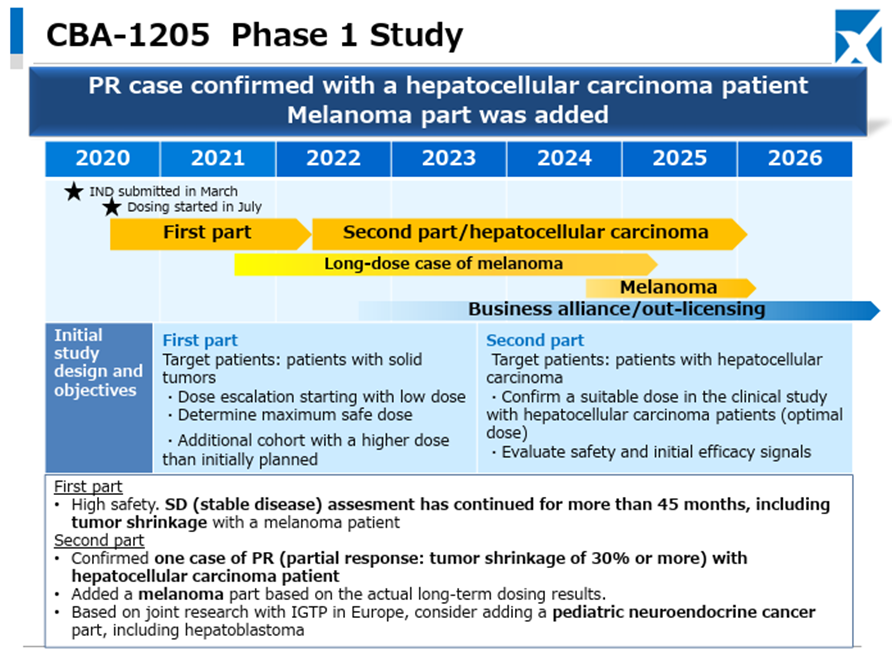
In the Drug Discovery and Development Business, Phase I clinical trials of the Company’s pipeline products CBA-1205 and CBA-1535 are proceeding smoothly.
Regarding CBA-1205, in one melanoma patient administered in the first half of the study, the administration period has exceeded 45 months, and stable disease accompanied by tumor shrinkage continues. In the ongoing second half part, one case of partial response has been confirmed in a hepatocellular carcinoma patient, administration to melanoma patients is also progressing, and clinical trials for pediatric neuroendocrine carcinoma, including hepatoblastoma, are being considered for addition.
Regarding CBA-1535, the first half part is ongoing. There are no safety-related data suggesting development concerns, and as previously, responses are observed in parameters indicating T-cell activation, which is the concept of this antibody. The Company continues to consider the possibility of out-licensing based on the trial data from the first half part.
In the Drug Discovery Support Business, as previously mentioned, business with existing customers is proceeding steadily. In addition, new contract projects for antibody production have also been initiated based on contracts with Merck and FUJIFILM Wako Pure Chemical, with whom the Company entered into partnerships in the second half of last year.
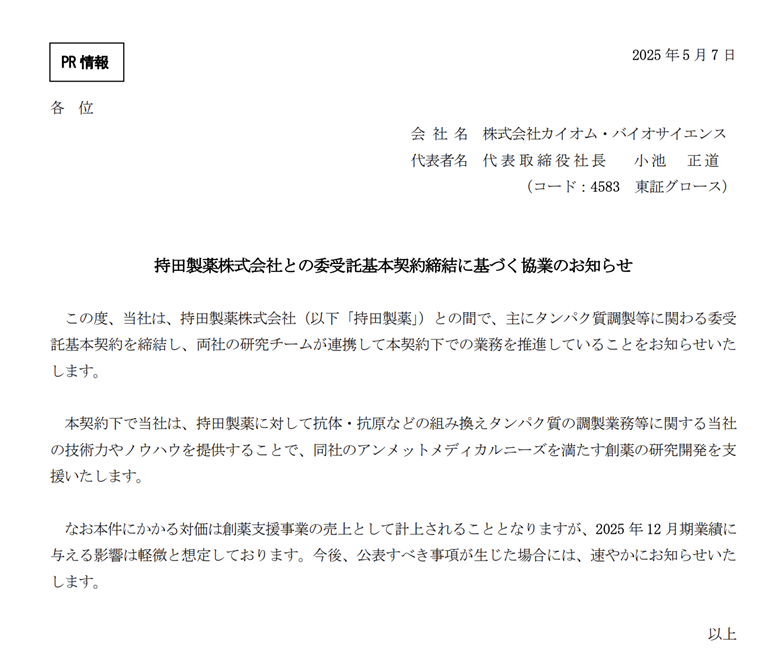
Furthermore, in May 2025, the Company concluded a master agreement with Mochida Pharmaceutical Co., Ltd, primarily related to protein preparation and other services.
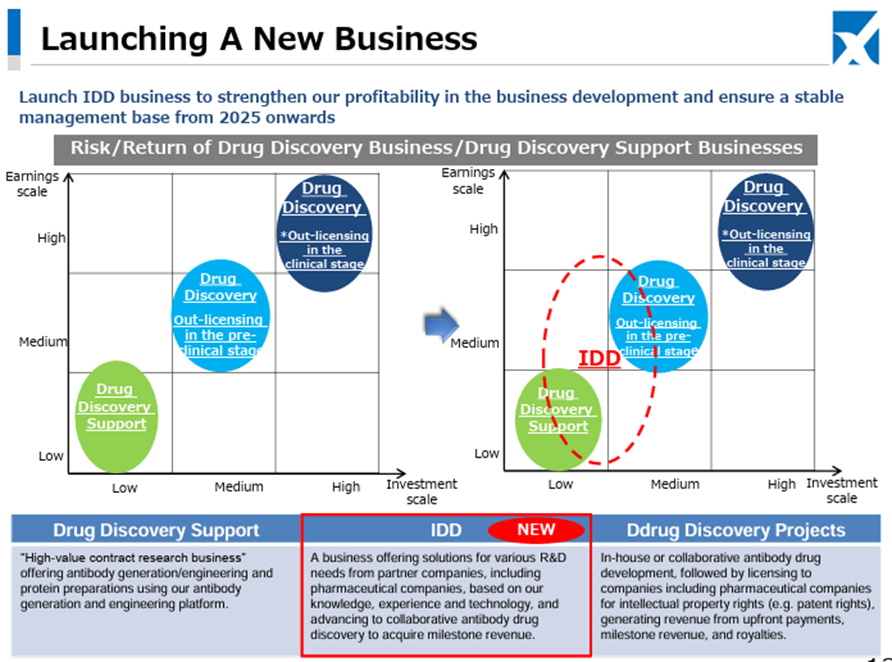
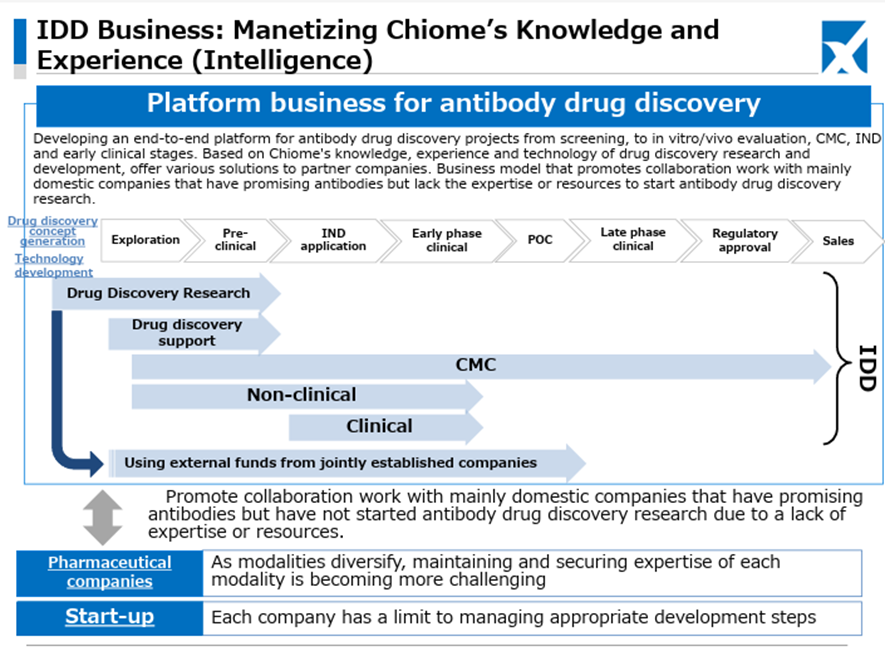
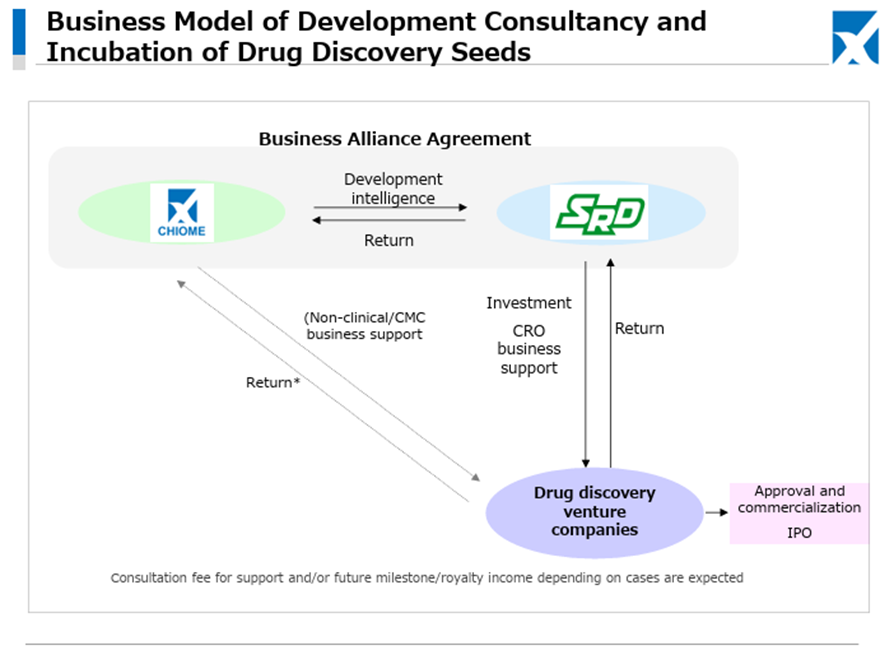
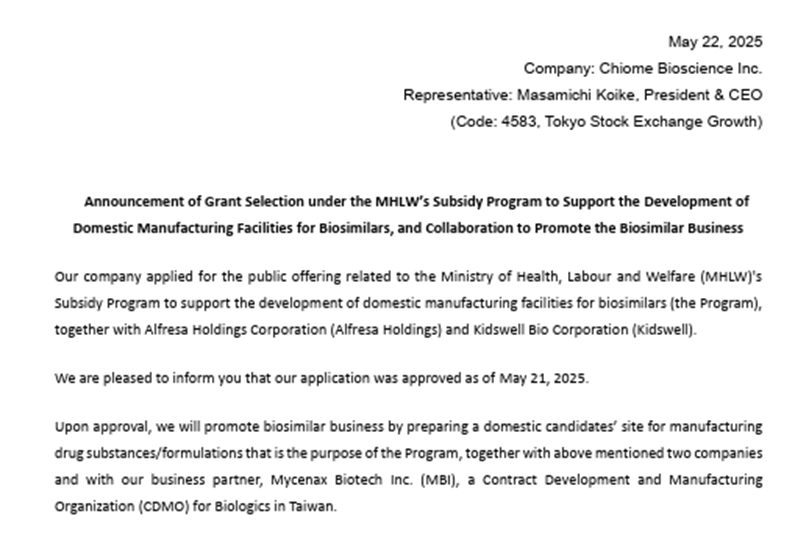
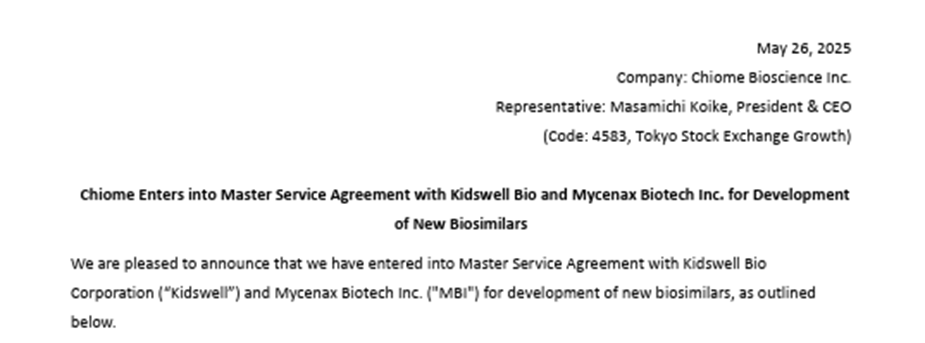
As for the newly launched IDD (Integrated Drug Discovery) Business, in addition to the business alliance with Kidswell Bio Corporation in June 2024 and the partnership with SRD Co., Ltd. in March 2025, in May 2025, the Company jointly applied with Alfresa Holdings Corporation and Kidswell Bio Corporation for a Ministry of Health, Labour and Welfare grant program (“Facility Maintenance Subsidy for Medical Institutions, Support Project for Domestic Production Facilities of Biosimilars”) and was selected as of May 21, 2025. Furthermore, the Company plans to develop manufacturing facilities for biosimilar active pharmaceutical ingredients and formulations at a domestic candidate site in collaboration with a total of four companies, including Mycenax Biotech Inc., a Taiwanese biopharmaceutical contract development and manufacturing organization, and manufacture biosimilars and other products at the said facility. Relatedly, the Company disclosed on May 26, 2025, that it concluded a Master Service Agreement concerning developing new biosimilars with Kidswell Bio Corporation and Mycenax Biotech Inc. This is expected to contribute to the foundation of the domestic biosimilar business.
◇ FY12/2025 Full-year earnings forecast: Drug Discovery Support Business sales forecast of 500 million yen maintained
The Company has only disclosed the full-year sales forecast for the Drug Discovery Support Business. It maintains the forecast for the new fiscal year at 500 million yen (a decrease of 80 million yen YoY). There is no change to this amount at this time.
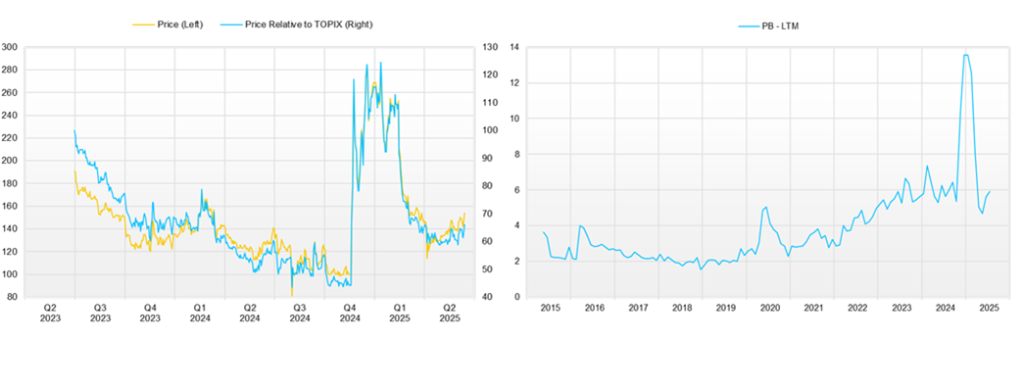
◇ Share price trend and key points going forward
After the announcement of the PFKR licensing agreement, the Company’s share price rose to over 300 yen, but following the announcement of the FY12/2024 financial results (February 13, 2025), the goal of achieving single-year profitability in FY12/2025 was revised, and the share price has been trending weakly. As a result, the price continued to soften until early April. Still, since then it has been steadily firming and gradually rising, remaining stable in the 140–150 yen range even after the 1Q financial results were announced.
This recent share price movement suggests that the market has begun to evaluate positively the Company’s flexible and appropriate progress in clinical trial planning aimed at maximizing the out-licensing value of the drug discovery pipeline, the stability of the Drug Discovery Support Business, and the rapid formation of revenue diversification and stabilization through the launch of the IDD business and successive contract signings.
As before, the key points to watch in the near term are: (1) whether the Company will succeed in out-licensing its in-house developed products such as CBA-1205 and CBA-1535 following the PFKR licensing agreement, and whether the economic terms of those agreements are sufficient; (2) whether the Company can achieve single-year profitability at an early stage; and (3) the upside potential of the IDD business, including biosimilars. As the development of the drug discovery pipeline approaches maturity and the business development becomes more multifaceted, the importance of upcoming news is expected to increase.
Company profile
Chiome Bioscience Inc. is a bio venture company that challenges unmet needs through antibody drug discovery and development based on its proprietary ADLib/Tribody technology. The Company has positioned its Drug Discovery and Development Business as a pillar of growth. (This business involves the in-house or joint development of antibody drugs for diseases with high unmet medical needs and the licensing of intellectual property rights such as patents for the resulting antibodies to pharmaceutical companies, etc., to generate income from one-time contract fees, milestone payments, and royalties, etc.) The Company has a pipeline of around 10 products, three of which are in clinical trials, and in November 2024, it licensed out one preclinical program. In addition, the Company has built up a track record in its Drug Discovery Support Business (a high-value-added contract research business that provides antibody generation, antibody engineering, and protein preparation services using the Company’s antibody drug discovery technology platform, mainly to major domestic pharmaceutical companies). It has also started to expand into the biosimilar business and IDD Business.
Key financial data
| Unit: million yen | 2020/12 | 2021/12 | 2022/12 | 2023/12 | 2024/12 | 2025/12CE |
| Sales | 481 | 713 | 631 | 682 | 781 | NA |
| EBIT (Operating Income) | -1,284 | -1,334 | -1,259 | -1,205 | -1,031 | NA |
| Pretax Income | -1,291 | -1,466 | -1,238 | -1,215 | -1,018 | NA |
| Net Profit Attributable to Owner of Parent | -1,294 | -1,480 | -1,243 | -1,220 | -1,021 | NA |
| Cash & Short-Term Investments | 2,686 | 1,791 | 1,727 | 1,326 | 2,063 | |
| Total assets | 3,495 | 2,339 | 2,215 | 1,751 | 2,469 | |
| Total Debt | 291 | 291 | 291 | 291 | 282 | |
| Net Debt | -1,035 | -1,035 | -1,035 | -1,035 | -1,782 | |
| Total liabilities | 385 | 446 | 425 | 594 | 549 | |
| Total Shareholders’ Equity | 1,158 | 1,158 | 1,158 | 1,158 | 1,920 | |
| Net Operating Cash Flow | -1,360 | -1,131 | -1,191 | -1,069 | -1,001 | |
| Capital Expenditure | 0 | 0 | 0 | 0 | 0 | |
| Net Investing Cash Flow | -4 | -35 | 0 | 0 | 0 | |
| Net Financing Cash Flow | 1,944 | 271 | 1,127 | 667 | 1,738 | |
| ROA (%) | -41.06 | -50.73 | -54.57 | -61.51 | -48.37 | |
| ROE (%) | -45.15 | -59.16 | -67.48 | -82.76 | -66.33 | |
| EPS (Yen) | -36.1 | -36.7 | -28.3 | -24.6 | -17.5 | |
| BPS (Yen) | 78.7 | 46.4 | 37.0 | 22.0 | 28.7 | |
| Dividend per Share (Yen) | 0.00 | 0.00 | 0.00 | 0.00 | 0.00 | |
| Shares Outstanding (Million shares) | 58.28 | 58.28 | 58.28 | 58.28 | 66.97 |
Source: Omega Investment from company data, rounded to the nearest whole number.
Share price
Quarterly topics
Source: company materials
Source: company materials
Source: company materials
Source: company materials
Source: company materials
Source: company materials
Source: company materials
Source: company materials
Source: Company material (excerpt)
Source: Company material (excerpt)
Source: Company material (excerpt)
Financial data (quarterly basis)
| Unit: million yen | 2023/12 | 2024/12 | 2025/12 | ||||||
| 1Q | 2Q | 3Q | 4Q | 1Q | 2Q | 3Q | 4Q | 1Q | |
| (Income Statement) | |||||||||
| Sales | 169 | 189 | 165 | 158 | 130 | 134 | 159 | 358 | 139 |
| Year-on-year | 31.8% | 26.6% | 6.2% | -19.6% | -23.5% | -29.2% | -3.8% | 126.1% | 7.0% |
| Cost of Goods Sold (COGS) | 73 | 77 | 67 | 67 | 73 | 56 | 74 | 145 | 58 |
| Gross Income | 96 | 113 | 98 | 92 | 57 | 78 | 85 | 213 | 81 |
| Gross Income Margin | 56.6% | 59.5% | 59.6% | 57.8% | 44.0% | 58.0% | 53.4% | 59.5% | 58.1% |
| SG&A Expense | 322 | 546 | 344 | 391 | 379 | 337 | 425 | 323 | 345 |
| EBIT (Operating Income) | -226 | -433 | -246 | -300 | -322 | -259 | -340 | -110 | -265 |
| Year-on-year | -53.5% | 48.0% | -5.4% | 36.7% | 42.6% | -40.2% | 38.1% | -63.3% | -17.9% |
| Operating Income Margin | -133.4% | -228.6% | -149.0% | -189.3% | -248.5% | -193.1% | -213.9% | -30.7% | -190.7% |
| Pretax Income | -226 | -435 | -254 | -300 | -303 | -259 | -351 | -105 | -265 |
| Consolidated Net Income | -228 | -436 | -255 | -302 | -304 | -260 | -352 | -105 | -266 |
| Minority Interest | 0 | 0 | 0 | 0 | 0 | 0 | 0 | 0 | 0 |
| Net Income ATOP | -228 | -436 | -255 | -302 | -304 | -260 | -352 | -105 | -266 |
| Year-on-year | -53.8% | 56.5% | -0.7% | 40.1% | 33.5% | -40.4% | 38.0% | -65.1% | -12.5% |
| Net Income Margin | -134.4% | -230.1% | -154.3% | -190.3% | -234.5% | -193.9% | -221.2% | -29.4% | -191.8% |
| (Balance Sheet) | |||||||||
| Cash & Short-Term Investments | 1,566 | 1,245 | 1,342 | 1,326 | 1,325 | 1,104 | 1,241 | 2,063 | 1,819 |
| Total assets | 2,086 | 1,686 | 1,753 | 1,751 | 1,754 | 1,557 | 1,694 | 2,469 | 2,205 |
| Total Debt | 301 | 298 | 316 | 291 | 314 | 292 | 303 | 282 | 282 |
| Net Debt | -1,265 | -947 | -1,026 | -1,035 | -1,012 | -812 | -938 | -1,782 | -1,537 |
| Total liabilities | 524 | 541 | 542 | 594 | 506 | 487 | 478 | 549 | 443 |
| Total Shareholders’ Equity | 1,562 | 1,145 | 1,211 | 1,158 | 1,248 | 1,071 | 1,216 | 1,920 | 1,761 |
| (Profitability %) | |||||||||
| ROA | -46.44 | -62.98 | -59.13 | -61.51 | -67.53 | -69.09 | -70.61 | -48.37 | -49.66 |
| ROE | -60.83 | -86.66 | -79.25 | -82.76 | -92.28 | -101.15 | -100.30 | -66.33 | -65.33 |
| (Per-share) Unit: JPY | |||||||||
| EPS | -4.7 | -9.0 | -5.2 | -5.8 | -5.6 | -4.6 | -6.1 | -1.7 | -3.9 |
| BPS | 32.3 | 23.6 | 23.9 | 22.0 | 22.4 | 19.0 | 19.9 | 28.7 | 26.0 |
| Dividend per Share | 0.00 | 0.00 | 0.00 | 0.00 | 0.00 | 0.00 | 0.00 | 0.00 | 0.00 |
| Shares Outstanding(million shares) | 48.42 | 48.50 | 50.01 | 52.19 | 55.40 | 56.39 | 61.24 | 66.97 | 67.77 |
Source: Omega Investment from company materials
Financial data (full-year basis)
| Unit: million yen | 2015/12 | 2016/12 | 2017/12 | 2018/12 | 2019/12 | 2020/12 | 2021/12 | 2022/12 | 2023/12 | 2024/12 |
| (Income Statement) | ||||||||||
| Sales | 280 | 252 | 260 | 213 | 448 | 481 | 713 | 631 | 682 | 781 |
| Year-on-year | -24.4% | -10.0% | 3.0% | -18.1% | 110.3% | 7.4% | 48.3% | -11.5% | 8.2% | 14.4% |
| Cost of Goods Sold | 225 | 228 | 94 | 107 | 167 | 238 | 292 | 283 | 285 | 348 |
| Gross Income | 55 | 25 | 166 | 106 | 281 | 243 | 421 | 348 | 398 | 433 |
| Gross Income Margin | 19.8% | 9.7% | 64.0% | 49.6% | 62.7% | 50.5% | 59.0% | 55.1% | 58.3% | 55.4% |
| SG&A Expense | 1,325 | 1,067 | 1,054 | 1,645 | 1,683 | 1,526 | 1,755 | 1,606 | 1,603 | 1,464 |
| EBIT (Operating Income) | -1,270 | -1,042 | -888 | -1,539 | -1,402 | -1,284 | -1,334 | -1,259 | -1,205 | -1,031 |
| Year-on-year | 10.0% | -17.9% | -14.8% | 73.4% | -8.9% | -8.4% | 3.9% | -5.7% | -4.2% | -14.5% |
| Operating Income Margin | -453.4% | -413.3% | -341.6% | -723.1% | -313.2% | -266.9% | -187.2% | -199.5% | -176.6% | -132.0% |
| EBITDA | -1,168 | -929 | -877 | -1,532 | -1,397 | -1,280 | -1,331 | -1,257 | -1,204 | -1,030 |
| Pretax Income | -1,281 | -1,501 | -880 | -1,531 | -1,401 | -1,291 | -1,466 | -1,238 | -1,215 | -1,018 |
| Consolidated Net Income | -1,283 | -1,491 | -883 | -1,534 | -1,404 | -1,294 | -1,480 | -1,243 | -1,220 | -1,021 |
| Minority Interest | 0 | 0 | 0 | 0 | 0 | 0 | 0 | 0 | 0 | 0 |
| Net Income ATOP | -1,283 | -1,491 | -883 | -1,534 | -1,404 | -1,294 | -1,480 | -1,243 | -1,220 | -1,021 |
| Year-on-year | 11.5% | 16.3% | -40.8% | 73.8% | -8.5% | -7.8% | 14.4% | -16.0% | -1.8% | -16.3% |
| Net Income Margin | -457.9% | -591.2% | -339.6% | -720.5% | -313.6% | -269.1% | -207.6% | -197.0% | -178.8% | -130.7% |
| (Balance Sheet) | ||||||||||
| Cash & Short-Term Investments | 4,100 | 4,553 | 4,027 | 2,329 | 2,106 | 2,686 | 1,791 | 1,727 | 1,326 | 2,063 |
| Total assets | 4,919 | 4,789 | 4,419 | 2,831 | 2,808 | 3,495 | 2,339 | 2,215 | 1,751 | 2,469 |
| Total Debt | 100 | 54 | 4 | 0 | 0 | 180 | 183 | 184 | 291 | 282 |
| Net Debt | -4,000 | -4,499 | -4,023 | -2,329 | -2,106 | -2,506 | -1,608 | -1,543 | -1,035 | -1,782 |
| Total liabilities | 355 | 224 | 202 | 154 | 187 | 385 | 446 | 425 | 594 | 549 |
| Total Shareholders’ Equity | 4,564 | 4,565 | 4,218 | 2,677 | 2,622 | 3,110 | 1,893 | 1,791 | 1,158 | 1,920 |
| (Cash Flow) | ||||||||||
| Net Operating Cash Flow | -1,245 | -970 | -867 | -1,689 | -1,537 | -1,360 | -1,131 | -1,191 | -1,069 | -1,001 |
| Capital Expenditure | 168 | 11 | 5 | 0 | 0 | 0 | 0 | 0 | 0 | 0 |
| Net Investing Cash Flow | -1,780 | 1,989 | -137 | 0 | -26 | -4 | -35 | 0 | 0 | 0 |
| Net Financing Cash Flow | 124 | 1,434 | 479 | -10 | 1,341 | 1,944 | 271 | 1,127 | 667 | 1,738 |
| (Profitability %) | ||||||||||
| ROA | -22.95 | -30.72 | -19.17 | -42.30 | -49.79 | -41.06 | -50.73 | -54.57 | -61.51 | -48.37 |
| ROE | -24.69 | -32.67 | -20.10 | -44.49 | -52.99 | -45.15 | -59.16 | -67.48 | -82.76 | -66.33 |
| (Per-share) Unit: JPY | ||||||||||
| EPS | -58.3 | -65.9 | -33.5 | -57.3 | -44.6 | -36.1 | -36.7 | -28.3 | -24.6 | -17.5 |
| BPS | 207.0 | 179.3 | 157.5 | 99.9 | 78.8 | 78.7 | 46.4 | 37.0 | 22.0 | 28.7 |
| Dividend per Share | 0.00 | 0.00 | 0.00 | 0.00 | 0.00 | 0.00 | 0.00 | 0.00 | 0.00 | 0.00 |
| Shares Outstanding (million shares) | 22.05 | 25.31 | 26.78 | 26.78 | 33.28 | 39.51 | 40.31 | 48.42 | 52.19 | 66.97 |
Source: Omega Investment from company materials