2026-03-12
Home
Japanese

Omega Investment Co., Ltd.
Hamee (Company note – Q4 update)

| Share price (7/16) | ¥1,198 | Dividend Yield (26/4 CE) | 1.9 % |
| 52weeks high/low | ¥830/1,519 | ROE(25/4) | 12.4 % |
| Avg Vol (3 month) | 98 thou shrs | Operating margin (25/4) | 10.3 % |
| Market Cap | ¥19.5 bn | Beta (5Y Monthly) | 0.9 |
| Enterprise Value | ¥19.1 bn | Shares Outstanding | 16.3 mn shrs |
| PER (26/4 CE) | 9.6 X | Listed market | TSE Standard |
| PBR (25/4 act) | 1.8 X |
| Click here for the PDF version of this page |
| PDF version |
In the fiscal year ended April 2025, results exceeded the Company’s forecast; in 2025, NE Inc.’s stock distribution-type spin-off and listing are finally approaching.
◇ Full-year results highlights for FY04/2025: double-digit increases in both revenue and profit
Hamee (hereinafter, the Company) announced its full-year financial results for the fiscal year ended April 2025 on June 13, 2025, reporting high growth in net sales, operating profit, ordinary profit, and net profit attributable to the owner of the parent.
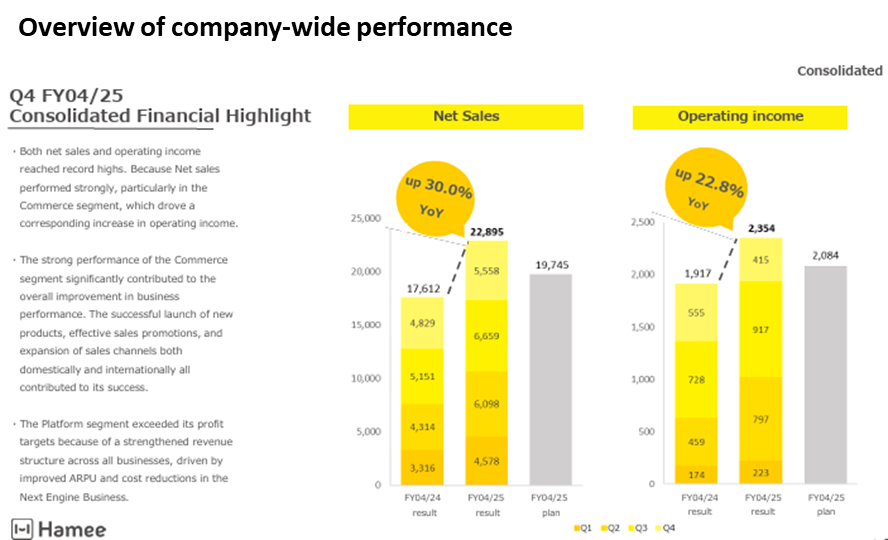
Overview: net sales, operating profit, and ordinary profit all exceeded the Company’s forecast, with operating profit and ordinary profit reaching record highs. Although net profit attributable to owner of parent fell short of the forecast due to valuation losses on affiliated companies, it still posted double-digit growth.
Specifically, for the full year, net sales were JPY22.89 billion (+30.0% YoY), operating profit was JPY2.35 billion (+22.8% YoY), and ordinary profit was JPY2.35 billion (+16.5% YoY). Net profit attributable to owner of parent was JPY1.27 billion (+13.9% YoY).
While inventories increased on the balance sheet, this was due to business expansion and was generally in line with expectations.
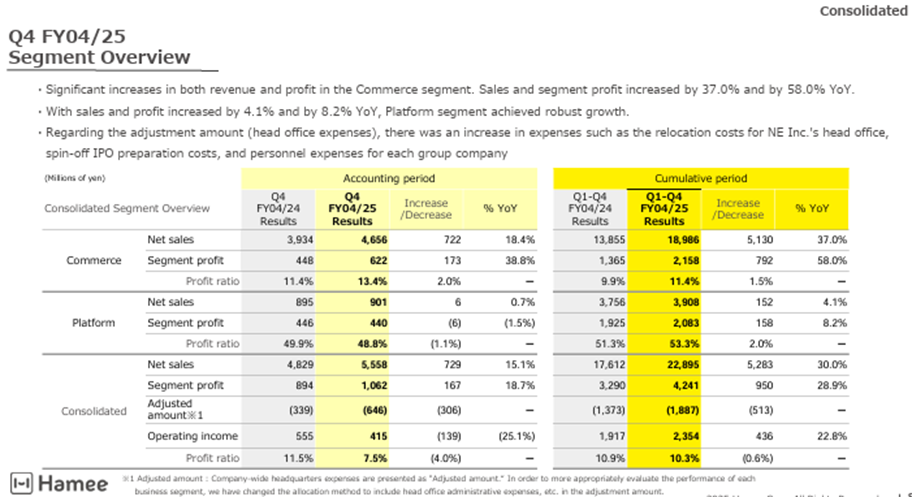
By segment: both of the two core segments showed notable strengths. In the Commerce Segment, all major businesses performed well, and both net sales and segment profit exceeded the initial forecast. In the Platform Segment, although the growth rate in net sales slightly missed the Company’s forecast, segment profit exceeded expectations.
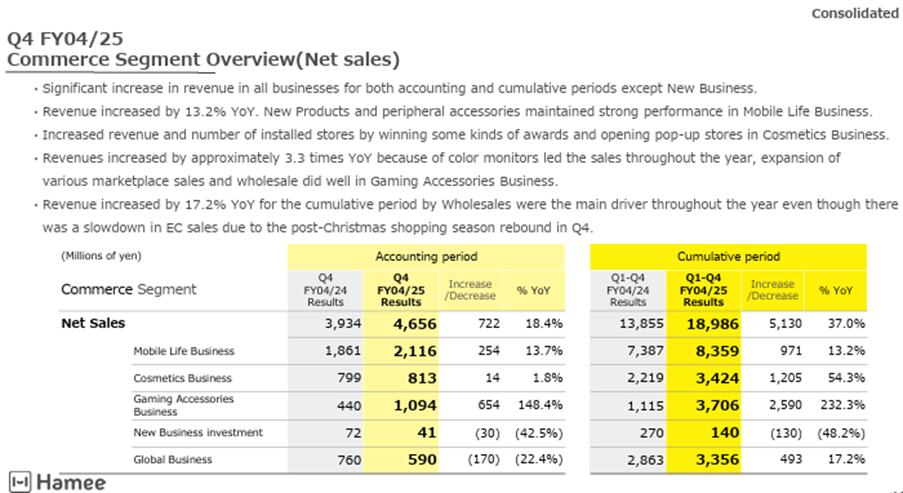
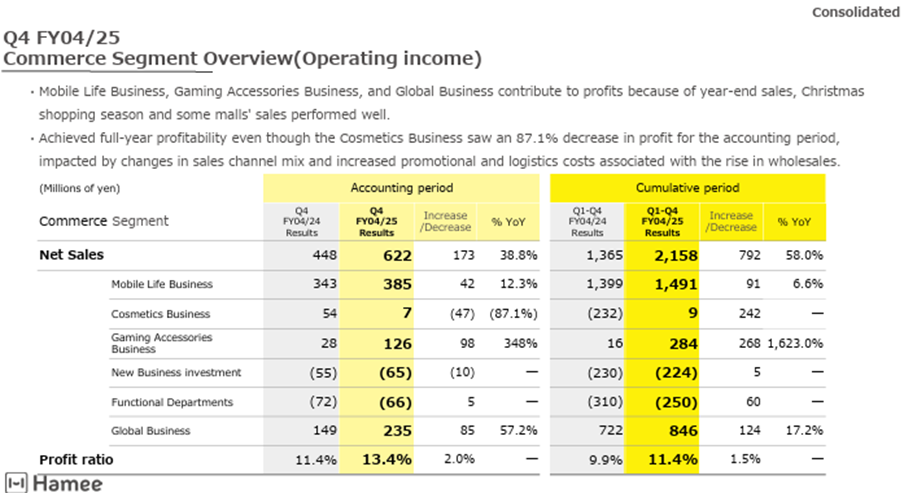
Commerce Segment details: the Mobile Life Business, Cosmetics Business, Gaming Accessories Business, and Global Business all achieved steady revenue growth. In terms of profit, the Mobile Life Business, traditionally a core driver, saw profit growth, while the Gaming Accessories Business and Global Business posted significant profit growth, and the Cosmetics Business turned profitable for the full year.
The reason for this seamless expansion in results lies in the effective combination of product strategies leveraging the characteristics of each brand, strengthened sales channels across both e-commerce and physical stores, and targeted promotional efforts. The Company has successfully built a well-balanced business portfolio without excessive reliance on any single business.
Mobile Life Business: 13.2% increase in revenue, 6.6% increase in profit (full-year basis; same applies below). Accessories, such as cases for the latest iPhone models and mobile batteries that utilize MagSafe functionality, performed well. Additionally, product expansion is progressing to include new series, such as BeBling, and cases compatible with Galaxy devices.
Cosmetics Business: 54.3% increase in revenue, turned profitable for the full year. Although quarterly profits and losses fluctuated due to the continuous launch of new products and ongoing efforts to raise brand awareness and expand sales channels, the business achieved full-year profitability, marking a significant milestone.
Gaming Accessories Business: 232.3% increase in revenue, 1,623.0% increase in profit. Based on the concept of spatial appeal, the Company rolled out high-performance new monitors in various colors, including white, along with original monitor arms and other accessories. Sales expanded sharply as sales channels widened. Going forward, the Company plans to strengthen its lineup of monitor-related peripherals and enhance customer engagement through digital transformation (DX) to achieve sustainable growth.
Global Business: 17.2% increase in revenue, 17.2% increase in profit. The business performed strongly by capturing demand during the Christmas season. Sales channel expansion in the U.S. is progressing, and future expansion into South Korea and Europe is also planned. Manufacturing profits are also increasing.
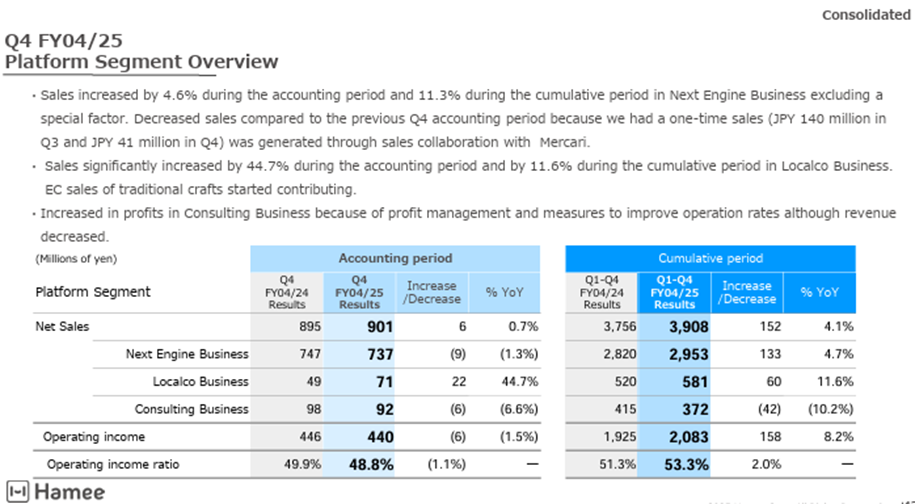
Platform Segment: The core NextEngine Business achieved steady underlying growth.
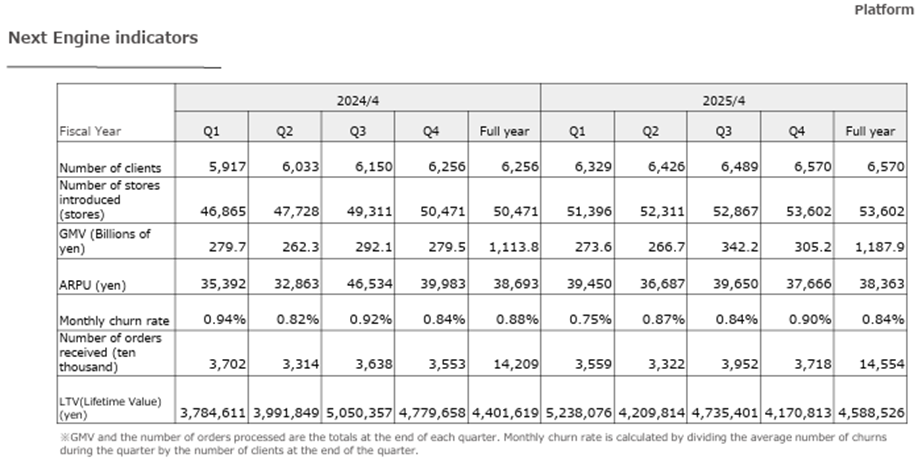
For the full year, the segment recorded a 4.1% increase in revenue and an 8.2% increase in profit, with the core NextEngine Business posting a 4.7% increase in revenue. However, when adjusting for the one-time revenue boost from the sales collaboration with Mercari in the second half of the previous fiscal year, the NextEngine Business achieved an 11.3% increase in revenue. The total number of contracted clients continues to grow steadily, the churn rate remains stable, and processed order volume increased by 2.4%. Additionally, actual ARPU, excluding the aforementioned Mercari-related impact, rose by 5.9%.
In terms of profit, although new businesses such as the encer mall incurred increased expenses, the growth of the NextEngine Business, along with solid profitability in the Localco Business and Consulting Business, contributed to the increase in segment profit.
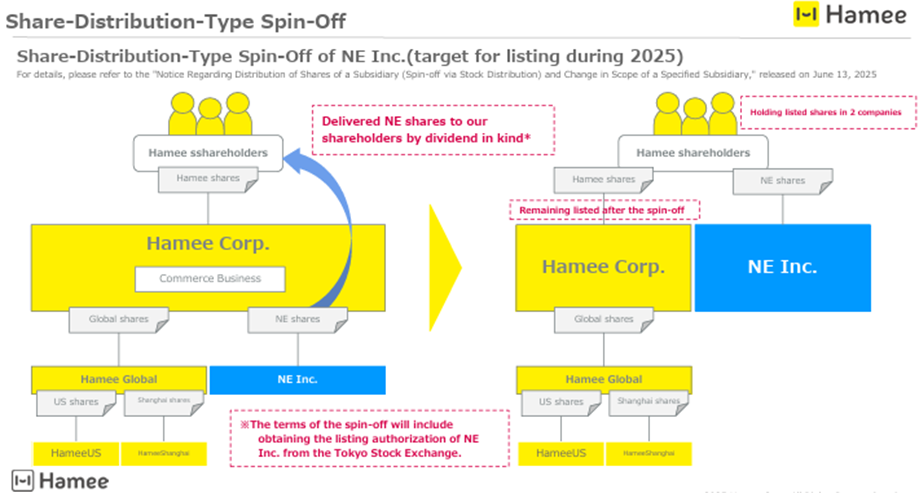
◇ Spin-off and listing of NE Inc.: progressing toward implementation in 2025 as initially planned.
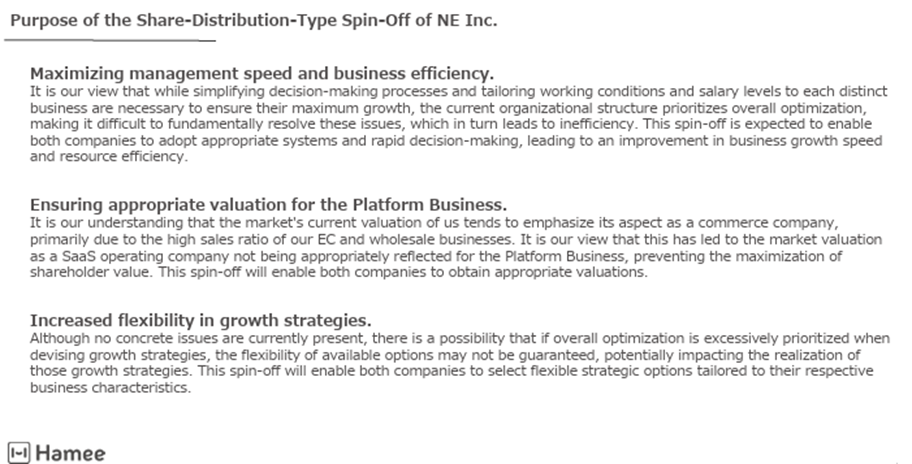
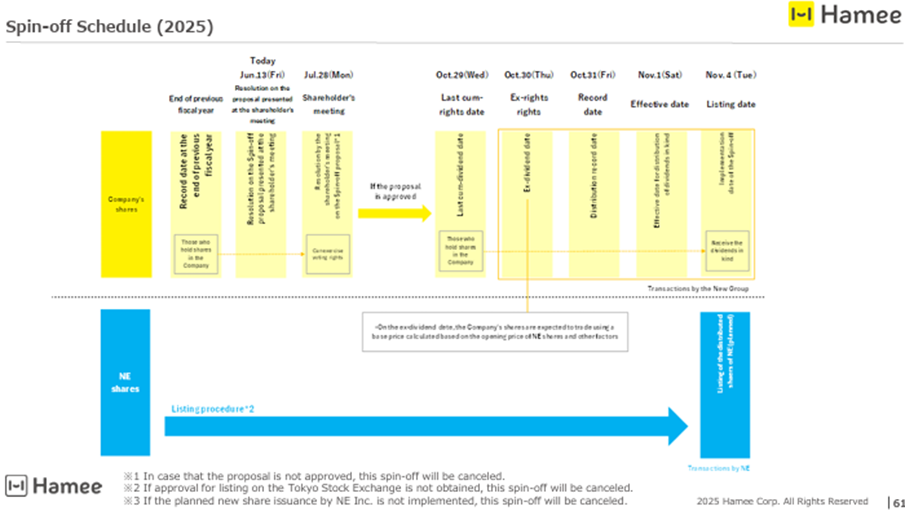
In line with the original plan, a proposal will be submitted at Hamee Corp.’s 27th Annual General Meeting of Shareholders, scheduled for July 28, 2025, to distribute all shares of NE Inc., which operates the Platform Segment, held by Hamee Corp. to its shareholders as a dividend in kind (a dividend of property other than cash; hereinafter, the “Spin-off”). This Spin-off will be executed if the listing on the Tokyo Stock Exchange is approved.
The objectives of this move are to maximize management speed and operational efficiency, ensure appropriate valuation of the Platform Business, and expand flexibility in growth strategies. Put simply, by separating the current two segments into independent entities, the aim is to accelerate the growth of each and, if a conglomerate discount exists in the stock market, to eliminate it—thus this is essentially a welcome development.
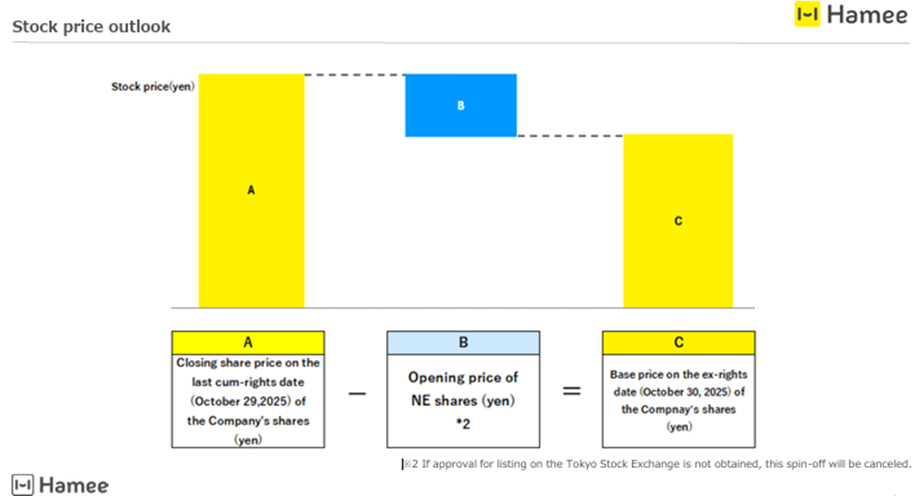
If the resolution is approved at the General Meeting and listing is approved by the TSE as scheduled, the final day with shareholder rights will be October 29, 2025. Shareholders as of that date will receive shares of NE Inc. on November 4, at which time NE Inc. shares are expected to be listed.
(For details, please refer to the diagram later in this document.)
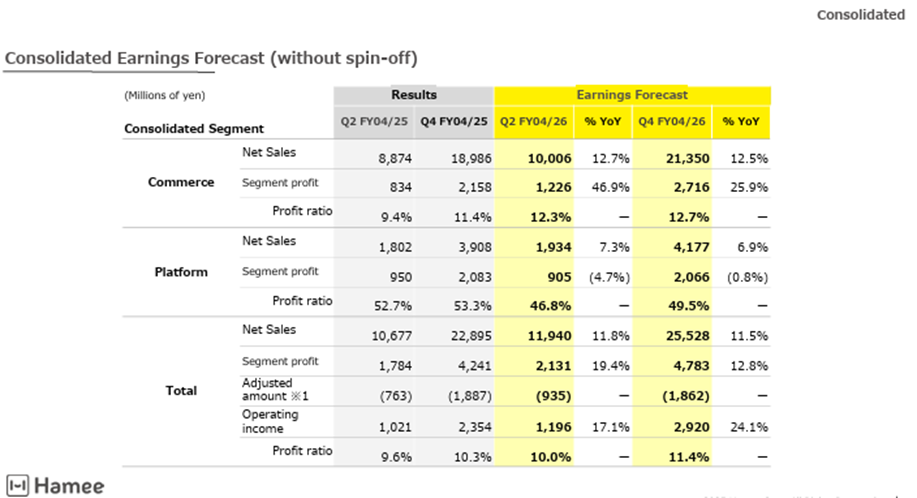
◇ Full-year forecast for FY04/2026: The Company projects continued double-digit growth in both revenue and profit
At this time, the forecast is presented on the assumption that the spin-off mentioned above will not occur.
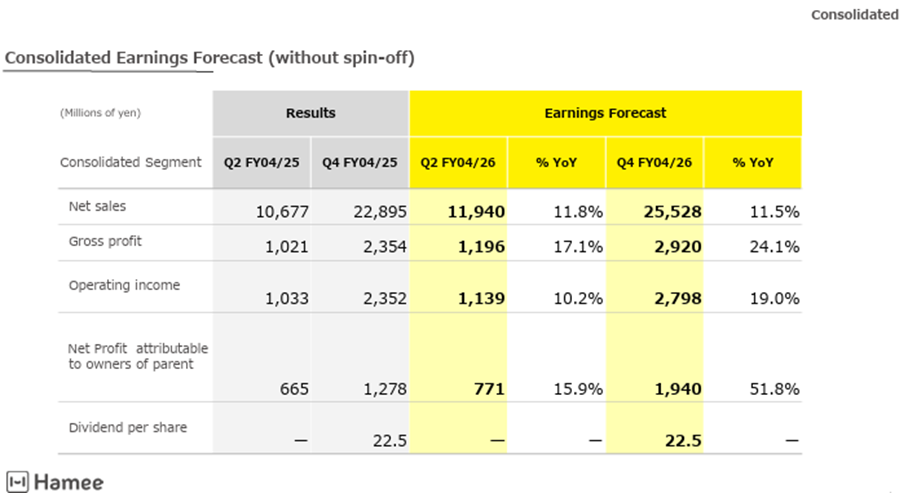
Consolidated earnings forecast: For the first half, net sales are projected to be JPY11.94 billion (+11.8% YoY), operating profit JPY1.19 billion (+17.1% YoY), ordinary profit JPY1.13 billion (+10.2% YoY), and quarterly net profit attributable to owner of parent JPY770 million (+15.9% YoY).
For the full year, net sales are projected to be JPY25.52 billion (+11.5% YoY), operating profit JPY2.92 billion (+24.1% YoY), ordinary profit JPY2.79 billion (+19.0% YoY), and net profit attributable to owner of parent JPY1.94 billion (+51.8% YoY). Earnings per share are projected to be JPY119.05, and the annual dividend per share is expected to remain unchanged at JPY22.50.
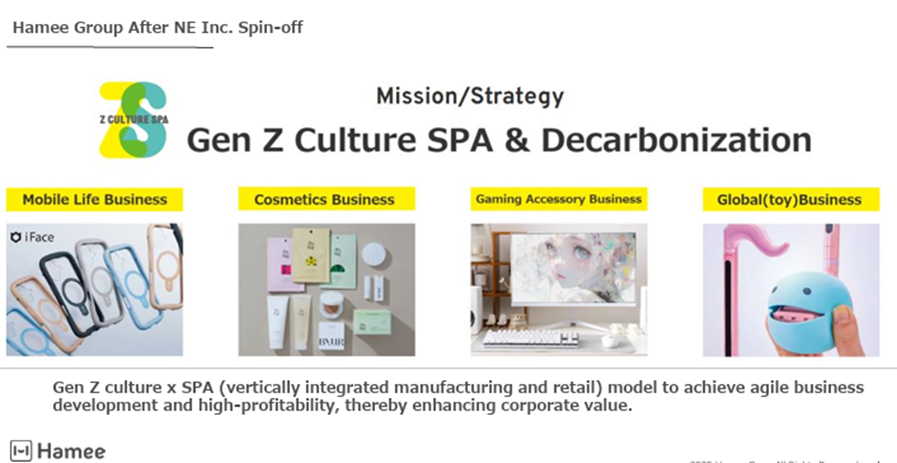
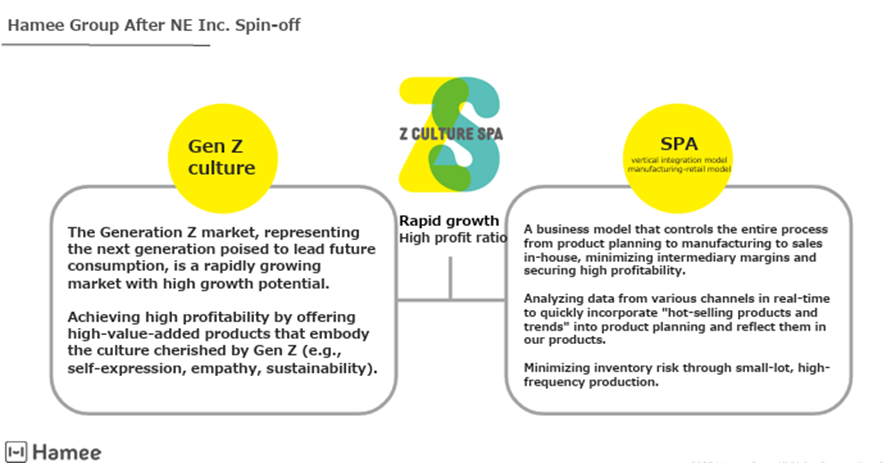
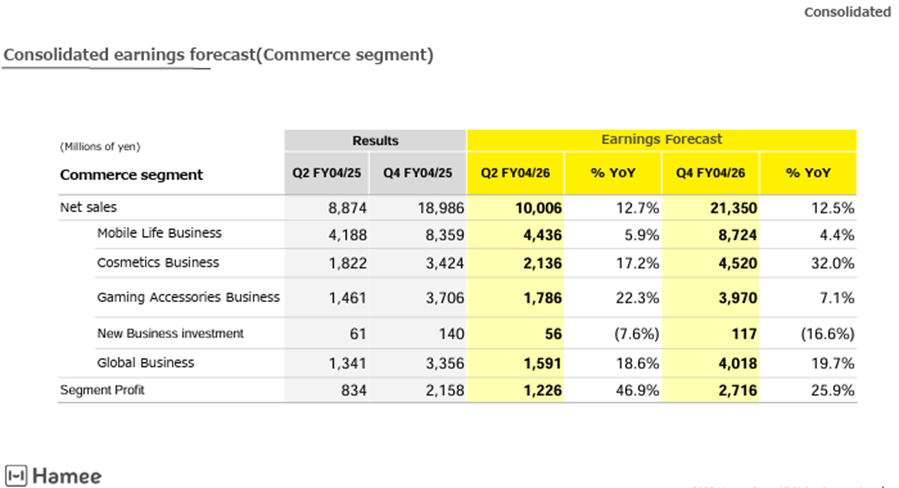
Commerce Business: With a business portfolio taking shape, the Company will adopt the “Gen Z Culture SPA & Decarbonization” as its mission and strategy going forward and will further advance its decarbonization efforts.
In the fiscal year ending April 2026, the Company aims for high growth by expanding all of its businesses, Mobile Life, Cosmetics, Gaming Accessories, and Global, targeting full-year net sales of JPY21.35 billion (+12.5% YoY) and segment profit of JPY2.71 billion (+25.9% YoY). This segment forecast exceeds the guidance in the previous medium-term management plan.
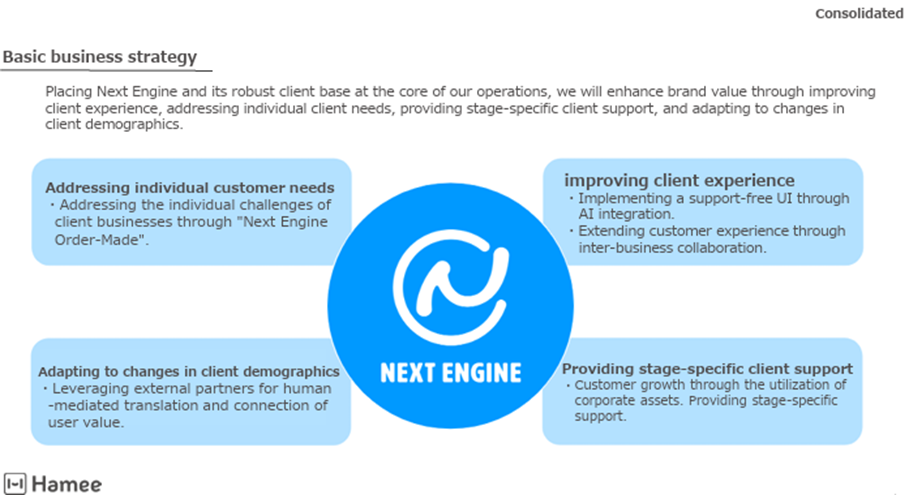
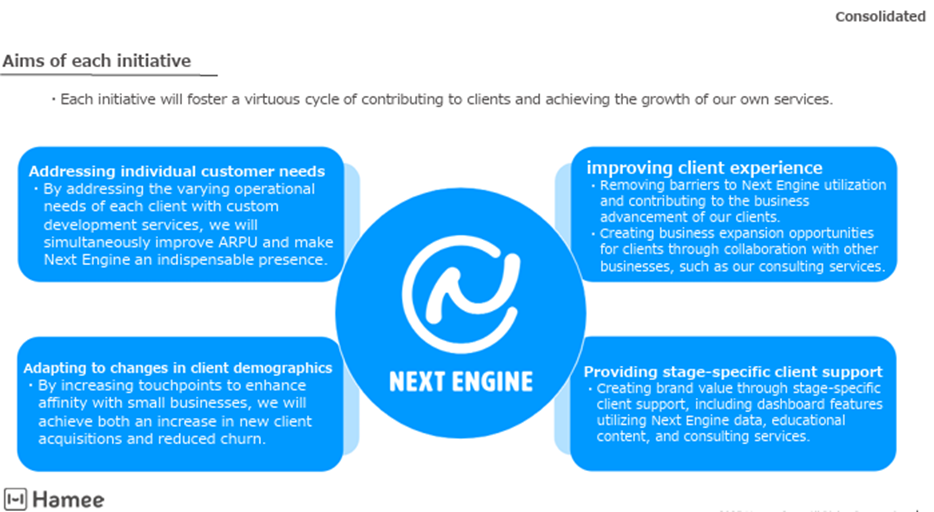
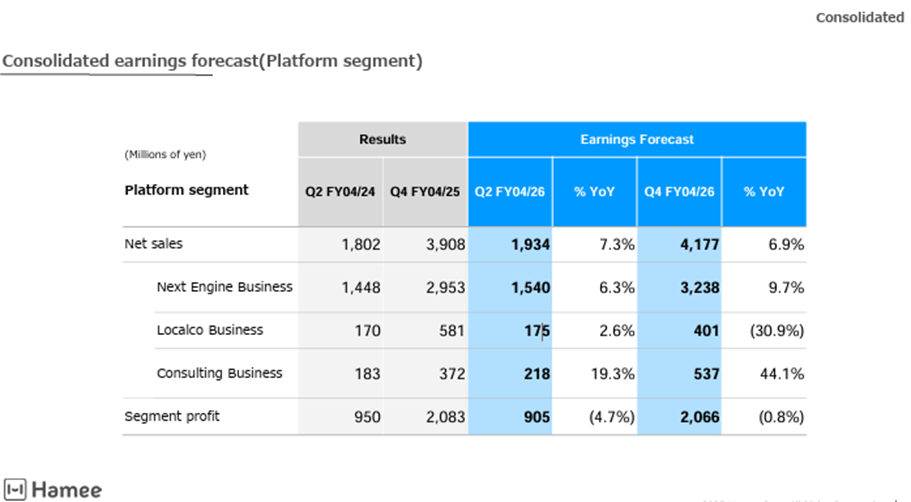
Platform Business: The encer mall Business (a wholesale marketplace matching manufacturers and retailers), which had been under development, will be discontinued and rebuilt as a core service within a newly envisioned “Glocal Commerce Platform Concept.” As the Localco Business is also expected to stagnate, the Company will position “ARPU enhancement” as its most important KPI in the core NextEngine Business. It plans to implement a wide-ranging sales approach with a focus on productivity, ranging from the use of AI-based automation tools tailored to customer attributes to building deeper relationships through integration with the Consulting Business.
For the fiscal year ending April 2026, the forecast is for full-year net sales of JPY4.17 billion (+6.9% YoY) and segment profit of JPY2.06 billion (-0.8% YoY). The lack of profit growth reflects the inclusion of IPO preparation costs and upfront investment in new businesses.
Additionally, this forecast is lower than the guidance provided in the previous medium-term management plan.
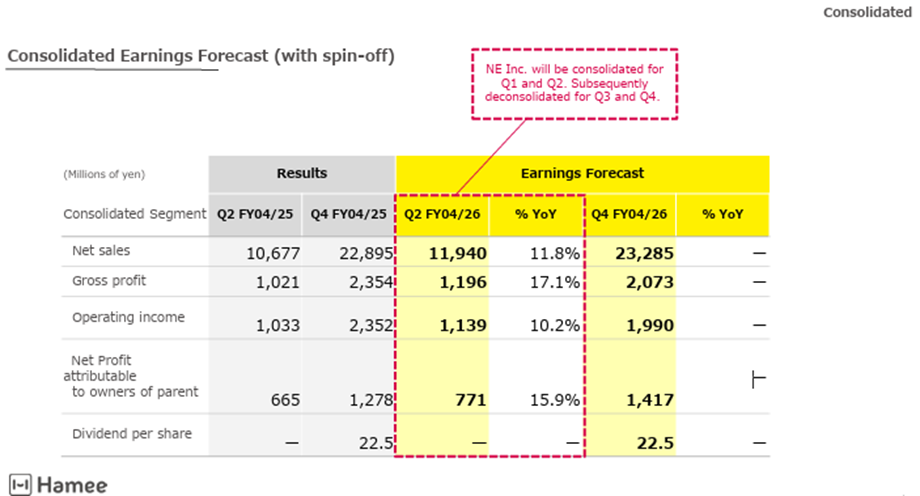
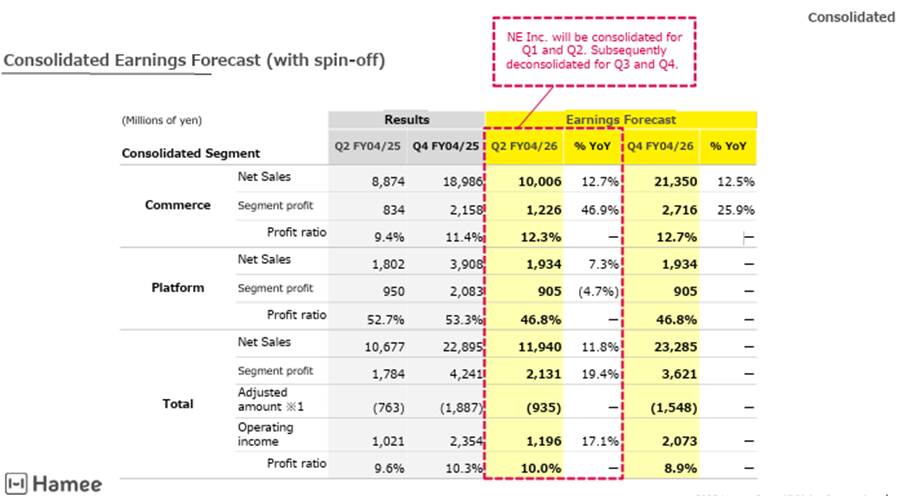
(For performance forecasts in the event the spin-off is executed, please refer to the diagram later in this document.)
◇Stock price trend and key points to watch going forward
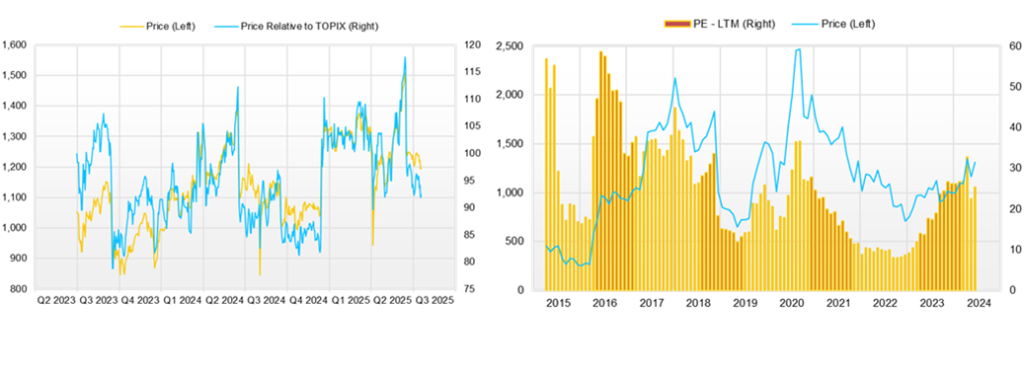
The Company’s stock price rose gradually in May and reached a high of JPY1,519 on June 12, the day before the earnings announcement, but declined after the announcement and is currently hovering around JPY1,250.
This is likely because, while the forecast for the fiscal year ending April 2026 calls for double-digit growth in both revenue and profit, the forecasted operating profit (JPY2.92 billion) falls short of the previous medium-term management plan target (JPY3.03 billion), despite the sales forecast exceeding it. The primary reason is sluggish profit growth in the Platform Business, where the current forecast (JPY2.06 billion) falls short of the previous plan (JPY2.39 billion).
This suggests that the investment thesis of “unlocking greater value in the Platform Business through a spin-off” has temporarily lost momentum.
However, based on the current stock price and assuming no spin-off, the forecast PER is around 10x and the PBR is approximately 1.9x, indicating that the stock market has yet to fully reflect the growth potential of the Company’s two businesses. In other words, the stock price still has upside potential.
Accordingly, the key points to watch going forward are as follows.
- That growth in the Commerce Segment gains further momentum—in other words, the Mobile Life, Cosmetics, Gaming Accessories, and Global businesses all achieve steady growth and profit expansion.
- A concrete outlook for the Commerce Segment’s upcoming Mission / Strategy of “Gen Z Culture SPA & Decarbonization,” and the Company’s competitive advantage.
- That the Company manages the impact of U.S. tariff increases within the Commerce Segment and minimizes their effects.
- A rebuilding of the growth narrative for the Platform Segment.
- Those measures to maximize ARPU by customer segment in the NextEngine Business progress, and the fiscal year ending April 2026 results in both revenue and profit growth.
- That the capital structure, shareholder composition, and capital allocation policy become clear in the event NE Inc. is spun off and listed.
- The IPO price of NE Inc.
- That NE Inc.’s management team demonstrates its commitment to growth through concrete examples after the IPO.
Company profile
◇Hamee Corp. (hereafter referred to as the Company) was founded in 1997, went public on the TSE Mothers in 2015 and is currently listed on the Standard Market. The Company operates through the Spin-off of two segments. The Commerce Segment, which includes Mobile Accessories, the Cosmetics Business, the Gaming Accessories Business, and the Global Business. the Platform Segment is mainly engaged in the provision of cloud-based (SaaS) EC Attractions “NextEngine”, which automates operations related to online shop management and enables cross-mall, multi-store order processing and centralized inventory management.
The Company is planning a reorganization by 2025. It plans to conduct a share-distribution-type spin-off of NE Inc., which is in charge of the Platform Segment, and list NE Inc. on the stock exchange. This series of reorganizations aims to avoid the conglomerate discount, efficiently operate each of the two segments, and appropriately and timely reflect the value of each business in the share price.
Key financial data
| Unit: million yen | 2021/4 | 2022/4 | 2023/4 | 2024/4 | 2025/4 | 2026/4 CE |
| Sales | 12,363 | 13,413 | 14,038 | 17,612 | 22,895 | 25,528 |
| EBIT (Operating Income) | 2,180 | 2,202 | 1,251 | 1,964 | 2,346 | |
| Pretax Income | 2,144 | 2,463 | 1,396 | 2,009 | 1,991 | |
| Net Profit Attributable to Owner of Parent | 1,556 | 1,744 | 945 | 1,122 | 1,278 | 1,940 |
| Cash & Short-Term Investments | 3,355 | 4,026 | 3,536 | 4,022 | 4,994 | |
| Total assets | 8,342 | 10,524 | 12,392 | 14,885 | 16,973 | |
| Total Debt | 104 | 544 | 1,300 | 2,327 | 3,850 | |
| Net Debt | -3,251 | -3,482 | -2,236 | -1,694 | -1,144 | |
| Total liabilities | 1,814 | 2,271 | 3,431 | 4,728 | 6,402 | |
| Total Shareholders’ Equity | 6,528 | 8,253 | 8,961 | 10,157 | 10,570 | |
| Net Operating Cash Flow | 1,941 | 1,186 | 695 | 886 | 827 | |
| Capital Expenditure | 351 | 1,018 | 487 | 477 | 783 | |
| Net Investing Cash Flow | -412 | -886 | -1,507 | -877 | -922 | |
| Net Financing Cash Flow | -1,736 | 298 | 263 | 380 | 1,171 | |
| Free Cash Flow | 1,760 | 362 | 405 | 577 | 225 | |
| ROA (%) | 18.94 | 18.49 | 8.25 | 8.22 | 8.02 | |
| ROE (%) | 27.42 | 23.60 | 10.98 | 11.73 | 12.33 | |
| EPS (Yen) | 98.4 | 109.7 | 59.4 | 70.4 | 80.2 | 121.6 |
| BPS (Yen) | 411.1 | 519.1 | 563.0 | 637.6 | 662.6 | |
| Dividend per Share (Yen) | 10.00 | 22.50 | 22.50 | 22.50 | 22.50 | 22.50 |
| Shares Outstanding (Million Shares) | 16.21 | 16.27 | 16.27 | 16.28 | 16.29 |
Source: Omega Investment from company data, rounded to the nearest whole number.
Share price
Overview of FY04/2025
Overview of company-wide performance
Source: Company material
Source: Company material
Source: Company material
Source: Company material
Overview of the Platform Segment
Source: Company material
Source: Company material
Spin-off and listing of NE Inc.
Source: Company material
Source: Company material
Strategy of the Hamee Group
Source: Company material
Source: Company material
Source: Company material
Source: Company material
Strategy of NE Inc.
Source: Company material
Source: Company material
FY04/2026 earnings forecast (without spin-off)
Source: Company material
Source: Company material
Source: Company material
Source: Company material
FY04/2026 earnings forecast (with spin-off)
Source: Company material
Source: Company material
Financial data (quarterly basis)
| Unit: million yen | 2023/4 | 2024/4 | 2025/4 | ||||||
| Q4 | Q1 | Q2 | Q3 | Q4 | Q1 | Q2 | Q3 | Q4 | |
| (Income Statement) | |||||||||
| Sales | 3,496 | 3,317 | 4,315 | 5,151 | 4,829 | 4,579 | 6,099 | 6,659 | 5,558 |
| Year-on-year | 1.8% | 6.8% | 22.3% | 31.8% | 38.1% | 38.1% | 41.3% | 29.3% | 15.1% |
| Cost of Goods Sold (COGS) | 1,517 | 1,279 | 1,631 | 1,858 | 1,977 | 1,841 | 2,628 | 2,668 | 2,261 |
| Gross Income | 1,979 | 2,038 | 2,684 | 3,293 | 2,852 | 2,738 | 3,471 | 3,991 | 3,297 |
| Gross Income Margin | 56.6% | 61.4% | 62.2% | 63.9% | 59.1% | 59.8% | 56.9% | 59.9% | 59.3% |
| SG&A Expense | 1,894 | 1,863 | 2,224 | 2,565 | 2,306 | 2,505 | 2,691 | 3,074 | 2,882 |
| EBIT (Operating Income) | 85 | 187 | 470 | 756 | 551 | 233 | 780 | 917 | 415 |
| Year-on-year | -74.0% | -24.8% | 44.1% | 27.0% | 545.8% | 24.7% | 65.9% | 21.3% | -24.6% |
| Operating Income Margin | 2.4% | 5.6% | 10.9% | 14.7% | 11.4% | 5.1% | 12.8% | 13.8% | 7.5% |
| EBITDA | 332 | 377 | 670 | 953 | 749 | 435 | 941 | 1,163 | 623 |
| Pretax Income | 174 | 205 | 492 | 737 | 576 | 200 | 811 | 702 | 278 |
| Consolidated Net Income | 130 | -133 | 334 | 492 | 428 | 101 | 564 | 400 | 211 |
| Minority Interest | 130 | -133 | 334 | 492 | 428 | 101 | 564 | 400 | 211 |
| Net Income ATOP | -55.8% | -164.0% | 16.1% | 53.6% | 228.4% | -176.6% | 68.8% | -18.6% | -50.5% |
| Year-on-year | 3.7% | -4.0% | 7.8% | 9.5% | 8.9% | 2.2% | 9.3% | 6.0% | 3.8% |
| Net Income Margin | |||||||||
| (Balance Sheet) | 3,536 | 3,176 | 2,983 | 3,430 | 4,022 | 3,642 | 3,912 | 4,204 | 4,994 |
| Cash & Short-Term Investments | 12,392 | 12,350 | 13,197 | 14,210 | 14,885 | 15,295 | 16,838 | 18,197 | 16,973 |
| Total assets | 1,300 | 1,700 | 1,650 | 1,928 | 2,327 | 3,232 | 3,980 | 3,927 | 3,850 |
| Total Debt | -2,236 | -1,476 | -1,333 | -1,502 | -1,694 | -410 | 68 | -277 | -1,144 |
| Net Debt | 3,431 | 3,608 | 4,040 | 4,566 | 4,728 | 5,242 | 6,490 | 7,553 | 6,402 |
| Total liabilities | 8,961 | 8,742 | 9,156 | 9,644 | 10,157 | 10,053 | 10,348 | 10,644 | 10,570 |
| Total Shareholders’ Equity | |||||||||
| (Profitability %) | 8.25 | 5.31 | 5.29 | 6.20 | 8.22 | 9.81 | 10.56 | 9.22 | 8.02 |
| ROA | 10.98 | 7.12 | 7.41 | 8.88 | 11.73 | 14.43 | 16.26 | 14.73 | 12.33 |
| ROE | |||||||||
| (Per-share) Unit: yen | 8.2 | -8.3 | 21.0 | 30.9 | 26.9 | 6.4 | 35.4 | 25.1 | 13.3 |
| EPS | 563.0 | 549.2 | 575.0 | 605.6 | 637.6 | 630.7 | 648.8 | 667.4 | 662.6 |
| BPS | 22.50 | 0.00 | 0.00 | 0.00 | 22.50 | 0.00 | 0.00 | 0.00 | 22.50 |
| Dividend per Share | 16.28 | 16.28 | 16.28 | 16.28 | 16.28 | 16.29 | 16.29 | 16.29 | 16.29 |
Source: Omega Investment from company materials
Financial data (full-year basis)
| Unit: million yen | 2017/4 | 2018/4 | 2019/4 | 2020/4 | 2021/4 | 2022/4 | 2023/4 | 2024/4 | 2025/4 |
| (Income Statement) | |||||||||
| Sales | 8,503 | 9,379 | 10,300 | 11,325 | 12,363 | 13,413 | 14,038 | 17,612 | 22,895 |
| Year-on-year | 30.8% | 10.3% | 9.8% | 10.0% | 9.2% | 8.5% | 4.7% | 25.5% | 30.0% |
| Cost of Goods Sold | 4,485 | 4,618 | 5,056 | 4,894 | 4,802 | 4,892 | 5,563 | 6,745 | 9,398 |
| Gross Income | 4,018 | 4,761 | 5,244 | 6,431 | 7,562 | 8,522 | 8,476 | 10,867 | 13,497 |
| Gross Income Margin | 47.3% | 50.8% | 50.9% | 56.8% | 61.2% | 63.5% | 60.4% | 61.7% | 59.0% |
| SG&A Expense | 2,916 | 3,381 | 4,080 | 4,686 | 5,382 | 6,319 | 7,225 | 8,959 | 11,151 |
| EBIT (Operating Income) | 1,102 | 1,380 | 1,164 | 1,745 | 2,180 | 2,202 | 1,251 | 1,964 | 2,354 |
| Year-on-year | 146.8% | 25.2% | -15.7% | 50.0% | 24.9% | 1.0% | -43.2% | 57.0% | 19.5% |
| Operating Income Margin | 13.0% | 14.7% | 11.3% | 15.4% | 17.6% | 16.4% | 8.9% | 11.1% | 10.2% |
| EBITDA | 1,272 | 1,627 | 1,525 | 2,227 | 2,694 | 2,840 | 2,042 | 2,749 | 3,162 |
| Pretax Income | 1,010 | 1,259 | 1,179 | 1,582 | 2,144 | 2,463 | 1,396 | 2,009 | 1,991 |
| Consolidated Net Income | 696 | 873 | 821 | 1,069 | 1,556 | 1,744 | 945 | 1,122 | 1,278 |
| Net Income ATOP | 696 | 873 | 821 | 1,069 | 1,556 | 1,744 | 945 | 1,122 | 1,278 |
| Year-on-year | 169.7% | 25.4% | -5.9% | 30.2% | 45.5% | 12.0% | -45.8% | 18.6% | 13.9% |
| Net Income Margin | 8.2% | 9.3% | 8.0% | 9.4% | 12.6% | 13.0% | 6.7% | 6.4% | 5.6% |
| (Balance Sheet) | |||||||||
| Cash & Short-Term Investments | 1,324 | 1,695 | 1,660 | 3,453 | 3,355 | 4,026 | 3,536 | 4,022 | 4,994 |
| Total assets | 4,240 | 5,042 | 5,761 | 8,097 | 8,342 | 10,524 | 12,392 | 14,885 | 16,973 |
| Total Debt | 468 | 298 | 500 | 1,740 | 104 | 544 | 1,300 | 2,327 | 3,850 |
| Net Debt | -856 | -1,397 | -1,160 | -1,713 | -3,251 | -3,482 | -2,236 | -1,694 | -1,144 |
| Total liabilities | 1,484 | 1,445 | 1,572 | 3,272 | 1,814 | 2,271 | 3,431 | 4,728 | 6,402 |
| Total Shareholders’ Equity | 2,756 | 3,597 | 4,189 | 4,824 | 6,528 | 8,253 | 8,961 | 10,157 | 10,570 |
| (Cash Flow) | |||||||||
| Net Operating Cash Flow | 576 | 1,246 | 651 | 1,934 | 1,941 | 1,186 | 695 | 886 | 827 |
| Capital Expenditure | 228 | 437 | 291 | 649 | 351 | 1,018 | 487 | 477 | 783 |
| Net Investing Cash Flow | -433 | -674 | -671 | -1,020 | -412 | -886 | -1,507 | -877 | -922 |
| Net Financing Cash Flow | 69 | -230 | -7 | 933 | -1,736 | 298 | 263 | 380 | 1,171 |
| Free Cash Flow | 464 | 960 | 526 | 1,440 | 1,760 | 362 | 405 | 577 | 225 |
| (Profitability %) | |||||||||
| ROA | 19.18 | 18.81 | 15.21 | 15.43 | 18.94 | 18.49 | 8.25 | 8.22 | 8.02 |
| ROE | 29.30 | 27.48 | 21.10 | 23.73 | 27.42 | 23.60 | 10.98 | 11.73 | 12.33 |
| Net Profit Margin | 8.18 | 9.31 | 7.97 | 9.44 | 12.59 | 13.00 | 6.73 | 6.37 | 5.58 |
| Asset Turnover | 2.34 | 2.02 | 1.91 | 1.63 | 1.50 | 1.42 | 1.23 | 1.29 | 1.44 |
| Financial Leverage | 1.53 | 1.46 | 1.39 | 1.54 | 1.45 | 1.28 | 1.33 | 1.43 | 1.54 |
| (Per-share) Unit: yen | |||||||||
| EPS | 44.2 | 54.7 | 51.2 | 67.4 | 98.4 | 109.7 | 59.4 | 70.4 | 80.2 |
| BPS | 174.0 | 224.1 | 263.0 | 305.5 | 411.1 | 519.1 | 563.0 | 637.6 | 662.6 |
| Dividend per Share | 4.50 | 5.50 | 6.50 | 7.00 | 10.00 | 22.50 | 22.50 | 22.50 | 22.50 |
| Shares Outstanding (Million Shares) | 15.74 | 15.94 | 16.08 | 16.10 | 16.21 | 16.27 | 16.27 | 16.28 | 16.29 |
Source: Omega Investment from company materials