2026-03-12
Home
Japanese

Omega Investment Co., Ltd.
f-code (Investment report – Basic)
| Share price (8/4) | ¥2,325 | Dividend Yield (25/12 CE) | 0.0 % |
| 52weeks high/low | ¥735/2,477 | ROE(24/12) | 18.3 % |
| Avg Vol (3 month) | 184.8 thou shrs | Operating margin (TTM) | 27.9 % |
| Market Cap | ¥28.83 bn | Beta (5Y Monthly) | 1.62 |
| Enterprise Value | ¥29.47 bn | Shares Outstanding | 12.401 mn shrs |
| PER (25/12 CE) | 22.3 X | Listed market | TSE Growth |
| PBR (24/12 act) | 4.3 X |
| Click here for the PDF version of this page |
| PDF version |
Rapid growth driven by marketing SaaS and M&A strategy
Leading the market with high profitability and capital efficiency
Conclusion
Sustainable growth driven by multi-service expansion. Market valuation as a high-ROE company and appeal as a medium- to long-term investment opportunity
f-code, Inc. (hereinafter “f-code”) has established a solid recurring-revenue base centered on its CX (customer experience) SaaS product, “CODE Marketing Cloud,” in the digital marketing domain. This product offers a comprehensive solution that encompasses visualization of user behavior, personalized delivery, and landing page optimization (LPO), while maintaining a high customer retention rate. In addition, recent M&A activity has enabled the company to expand into adjacent services such as website production, UI/UX design, SEO support, and CRM optimization, enhancing its overall DX support capabilities. This aspect has received favorable evaluation.
Since 2023, the company has also undertaken M&A in the AI and technology domain and begun developing solutions in that space. Integration with existing services has led to an increase in customer unit prices and cross-selling effects, boosting profitability. In FY2024/12, the company forecasts operating profit of 1,432 million yen (YoY +122.2%), and for FY2025/12, further growth to 2,200 million yen, representing two consecutive years of significant operating profit growth, both realized and expected.
In the stock market, the company is valued as a high-profitability firm, with a PER of 20.94x, PBR of 4.34x, and ROE of 20.8%. These levels suggest the market is pricing in annual EPS growth of approximately +20%, indicating a baseline assumption of continued growth. However, recent earnings growth has far exceeded this expectation, and operating cash flow remains solid. EPS is projected to grow from adjusted EPS* of 13.40 yen in FY2021/12 to 104.84 yen in FY2025/12, an approximately 7.8-fold increase over four years, equivalent to a CAGR of around 67%. Moreover, in the medium-term management plan announced in February 2025, the company set a target of 5 billion yen in operating profit for FY2027/12, assuming a continued CAGR of over 50%. The company is also enhancing flexibility in its capital policy through share buybacks (approx. 200,000 shares, approx. 350 million yen in 2025) and by securing funds for new M&A deals.
Meanwhile, although the earnings yield (inverse PER) is around 5%, which may appear modest at first glance, based on the company’s track record of 67% EPS CAGR over the past four years and its bold target of over 50% CAGR for the next three years, the current valuation level may even seem undervalued. In particular, as long as scalability through M&A continues and operating profit margin and ROIC improve in tandem, this stock has strong potential as a growth component within a portfolio.
Taken as a whole, f-code is a rare DX player with three combined strengths: stable revenue through recurring SaaS, accelerated growth through M&A strategy, and a high-ROE structure. The company’s performance has been progressing at a pace exceeding market growth expectations, and the probability of realizing its medium- to long-term growth scenario is steadily increasing. Against this backdrop, the company remains a noteworthy investment target for institutional investors seeking both structural earnings stability and high growth. The following section will examine the structural strengths of the company’s business foundation.
*Adjusted EPS is used, calculated by applying the tax rate to pretax profit and dividing by the average number of shares during the period, due to the significant impact of temporary differences such as past loss carryforwards on net income.
1. Company overview
A growth company at the intersection of CX and DX. Differentiating itself through SaaS × consulting.
f-code, Inc., headquartered in Shinjuku-ku, Tokyo, is a digital marketing support company whose core businesses are SaaS-based services starting from customer experience (CX) and support for promoting DX. The company was founded in 2006 and launched its main product, the website customer engagement tool “CODE Marketing Cloud,” in 2018. It was listed on the Tokyo Stock Exchange Mothers (now known as the Growth Market) in December 2021.
The essence of the company’s value proposition lies in the fusion of products and consulting, specialized in “digital × customer experience.” In addition to providing SaaS-based marketing tools, the company consistently supports clients from strategic planning through execution, utilizing data informed by each client’s industry-specific challenges and customer behavior. This structure enables conscious support not only for tool implementation but also for its impact on business performance.
Although the company operates a single business segment (DX business), in practice, it spans multiple areas, including “marketing,” “data science,” “product,” “engineering,” and “creative,” and the ability to combine these comprehensively is one of its strengths. Furthermore, it leverages a “CX data platform” built from support provided to over 1,000 clients in areas ranging from website engagement and EFO to chatbot implementation and data analysis. This enables the company to eliminate dependence on individuals while delivering highly repeatable improvement measures.
In recent years, f-code has strengthened its group structure and, as of May 2025, has brought the following companies under its umbrella through M&A, resulting in a total of 11 consolidated subsidiaries. Each of these subsidiaries operates in a growth market such as web marketing, SNS operations, AI development, or IT education, and the company is pursuing a scalable growth strategy while increasingly taking on the characteristics of a holding company.
Key subsidiaries include SAKIYOMI Co., Ltd. (support for SNS operations), BUZZ Co., Ltd. (social media education business), and SpinFlow Co., Ltd. (development of generative AI platforms).
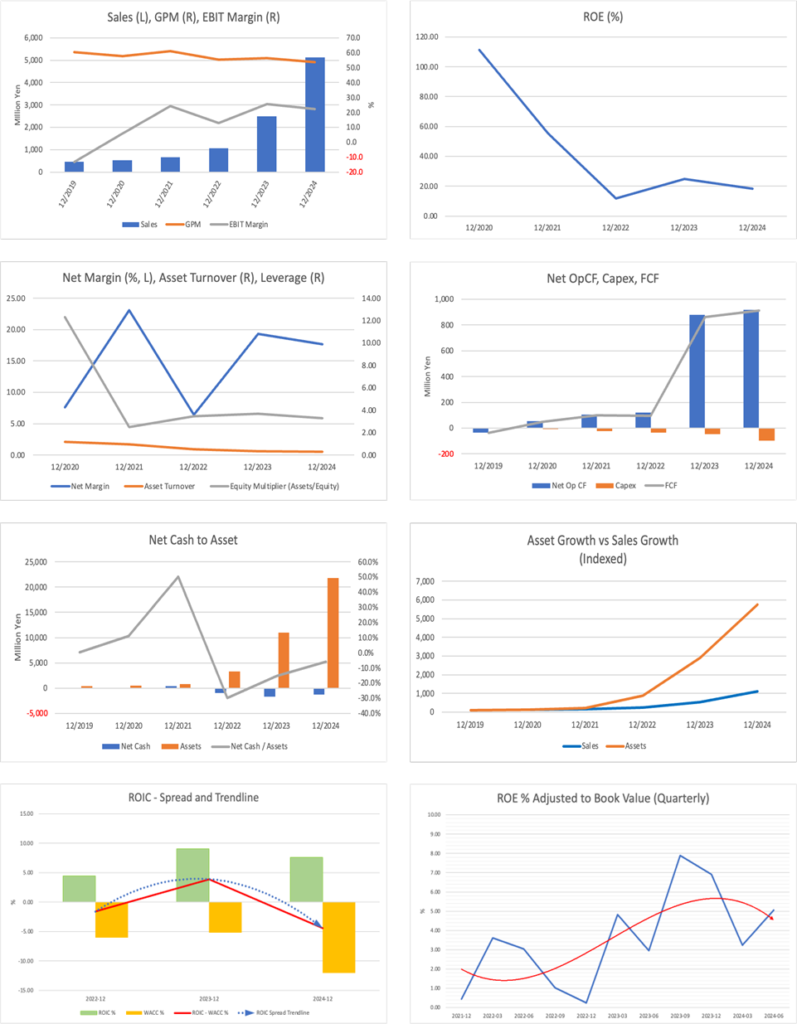
For the fiscal year ending December 2024, consolidated revenue is 5.13 billion yen, operating profit is 1.43 billion yen, and ROE is 20.8%. Operating cash flow is also strong at 910 million yen, demonstrating both a stable growth foundation and high profitability.
With the mission of “enriching the world through marketing technology,” f-code aims to evolve into a platform company that continually optimizes the relationship between businesses and consumers through CX-based DX support.
2. Business characteristics and content
A high-resolution marketing support structure integrating SaaS based on CX data with hands-on DX support.
f-code’s business consists of providing SaaS products centered on improving customer experience (CX) and delivering integrated DX services that offer professional support in digital marketing. Although it operates a single segment, its central feature is the multifaceted coverage of key areas essential to corporate digital strategy, including SaaS, UI/UX improvement, data utilization, advertising, CRM, and SEO.
The core product, “CODE Marketing Cloud,” is a website engagement tool that analyzes user behavior on websites and presents actions, such as pop-ups, at optimal times. It links with access logs and customer databases, and is designed to maximize LTV (lifetime value) without altering existing page structures. This enables sophisticated, personalized measures tailored to individual customer needs.
In addition, the company offers a lineup of SaaS products, including the EFO (entry form optimization) tool “f-tra EFO,” the chatbot “sinclo,” and “hachidori,” which supports LINE and Messenger. All of these products are offered as SaaS, maintain high contract renewal rates, and contribute to stable revenue.
At the same time, the company’s main business domain also includes consulting-type DX support beyond simply providing SaaS. Leveraging its proprietary CX data platform, the company has established a service system that supports the full marketing PDCA cycle, including peer benchmarking, visualizing industry structures, and designing communication strategies based on data. At the strategic planning stage, it offers support at the management level, and during execution, it provides hands-on assistance with advertising operations, UI improvement, and sales support.
This structure enables the provision of multiple services to a single client company, driving “cross-selling” and increasing customer unit price. Furthermore, with the acceleration of its M&A strategy since 2022, the company has expanded its service domains into adjacent areas such as SEO support, video production, IT education, and AI product development, thereby enhancing the group’s overall service capabilities.
In FY2025/12, revenue of 5.5 billion yen is expected from the marketing domain, and 4.5 billion yen from the AI and technology domain, indicating a noticeable acceleration of the latter. The synergies between AI-related products and consulting are highly likely to become a key driver of future earnings.
In this way, f-code is steadily establishing a unique position as a “comprehensive DX platform” that combines SaaS and professional support. Quantitative KPIs also support this: the number of clients has increased tenfold over five years (from 228 in 2020 to 2,179 in 2024), demonstrating the company’s record of sustained high growth over multiple years.
3. Major shareholders and investment trends
Founder-led management structure and stable long-term shareholders. Shareholder composition evolving amid expectations for high ROE.
As of July 2025, the shareholder structure shows that President and Representative Director Tsutomu Kudo, the company’s founder, holds 39.09% (approx. 4.79 million shares), maintaining an owner-company model that ensures management consistency and flexibility in capital policy. Insider holdings by other founding members and officers are also high, with insider shareholders accounting for approximately 64.3% of total shares. This reflects a governance system focused on medium- to long-term corporate value creation.
Among institutional investors, principal domestic asset manager Asset Management One holds 5.10%, while Mynavi (3.29%) and Future Corporation (3.10%) are listed as other major shareholders. Notably, the stakes held by Mynavi and Future are seen as strategic investments with potential for business synergy, indicating relationships that go beyond financial returns.
Market liquidity remains solid, and since June 2025, multiple asset management firms have either initiated or increased their holdings. For instance, Nikko Asset Management held 1.02% (125,000 shares) as of December 2024 and has increased its holdings in 2025. Active funds focusing on growth stocks—such as Simplex and Fivestar—have also entered the market, albeit on a smaller scale.
Meanwhile, two rounds of share buybacks were executed in the spring of 2025. The first round (March 2025) repurchased 40,000 shares, and the second (April–May) repurchased 160,000 shares (total acquisition cost: 355 million yen) through market purchases, equivalent to approximately 1.6% of the total shares outstanding. These share buybacks are planned to be used as consideration in future M&A deals and as incentives for the management of existing subsidiaries. This is viewed as an effort to enhance capital policy flexibility while maintaining financial soundness.
Overall, the shareholder structure is well-balanced to ensure both stable management and a growth-oriented approach. Investor behavior reflects confidence in the company’s equity story, characterized by high ROE and growth. While founder-led, the structure also includes strategic external shareholders, allowing for flexibility in future capital policy, fundraising, and M&A strategy.
4. Medium-term management plan
An ambitious scenario targeting 50% CAGR in operating profit, deploying a scalable strategy centered on M&A and AI.
f-code has laid out a three-year medium-term management plan starting with FY2025/12, with the basic policy of “sustained high growth through group synergies and product expansion.” It has set highly ambitious numerical targets of over 15 billion yen in revenue and over 5 billion yen in operating profit for FY2027/12, assuming a CAGR of over 50% in operating profit.
The core of the plan is built on three pillars: “expanding subscription-based products × strengthening cross-selling in the DX domain × expanding the value chain through AI technology.” The growth drivers assumed are as follows:
① Accelerating product growth: In the SaaS business centered on the flagship product “CODE Marketing Cloud,” progress is being made in acquiring new customers and increasing ARPU (average revenue per user) among existing customers through cross-selling. Additionally, efforts are being made to improve LTV by strengthening integration with surrounding SaaS products such as the chatbot “hachidori” and the EFO optimization tool “f-tra EFO.”
② Expanding capabilities through M&A: Since 2023, the company has carried out more than 10 M&A deals, building a group structure that covers everything from upstream to downstream customer touchpoints—including UI/UX improvement, video production, engineer training, call centers, and generative AI development. The company plans to continue with new M&A activity while pursuing early PMI (post-merger integration) to drive profit contribution from acquired companies.
③ Business integration of AI technology: In 2023, the company began developing products utilizing generative AI, and in 2024, it acquired AI-related firms, including SpinFlow and Ciel Zero. The integration of generative AI with existing marketing tools is expected to create new value, such as enhanced decision-making support and optimized content.
The outlook for FY2025/12, the first year of the plan, is based on EPS growth from 13.40 yen in FY2021/12 to 104.84 yen in FY2025/12, an increase of 7.8 times over four years (CAGR +67%). This growth pace far exceeds the +20% growth expectations typically priced in by the market.
On the organizational side, the company is strengthening its internal training systems for technical and consulting talent, particularly in the AI and data domains, to ensure both the quantity and quality of DX personnel. This effort supports the company’s capacity to handle its expanding customer base and business domains.
While the FY2025/12 targets, more than doubling both revenue and profit in a short period, represent a challenging scenario, the company has made a solid start, with 1Q FY2025/12 revenue growth at 24.2% and operating profit growth at 26.0%.
5. International business
Seeking a shift from a domestically-contained model. Limited but ongoing early moves into Southeast Asia and North America.
f-code’s business development currently relies mainly on the domestic market, with virtually all revenue for FY2024/12 recorded in Japan. The global revenue ratio is estimated to be under 1%, and the company has clearly stated its policy to focus on the short- to medium-term on deepening and expanding its operations within the domestic market, where DX demand remains strong and stable.
Although the company previously had local subsidiaries in Southeast Asia (Bangkok, Thailand) and Hong Kong, both have already been liquidated, and f-code currently has no overseas offices. However, considering external factors such as the increasing demand for marketing DX in Southeast Asia and North America, as well as a rise in projects from global companies, the possibility of reentering overseas markets has not been ruled out.
Notably, some subsidiaries acquired through M&A possess functionality for overseas expansion and multilingual support. For example, SpinFlow has developed integration capabilities with global generative AI models and is compatible with cloud infrastructure in North America and Europe. Additionally, web production subsidiaries are reportedly experiencing a rise in demand for inbound-focused and cross-border e-commerce site development. These peripheral needs could serve as test cases for phased global expansion.
While the current overseas strategy remains at the “functional response” level, the potential for future growth is recognized. Moreover, if growth in the domestic market begins to slow, overseas expansion through M&A or strategic alliances may reemerge as part of the medium- to long-term strategy.
Although international business remains limited at this stage and is not a key factor in the investment conclusion, it can be seen as having significant “option value” for future growth, due to the high portability of its technology and SaaS business model.
6. Long-term performance
Explosive growth track with more than a 14-fold increase in both revenue and profit, the combined effect of the recurring revenue model and M&A strategy.
From FY2021/12 to FY2025/12 (forecast), f-code has achieved remarkable growth in both revenue and profit. Revenue grew from 610 million yen in 2021 to a projected 10.0 billion yen in 2025—approximately 15 times higher. Operating profit is expected to increase from 160 million yen in 2021 to 2.2 billion yen in 2025, nearly 14 times higher. EBITDA is projected to expand at a similar pace, from 160 million yen in 2021 to 2.33 billion yen in 2025. Earnings per share (EPS) are also forecast to rise from 13.40 yen in 2021 to 104.84 yen in 2025, representing a growth of around 7.8 times.
This explosive growth has been driven by a combination of a stable revenue base from recurring SaaS subscriptions, increased customer unit price through cross-selling, and active M&A leading to business domain expansion. While the company initially relied on standalone product revenue, from 2023 onward, it has expanded into peripheral areas such as CRM, UI/UX improvement, ad operations, and engineer training, evolving into a structure that provides comprehensive support for client marketing. The sharp rise in operating profit between 2023 and 2024 is the result of both profit contributions from M&A and the scaling of existing businesses.
EPS temporarily declined to 8.37 yen in 2022 due to IFRS-based retrospective adjustments (e.g., expense recognition for stock-based compensation in unlisted companies), but recovered sharply to 46.47 yen in 2023 and is projected to reach nearly 105 yen in 2025. Although share dilution has progressed during this period, profit growth has more than offset it, resulting in improved per-share value.
The company’s financial base has also steadily strengthened. Total assets, which were slightly below 1.0 billion yen in 2021, are expected to reach approximately 21.8 billion yen by the end of 2024, while maintaining an equity ratio of over 30%. The cumulative operating cash flow over the four years is about 2.9 billion yen, indicating the establishment of internal growth capability without relying on external funding.
Thus, f-code’s long-term performance reflects the successful execution of a multi-pronged growth strategy, including refinement of its recurring revenue model, strategic use of M&A, and enhancement of cash-generating capacity. This already demonstrated growth trajectory strongly supports the company’s future sustainable growth potential and indicates a fundamental strength that can support medium- to long-term holdings for investors.
7. Most recent financial results
Record highs in 1Q. AI and M&A contributing to earnings acceleration, with steady progress toward full-year guidance.
f-code’s 1Q FY2025/12 results (January to March) posted revenue of 2.42 billion yen (YoY +133.4%) and operating profit of 570 million yen (YoY +80.9%), both representing record highs for a single quarter. The operating margin stood at approximately 23.7%, demonstrating the company’s ability to strike a balance between growth and profitability.
Notably, revenue increased about 2.3 times and operating profit about 1.8 times year-on-year. Growth drivers included high contract renewal rates for SaaS products, such as the core “CODE Marketing Cloud,” as well as clear profit contributions from multiple M&A deals completed between late 2024 and early 2025. Specifically, three subsidiaries—SpinFlow (generative AI), Ciel Zero (engineer training), and Smart Contact (inside sales support)—are expected to contribute a combined 360 million yen in operating profit during the fiscal year, and are already showing meaningful earnings impact as of 1Q.
Progress toward full-year targets is also favorable. Against the FY2025/12 guidance of 10.0 billion yen in revenue and 2.2 billion yen in operating profit, 1Q progress reached 24.2% and 26.0%, respectively. For a company with a back-half-weighted revenue structure, this 1Q progress is exceptionally high, and it is commendable that profit levels are being maintained despite new investments in AI development and M&A funding.
The company also conducted a share buyback during the quarter, purchasing 200,000 shares, approximately 1.6% of the total shares outstanding. This buyback is expected to be used for future mergers and acquisitions (M&A) considerations and incentive grants for executives of existing subsidiaries. This reflects a policy stance aimed at simultaneously enhancing capital flexibility, corporate value, and governance.
Financial indicators also show continued soundness: total assets reached 24.5 billion yen (up 13.2% from the previous year-end), and net income attributable to owners of the parent was 320 million yen (YoY +77.6%). Operating cash flow remained positive, sustaining a virtuous cycle of growth, investment, and internal capital generation.
The 1Q FY2025/12 results confirmed that the company’s key growth drivers—SaaS, M&A, and AI—are all functioning smoothly, and there is growing potential for upside to full-year results. For investors, this earnings report represents a significant milestone, indicating that f-code’s earnings structure has already been solidly reinforced.
8. Full-year earnings forecast
Sales of 10.0 billion yen and an operating profit of 2.2 billion yen are planned. The AI and technology domain is emerging as a growth driver.
For FY2025/12, f-code forecasts sales revenue of 10.0 billion yen (YoY +94.9%), operating profit of 2.2 billion yen (YoY +64.6%), and net income attributable to owners of the parent of 1.29 billion yen (YoY +52.4%), continuing the high growth seen in the previous fiscal year. In particular, the company targets an operating margin of 22.0%, aiming to achieve both profit growth and improved profitability.
By business segment, the plan for FY2025 involves growth driven by the two pillars of the “marketing domain” and “AI and technology domain.” On a revenue basis, the marketing domain is expected to generate 5.5 billion yen (comprising 55.0% of the total), and the AI and technology domain 4.5 billion yen (comprising 45.0% of the total), marking a notable structural shift from the prior year. The AI and technology domain, in particular, is expected to see rapid growth of +381.3% YoY, with profit also projected to expand +66.7% YoY.
This is underpinned by the full-scale launch of new products centered on generative AI. Since 2024, SpinFlow has started offering multi-AI integration products, while BUZZ and Ciel Zero have launched engineer training businesses. As a result, ARR (annual recurring revenue) is steadily building across both B2B SaaS and education support services. Consequently, the sales composition ratio of the company’s traditional core product—web engagement and marketing SaaS—has declined relatively, and the business portfolio has become increasingly diversified.
Operating profit progress already reached 26.0% as of 1Q, and given the company’s back-half-weighted earnings structure, the forecast appears reasonably achievable. The contribution to operating profit from M&A had already exceeded expectations by 1Q, and if further M&A is added, upward revisions to the forecast may come into view. In addition, EPS is forecast at 104.84 yen, up approximately 7.8 times from 13.40 yen in 2021 over four years. While the current market valuation—ROE of 20.8%, PER of 20.94x, and PBR of 4.34x—reflects some of this growth potential, it still appears undervalued given the company’s past performance and future growth plan. Considering that the company has steadily delivered double-digit EPS growth while maintaining high ROE, there remains upside potential for the stock price.
That said, growth in the AI and technology domain will also involve upfront investment in hiring and development. If the underlying growth scenario fails to materialize after making such investments, there is a risk of a downside to profits. These risks warrant continued monitoring, especially in terms of second-half earnings progress and new order trends.
Taking the above into account, the full-year forecast for FY2025/12 demonstrates that the company is maintaining its growth momentum while evolving its business portfolio in a non-linear fashion. As long as growth strategies—both M&A and product development—continue to generate earnings, the full-year forecast and the medium-term management plan remain realistically achievable.
9. Growth strategy and risks
Dual strategy of product expansion and M&A. Integration risk and hiring challenges behind rapid expansion.
f-code’s growth strategy centers on two pillars: “evolution of subscription-type products” and “capability expansion through non-linear M&A.” By advancing both the sophistication of marketing support based on SaaS products and business expansion into technology areas (especially AI, engineer development, and sales support), the company aims to increase customer unit price and establish a scalable growth model.
In the SaaS domain, the core “CODE Marketing Cloud” is undergoing functionality enhancements and integration with related products, building a solution suite that provides web engagement, EFO, chatbots, and LINE compatibility in one package. This is enabling a structure in which a single vendor can address multiple marketing challenges. In the AI domain, SpinFlow has launched its generative AI platform “Ai Comp.” offering features such as automatic prompt generation, content optimization, and automated FAQ response—products that go beyond conventional SaaS to support decision-making.
On the other hand, the company is also actively pursuing M&A as a non-linear growth approach. Since 2023, it has acquired over 10 companies covering the entire CX value chain, including UI/UX improvement, social media marketing, engineering education, call centers, and advertising agencies. Notably, businesses that manage client contact points, such as BUZZ and Ciel Zero, are producing high synergies through cross-selling with SaaS products.
However, this rapid expansion carries several risks. First is the risk of post-merger integration (PMI). Differences in organizational culture, operations, and KPI frameworks at acquired companies may impede early profit contributions. Integration of systems and customer data could also result in increased costs or delays.
Second is the challenge of hiring and training talent. The competition for highly skilled personnel in AI-related fields is intensifying, making it essential to invest in human capital—including in-house training. In particular, hiring technical architects, data scientists, and B2B sales talent—all crucial for future growth—must take into account rising hiring costs and retention concerns.
Third is the market environment risk stemming from intensifying product competition. In particular, late entrants continue to appear in the web engagement and chatbot domains, entering a phase where not only functional differentiation but also service differentiation—such as onboarding and operational support—is required. Price competition and increased customer churn could become bottlenecks to business growth.
In response to these risks, the company is also strengthening its organizational systems—for example, by enhancing internal controls, assigning dedicated PMI support teams, and overhauling its management systems. It also maintains flexibility in its capital policy through treasury stock holdings, enabling responsive use for future M&A and incentive planning.
f-code’s growth strategy targets non-linear expansion over the medium to long term. While accepting some short-term earnings volatility, it assumes the maintenance of high ROE and ROIC on a sustained basis. Investors should monitor the timing and materialization of these risks and assess the company’s commitment to the steady execution of its strategy.
10. Stock price trends and valuation
How should the high-growth premium be assessed? Short-term risks are hidden in the gap between market expectations and actual performance.
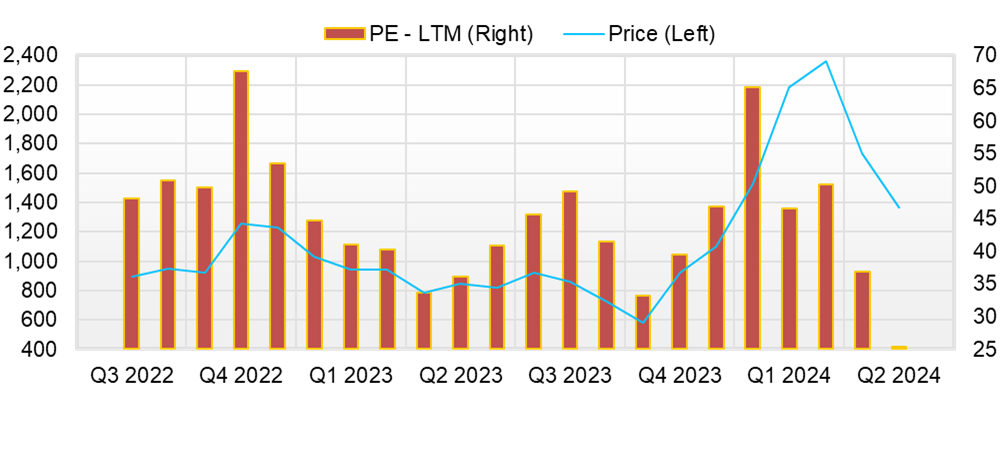
f-code’s stock price entered an upward phase from 2024 onward, reaching 2,273 yen as of July 1, 2025, with a market capitalization of approximately 28.9 billion yen. Its PER (price-to-earnings ratio) is 20.94x and PBR (price-to-book ratio) is 4.34x, which suggests the company is receiving a reasonable premium as a growth stock. ROE stands at a high level of 20.8%, and even from a PEG (Price/Earnings to Growth) standpoint—based on PER × ROE—the valuation appears rational.
The market estimates the company’s EPS growth at around 20% annually, and the current stock price level reflects this high-growth story to some extent. In reality, EPS is expected to increase from 13.40 yen in 2021 to 104.84 yen in 2025, representing a CAGR of +67% and indicating stronger-than-expected earnings growth.
However, one short-term risk commonly seen in “high-ROE × high-PER” stocks is valuation adjustment driven by over-expectation. In particular, the following three factors may trigger short-term stock price corrections:
First, excessive market expectations regarding progress toward full-year results. While 1Q operating profit progress stood at a solid 26.0%, any delay in monetization following large-scale investments from Q2 onward could raise concerns about missing full-year targets. Especially for growth stocks, which are valued based on assumed growth acceleration, any earnings shortfall presents a risk of valuation compression.
Second, limits to financial flexibility for share buybacks or M&A funding. While the market purchase of 200,000 treasury shares (approx. 350 million yen) in spring 2025 contributed to improved capital efficiency and future M&A readiness, continued growth investment will require either additional fundraising or further acceleration in profit growth. If these are delayed, stock price momentum could weaken.
Third, the risk of weakened product differentiation amid changing competitive environments. In areas like web engagement, chatbots, and AI content generation, new SaaS players are emerging rapidly, with intensified competition from overseas vendors in particular. While the company’s strengths lie in its “cross-selling model” and “consulting capabilities,” the risk of being caught in price competition on a feature basis remains.
Furthermore, the PBR of 4.34x reflects high capital efficiency, assuming that the ROE remains elevated. Should ROE fall significantly from the 20% range, PBR could shrink to 2–3x, leading to a more pronounced stock price correction.
On the other hand, current earnings growth and cash generation are backed by real performance. The earnings yield based on actual EPS is in the 4.8–5.0% range, which is acceptable for a growth stock. Although the company does not pay dividends, it is directing most of its capital toward growth investments, making it well-suited for investors seeking growth opportunities.
Overall, f-code’s stock price currently benefits from a premium based on high growth and profitability, but at the same time, the market requires this level to be sustained. Investors are now entering a phase where they must also observe qualitative factors such as product competitiveness and M&A effectiveness, in addition to tracking quantitative performance progress.
11. Investment conclusion based on performance and valuation
Quantitative growth and strategic consistency justify medium- to long-term growth expectations. Even at a valuation reflecting some future growth, investment appeal remains present, and investment preference can be fully maintained.
f-code has established a strong position in digital marketing support, centered on its subscription-based SaaS, “CODE Marketing Cloud.” Since 2023, it has diversified its revenue base through M&A-driven expansion into adjacent areas, including UI/UX, SEO, CRM, and AI, as well as the launch of generative AI products. As a result, both sales and operating profit are projected to grow approximately 15 times and 14 times, respectively, from 2021 to 2025, placing the company on a standout growth track—this is a core element in the investment conclusion.
Recent performance has been progressing faster than market expectations. In 1Q of FY2025/12, the company posted an operating profit of 572 million yen with a progress rate of 26.0%, a high level for f-code given its back-loaded earnings structure. With several acquired subsidiaries already contributing to profits, and customer unit prices expected to continue rising through the cross-selling of products, there remains considerable room for earnings upside.
Meanwhile, valuation remains high with a PER of 20.94x and PBR of 4.34x, reflecting the market’s view of the company as one that can maintain ROE above 20% and grow EPS at +20% annually. In such a valuation that prices in future growth assumptions, the stock becomes sensitive to short-term underperformance or intensifying competition. From a risk management perspective, investors should monitor earnings seasonality, lead times for new investments, and the sustainability of product differentiation.
Nonetheless, the earnings yield based on current EPS is around 5.0%, offering a reasonable profit buffer for a growth company. The company’s financial health is solid, with accumulating operating cash flow. Its capital policy, including treasury stock buybacks, also provides strategic flexibility for future M&A and incentive planning, supporting the investment case.
Moreover, the rapid growth in the AI and technology domain could drive further EPS increases. If the strategic shift from conventional SaaS to “generative AI × marketing” proves successful, the potential for valuation expansion cannot be dismissed.
At present, f-code represents a high-quality small- to mid-cap growth stock with “proven high growth × multi-faceted strategic execution × high capital efficiency.” While some future growth is already factored into the valuation, the current strong performance justifies it, and it cannot be considered excessively expensive. For investors focused on medium- to long-term growth sustainability, taking a position now remains a rational and strategic option. While caution is warranted toward short-term volatility, the company is a rare growth name capable of balancing “quality of earnings” and “strategic flexibility.” It can play a central role as a growth engine within an investment portfolio.
12. ROE trends and current assessment
Improvement in capital efficiency signals a shift in earnings structure. Examining the capability and sustainability of maintaining ROE above 20%.
f-code has significantly improved its return on equity (ROE) in a short period since its IPO, reaching a high level of 20.8% in FY2024/12. This reflects not only an increase in profit levels but also efficient earnings generation relative to equity capital, making it a crucial quantitative indicator in assessing the company as a growth stock.
Looking at past ROE trends, FY2021/12 marked the early stage of profitability, with EPS at 13.40 yen and ROE likely below 10%. After experiencing a temporary decline in FY2022/12 (EPS 8.73 yen), EPS recovered sharply to 46.47 yen in FY2023/12, and ROE jumped to the high teens. Ultimately, ROE reached 20.8% in FY2024/12, confirming a significant improvement in capital efficiency that accompanied the company’s growth.
This level of ROE ranks among the highest, even compared to other SaaS companies listed on the Tokyo Stock Exchange Growth Market, standing out against the market average of approximately 8–12%. Notably, of the three components of ROE, net profit margin, total asset turnover, and financial leverage, net profit margin has contributed the most, suggesting that the company has established a “genuine ROE” that is not reliant on leverage. This is a crucial consideration when evaluating the sustainability of ROE.
Specifically, the operating margin in FY2024/12 was 27.8%, and the equity ratio was approximately 33.0%, indicating that an ROE above 20% was achieved without excessive debt or leverage. Operating cash flow is also solid, and the alignment between CF margin and ROE is being maintained.
In market assessments, companies that stably maintain ROE in the 20% range are typically assigned a PBR of 3 to 5x. f-code’s current PBR is 4.34x, which indicates a certain level of market confidence in the sustainability of its ROE and EPS growth.
Key points to watch going forward include the possibility of ROE dilution from capital increases or share issuance for mergers and acquisitions, as well as the potential impact of temporary investment or integration costs on profit levels. However, current profit growth appears sufficient to absorb these risks, and the downside risk to ROE is considered limited.
f-code’s ROE is at an unusually high and stable level for a company at its growth stage and serves as a core quantitative foundation for its valuation. Whether the company can continue to maintain ROE above 20% will depend on its ability to sustain product competitiveness and the effectiveness of group-wide PMI, which should be monitored closely from an investment standpoint.
13. Analysis of economic value creation based on ROIC and WACC
An improved ROIC indicates expanding economic value creation by delivering returns that exceed capital costs.
f-code, Inc. has simultaneously improved profitability and capital efficiency, with its return on invested capital (ROIC) steadily rising. The ROIC for FY2024/12 was 4.6%, which does not yet significantly exceed the weighted average cost of capital (WACC). However, examining the ROIC trend since FY2021/12 and its underlying components reveals that the company’s ability to create economic value is strengthening.
ROIC is calculated as “NOPAT (net operating profit after tax) ÷ invested capital (interest-bearing debt + shareholders’ equity – non-operating assets).” For f-code, the increase in operating assets stems primarily from M&A and investment in SaaS product development, and the key question is whether the company can consistently generate returns exceeding its capital cost. ROIC was around 3.2% in FY2023/12 and rose to 4.6% in FY2024/12, driven by improved operating margins and asset efficiency.
The operating margin rose significantly from 12.5% in FY2023/12 to 27.8% in FY2024/12, contributing substantially to the improvement in ROIC. Even as M&A activity expanded the number of consolidated subsidiaries, capital efficiency has not deteriorated, indicating effective PMI execution and strong financial governance.
WACC is estimated to be around 7.0–8.0% for a listed SaaS company with a relatively high cost of equity. With the current ROIC at 4.6%, economic value added (EVA) is still in negative territory. However, with operating profit projected at 2.2 billion yen in FY2025/12 and 5.0 billion yen in FY2027/12, it is realistic to expect ROIC to rise into the 6–8% range if such growth is achieved.
Notably, SaaS businesses typically enter a “harvest phase” once initial investment is recouped, with marginal costs declining and ROIC improving sharply. f-code appears to be entering this phase in FY2023–24, and as depreciation finishes, free cash flow is expected to surge, shifting the structure toward one in which ROIC stably exceeds WACC.
From the perspective of M&A strategy alignment, the company is entering a phase where quick profit contribution relative to invested capital is expected. The speed of PMI and improvement in subsidiary profit margins will be key to further ROIC enhancement.
Thus, while ROIC has not yet significantly exceeded capital costs, multiple factors—including a stronger profit structure, returns on growth investments, and the realization of integration effects—are falling into place. Full-fledged economic value creation through ROIC outperformance is expected in the future. From a medium- to long-term perspective, firmly establishing ROIC above WACC will be a decisive driver of corporate value growth.
14. Corporate value creation from the perspective of free cash flow and capital allocation
From a self-funded growth model supported by earnings, the company is entering an expansion phase where cash flow quality is key.
f-code, Inc. has steadily increased its free cash flow (FCF) generation through earnings growth, establishing a structure to fund capital allocation from internal resources. Operating cash flow for FY2024/12 reached a record 910 million yen. Even after accounting for capital expenditures, development costs, and M&A outlays, the company secured positive free cash flow, thereby increasing market confidence in its ability to generate cash.
What stands out is the consistency between operating profit and cash flow. Since FY2023/12, while operating profit has surged, depreciation and goodwill amortization have kept pace, steadily improving cash margins. This suggests that the company has entered the “harvest phase” typical of SaaS models, where rising marginal profit margins, due to relatively fixed sales and general administrative (SG&A) and development costs, lead directly to cash generation.
Investment cash flow has involved significant outflows centered on M&A, exceeding 1.0 billion yen in FY2024/12. These outlays were driven by acquisitions such as SpinFlow and Smart Contact, representing strategic investments in high-growth fields. Importantly, these acquisitions are premised on improving profitability through integration with existing SaaS operations, rather than solely on expected synergies.
The capital allocation policy includes a shareholder-friendly measure of share buybacks (200,000 shares, approximately 350 million yen, scheduled for spring 2025), with a portion of the funds allocated to improving capital efficiency. This share buyback program is intended to be implemented in parallel with growth investments, and will also be utilized for optimizing the capital structure and future incentive programs (such as stock options), demonstrating a commitment to balancing corporate value enhancement and shareholder returns.
The company’s financial health remains sound, with a net cash position, while allocating funds across growth investments, M&A, and share buybacks. Leverage is relatively low, with an equity ratio of around 33.0% as of FY2024/12. Even in the event of a large-scale M&A, the company possesses flexible financing options—internal reserves, equity issuance, and retained earnings—thereby enhancing its strategic optionality.
In summary, f-code’s free cash flow generation is a result of entering the SaaS “harvest phase” and successful PMI outcomes. As long as cash flow remains solid, the company can sustain both capital allocation flexibility and value creation capability. For investors, alignment between earnings and cash, strategic use of funds, and a well-balanced financial policy form the foundation of the company’s long-term appeal.
15. Outlook for shareholder return policy and assessment of past initiatives
A no-dividend policy is appropriate for a high-growth stage. Capital efficiency improved through treasury share buybacks.
f-code, Inc. currently does not pay dividends. This reflects a capital policy that prioritizes continued growth investments in the SaaS and AI domains, as well as non-linear business expansion through M&A. In other words, the company is at a stage where internal reserves are being reinvested for growth rather than returned to shareholders.
However, in spring 2025, the company implemented a capital policy involving treasury share buybacks. Specifically, it repurchased 40,000 shares in March 2025 and an additional 160,000 shares from April to May 2025, totaling 200,000 shares (about 1.6% of total outstanding shares) for approximately 350 million yen. These buybacks were aimed at (1) improving capital efficiency, (2) preparing for future M&A consideration, and (3) offering stock incentives to management. Although different from a direct dividend policy, this move shows a clear commitment to enhancing shareholder value.
From a medium- to long-term perspective, shareholder return capacity is steadily expanding in line with improving cash flow. Operating cash flow in FY2024/12 was 910 million yen, and is expected to exceed 1.0 billion yen in FY2025/12. With an equity ratio above 33% and a net cash position resulting from debt-free management, the company is increasingly well-positioned to implement dividends or continued buybacks as realistic options.
That said, the company is currently being valued by the market as a “high-growth stage” business. Excessive shareholder returns could damage value by diverting capital away from essential investments, especially in a competitive environment for generative AI, new SaaS development, and top-tier engineering and sales talent. Under such conditions, full utilization of internal funds remains strategically appropriate.
Accordingly, the company’s shareholder return policy at this stage is centered on “no dividends + use of treasury shares” to manage capital efficiency. However, as growth milestones are reached—such as achieving a certain level of sales and profit, or completing an M&A activity—a phased shift toward dividend implementation may be considered. The company has not avoided addressing this topic in its IR materials, suggesting it is maintaining a flexible stance.
In conclusion, f-code’s shareholder return policy can be described as a “strategic no-dividend model prioritizing clear growth drivers.” Full-fledged returns will likely be implemented only after long-term value creation has been firmly established. For investors, the focus should be on qualitative improvements in ROE and free cash flow, rather than the presence or absence of dividend payouts.
16. Corporate valuation (DCF and PER/PBR analysis)
The market assigns a premium to a high-ROE growth model. DCF is conservative, while multiples align with theoretical levels.
Current valuation of f-code, Inc. can be effectively analyzed from multiple perspectives (such as PER and PBR) and the discounted cash flow (DCF) methodology. As of July 1, 2025, the company’s forecast PER stands at 20.94x and its actual PBR at 4.34x, with ROE at a high level of 20.8%. Based on the theoretical PBR derived from the PER × ROE relationship—assuming a cost of equity of 8%—the result would be about 2.6x. However, factoring in growth and market premium, the current level in the 4x range is sufficiently justifiable.
A PER of 20.94x is in line with companies expected to grow EPS at over 20% annually, and appears reasonable even under PEG (PER/EPS growth rate) standards. The company’s EPS is forecast to rise from 13.40 yen in FY2021/12 to 104.84 yen in FY2025/12, implying a compound annual growth rate (CAGR) of +67%. This expansion in EPS based on actual results is a key reason why investors regard the current multiples as justified.
On the other hand, a theoretical valuation based on the DCF method, using current cash flow trends, growth assumptions, and the cost of capital (WACC), may yield a somewhat conservative estimate. For instance, assuming a WACC of 7.5%, with post-FY2025/12 operating cash flows (i.e., free cash flow) increasing in the range of 1.0 to 1.5 billion yen, FCF growth of 5%, and a terminal growth rate of 2.0%, the implied enterprise value would fall in the range of 24–26 billion yen. While this is slightly below the current market capitalization of 28.9 billion yen, the gap likely reflects higher market growth expectations (e.g., 10%+), the fact that DCF does not fully capture non-linear growth through M&A, and that portfolio evolution toward AI, education, and B2B sales is priced into the market but not the DCF model.
Thus, while the DCF method provides a conservative valuation based on current cash flows and moderate assumptions, the multiple-based approach better reflects market expectations of future profit levels. For a company like f-code, Inc.—in a phase of rapidly expanding EPS and ROE—the multiple method typically aligns more closely with market price.
While f-code’s stock may appear slightly overvalued based on DCF, it receives fair valuation in terms of PER and PBR for a growth stock. The continued expansion of EPS and sustained high ROE, along with early monetization in the AI/Technology segment, are essential conditions supporting the validity of its valuation.
17. Peer multiple comparison analysis
Strong profitability and capital efficiency within the marketing SaaS sector. Evaluating relative position through quantitative comparison.
f-code, Inc.’s current valuation levels are underpinned by its standout profitability and capital efficiency within the marketing SaaS industry. The company’s forecast PER is 20.94x, PBR is 4.34x, ROE is 20.8%, and operating margin is 27.8%. These three elements, high profitability, high ROE, and sustained profitability, form the basis for its premium evaluation in the market.
In comparison, User Local (3984) shows a forecast PER of 22.50x, PBR of 3.46x, ROE of 16.9%, and a high operating margin of 44.2%. While it maintains stable profitability, its capital efficiency slightly lags behind f-code. HENNGE (4475) posts a forecast PER of 40.58x, PBR of 14.74x, and ROE of 31.1%, suggesting strong capital efficiency and high growth expectations. However, its operating margin remains around 12%, which underscores f-code’s advantage in profitability. CyberBuzz (7069) appears undervalued with a PER of 10.06x and PBR of 11.35x, but suffers from a negative ROE of -167%, indicating instability in earnings. PLAID (4165) has a PER of 49.72x, a PBR of 11.38x, and an ROE of 11.2%, reflecting high expectations for growth, although it trails the f-code in terms of profitability and capital efficiency.
From this comparison, it becomes clear that f-code currently occupies a rare position as a “highly profitable growth company” that secures stable profits while achieving an operating margin of 27.8% and ROE of 20.8%. While other companies are assigned high PER and PBR multiples based on growth potential, many face challenges in earnings stability and capital efficiency.
In summary, while f-code’s current PER of 20.94x and PBR of 4.34x may seem relatively high in isolation, they are entirely justifiable when considered in the context of its growth, profitability, and earnings stability. Going forward, progress in monetizing the AI/Technology segment and the realization of PMI effects from M&A deals will likely determine whether these multiples can be sustained, or even revised upward.
| Company name | Securities code | PER (forecast) | PBR (actual) | ROE (actual) | OP margin(actual) |
| F-CODE | 9211 | 20.94X | 4.34X | 20.8% | 27.8% |
| User Local | 3984 | 22.50X | 3.46X | 16.9% | 44.2% |
| HENNGE | 4475 | 40.58X | 14.74X | 31.1% | 12.1% |
| CyberBuzz | 7069 | 10.06X | 11.35X | -167% | ― |
| PLAID | 4165 | 49.72X | 11.38X | 11.2% | 2.4% |
Key stock price data
Key financial data
| Unit: million yen | 2021 | 2022 | 2023 | 2024 | 2025CE |
| Sales | 661 | 1,072 | 2,482 | 5,131 | 10,000 |
| EBIT (Operating Income) | 160 | 138 | 638 | 1,149 | |
| Pretax Income | 150 | 124 | 605 | 1,323 | 2,033 |
| Net Profit Attributable to Owner of Parent | 152 | 69 | 480 | 906 | 1,285 |
| Cash & Short-Term Investments | 602 | 978 | 4,040 | 6,236 | |
| Total assets | 843 | 3,281 | 10,975 | 21,825 | |
| Total Debt | 178 | 1,961 | 5,721 | 7,527 | |
| Net Debt | -424 | 983 | 1,681 | 1,291 | |
| Total liabilities | 351 | 2,592 | 7,655 | 15,720 | |
| Total Shareholders’ Equity | 492 | 690 | 3,187 | 6,728 | |
| Net Operating Cash Flow | 103 | 121 | 878 | 916 | |
| Capital Expenditure | 24 | 35 | 46 | 99 | |
| Net Investing Cash Flow | -16 | -1,441 | -3,404 | -2,881 | |
| Net Financing Cash Flow | 189 | 1,695 | 5,586 | 4,158 | |
| Free Cash Flow | 100 | 97 | 860 | 911 | |
| ROA (%) | 22.37 | 3.36 | 6.73 | 5.52 | |
| ROE (%) | 55.52 | 11.74 | 24.75 | 18.27 | |
| EPS (Yen) | 18.6 | 8.4 | 23.2 | 77.9 | 104.8 |
| BPS (Yen) | 60.0 | 83.2 | 302.2 | 548.8 | |
| Dividend per Share (Yen) | 0.00 | 0.00 | 0.00 | 0.00 | 0.00 |
| Shares Outstanding (Million shares) | 8.20 | 8.29 | 10.55 | 12.17 |
Share price
Financial data (quarterly basis)
| Unit: million yen | 2023/12 | 2024/12 | 2025/12 | ||||||
| 1Q | 2Q | 3Q | 4Q | 1Q | 2Q | 3Q | 4Q | 1Q | |
| (Income Statement) | |||||||||
| Sales | 385 | 479 | 716 | 902 | 1,035 | 1,002 | 1,040 | 2,053 | 2,417 |
| Year-on-year | 68.2% | 78.2% | 135.5% | 234.1% | 168.7% | 109.3% | 45.2% | 127.7% | 133.4% |
| Cost of Goods Sold (COGS) | 152 | 168 | 292 | 423 | 401 | 436 | 429 | 1,050 | 808 |
| Gross Income | 234 | 311 | 424 | 479 | 635 | 567 | 611 | 1,003 | 1,608 |
| Gross Income Margin | 60.6% | 65.0% | 59.2% | 53.1% | 61.3% | 56.5% | 58.8% | 48.9% | 66.6% |
| SG&A Expense | 122 | 202 | 237 | 250 | 320 | 331 | 299 | 737 | 1,185 |
| EBIT (Operating Income) | 112 | 110 | 187 | 229 | 315 | 235 | 312 | 266 | 423 |
| Year-on-year | 78.1% | 55.2% | 378.9% | 1675.9% | 181.1% | 114.4% | 66.7% | 16.1% | 34.5% |
| Operating Income Margin | 29.0% | 22.9% | 26.2% | 25.4% | 30.4% | 23.5% | 30.0% | 13.0% | 17.5% |
| EBITDA | 126 | 127 | 205 | 252 | 356 | 257 | 333 | 292 | 460 |
| Pretax Income | 108 | 103 | 179 | 215 | 296 | 280 | 344 | 383 | 541 |
| Consolidated Net Income | 75 | 63 | 144 | 197 | 191 | 181 | 222 | 327 | 352 |
| Minority Interest | 0 | 0 | -0 | -0 | 8 | 4 | 2 | 15 | 28 |
| Net Income ATOP | 75 | 63 | 144 | 198 | 183 | 177 | 220 | 313 | 325 |
| Year-on-year | 15.5% | 42.0% | 654.1% | 3095.2% | 144.6% | 179.8% | 52.8% | 58.1% | 77.6% |
| Net Income Margin | 19.4% | 13.2% | 20.1% | 21.9% | 17.7% | 17.6% | 21.2% | 15.2% | 13.4% |
| (Balance Sheet) | |||||||||
| Cash & Short-Term Investments | 2,898 | 4,137 | 3,887 | 4,040 | 4,937 | 7,233 | 7,021 | 6,236 | 4,969 |
| Total assets | 5,186 | 7,187 | 10,552 | 10,975 | 14,588 | 17,973 | 17,629 | 21,825 | 24,553 |
| Total Debt | 2,123 | 3,987 | 5,649 | 5,721 | 8,430 | 8,484 | 7,988 | 7,527 | 9,155 |
| Net Debt | -775 | -150 | 1,762 | 1,681 | 3,493 | 1,251 | 967 | 1,291 | 4,187 |
| Total liabilities | 2,411 | 4,382 | 7,437 | 7,655 | 10,980 | 12,424 | 11,803 | 15,720 | 18,607 |
| Total Sharehjolders’ Equity | 2,775 | 2,805 | 2,981 | 3,187 | 3,408 | 5,988 | 6,277 | 6,728 | 6,619 |
| (Profitability %) | |||||||||
| ROA | 4.63 | 3.85 | 4.67 | 6.73 | 5.94 | 5.58 | 5.52 | 5.44 | 5.28 |
| ROE | 8.56 | 9.46 | 15.61 | 24.75 | 19.01 | 15.95 | 16.79 | 18.00 | 20.63 |
| (Per-share) Unit: JPY | |||||||||
| EPS | 3.8 | 3.0 | 6.9 | 9.4 | 17.3 | 15.2 | 18.2 | 25.5 | 26.4 |
| BPS | 264.6 | 267.5 | 283.5 | 302.2 | 282.1 | 494.5 | 518.3 | 548.8 | 536.8 |
| Dividend per Share | 0.00 | 0.00 | 0.00 | 0.00 | 0.00 | 0.00 | 0.00 | 0.00 | 0.00 |
| Shares Outstanding (milion shares) | 10.47 | 10.49 | 10.49 | 10.55 | 10.61 | 12.11 | 12.11 | 12.17 | 12.35 |
Source: Omega Investment from company materials
Financial data (full-year basis)
| Unit: million yen | 2021 | 2022 | 2023 | 2024 |
| (Income Statement) | ||||
| Sales | 661 | 1,072 | 2,482 | 5,131 |
| Year-on-year | 24.3% | 62.3% | 131.5% | 106.7% |
| Cost of Goods Sold | 258 | 479 | 1,084 | 2,379 |
| Gross Income | 403 | 593 | 1,398 | 2,752 |
| Gross Income Margin | 61.0% | 55.3% | 56.3% | 53.6% |
| SG&A Expense | 242 | 455 | 759 | 1,603 |
| EBIT (Operating Income) | 160 | 138 | 638 | 1,149 |
| Year-on-year | 407.6% | -13.9% | 362.0% | 80.0% |
| Operating Income Margin | 24.3% | 12.9% | 25.7% | 22.4% |
| EBITDA | 164 | 172 | 711 | 1,238 |
| Pretax Income | 150 | 124 | 605 | 1,323 |
| Consolidated Net Income | 152 | 69 | 479 | 934 |
| Minority Interest | 0 | 0 | 0 | 28 |
| Net Income ATOP | 152 | 69 | 480 | 906 |
| Year-on-year | 275.3% | -54.5% | 591.7% | 88.8% |
| Net Income Margin | 23.1% | 6.5% | 19.3% | 17.7% |
| (Balance Sheet) | ||||
| Cash & Short-Term Investments | 602 | 978 | 4,040 | 6,236 |
| Total assets | 843 | 3,281 | 10,975 | 21,825 |
| Total Debt | 178 | 1,961 | 5,721 | 7,527 |
| Net Debt | -424 | 983 | 1,681 | 1,291 |
| Total liabilities | 351 | 2,592 | 7,655 | 15,720 |
| Total Shareholders’ Equity | 492 | 690 | 3,187 | 6,728 |
| (Cash Flow) | ||||
| Net Operating Cash Flow | 103 | 121 | 878 | 916 |
| Capital Expenditure | 24 | 35 | 46 | 99 |
| Net Investing Cash Flow | -16 | -1,441 | -3,404 | -2,881 |
| Net Financing Cash Flow | 189 | 1,695 | 5,586 | 4,158 |
| Free Cash Flow | 100 | 97 | 860 | 911 |
| (Profitability ) | ||||
| ROA (%) | 22.37 | 3.36 | 6.73 | 5.52 |
| ROE (%) | 55.52 | 11.74 | 24.75 | 18.27 |
| Net Margin (%) | 23.06 | 6.47 | 19.33 | 17.65 |
| Asset Turn | 0.97 | 0.52 | 0.35 | 0.31 |
| Assets/Equity | 2.48 | 3.49 | 3.68 | 3.31 |
| (Per-share) Unit: JPY | ||||
| EPS | 18.6 | 8.4 | 23.2 | 77.9 |
| BPS | 60.0 | 83.2 | 302.2 | 548.8 |
| Dividend per Share | 0.00 | 0.00 | 0.00 | 0.00 |
| Shares Outstanding (million shares) | 8.20 | 8.29 | 10.55 | 12.17 |
Source: Omega Investment from company materials