2026-04-10
Home
Japanese

Omega Investment Co., Ltd.
Hamee (Company note – Q1 update)

| Share price (10/16) | ¥1,265 | Dividend Yield (26/4 CE) | 1.8 % |
| 52weeks high/low | ¥905/1,519 | ROE(25/4) | 12.4 % |
| Avg Vol (3 month) | 64 thou shrs | Operating margin (25/4) | 10.3 % |
| Market Cap | ¥20.7 bn | Beta (5Y Monthly) | 0.9 |
| Enterprise Value | ¥19.8 bn | Shares Outstanding | 16.3 mn shrs |
| PER (26/4 CE) | 14.2 X | Listed market | TSE Standard |
| PBR (25/4 act) | 2.0 X |
| Click here for the PDF version of this page |
| PDF version |
Q1 FY04/2026 was broadly in line with expectations. The share distribution-type spin-off and listing of NE Inc. have been announced, drawing heightened attention to the share price.
◇ Summary:
Although the Q1 FY04/2026 results were higher sales and lower earnings, they were broadly in line with expectations. As many expenses are front-loaded and profits are expected to be recouped in the busy season, the impact on the share price should be limited.
The primary focus going forward is the share-distribution-type spin-off and listing on the TSE Growth Market of NE Inc., which is responsible for the Platform Segment. The planned listing date is November 4, 2025. Attention is focused on whether the share price will discount the sum of the values of the two businesses (the sum-of-the-parts approach) and move toward eliminating the conglomerate discount.
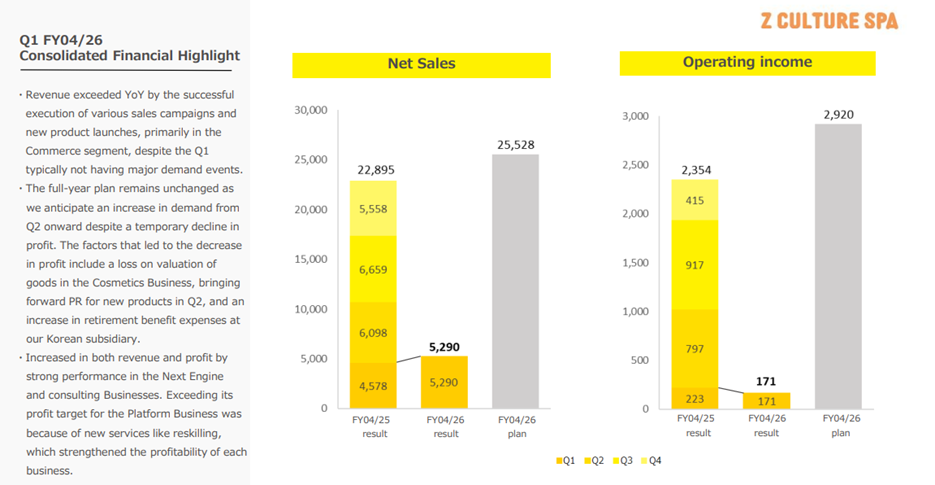
◇ Q1 FY04/2026 results highlights: higher sales and lower earnings, but in line with expectations
The Q1 FY04/2026 results announced by Hamee (hereinafter, the Company) on September 12, 2025, were higher sales and lower earnings YoY. Net sales were JPY5.29 billion (up 15.5% YoY), operating profit was JPY170 million (down 23.4% YoY), ordinary profit was JPY90 million (down 51.7% YoY), and quarterly net income attributable to owners of the parent was JPY20 million (down 74.6% YoY). Progress rates relative to the full-year forecast were 20.7% for net sales and 5.9% for operating profit.
However, given that the first quarter is the off-season, that progress appears broadly in line with the Company’s assumptions, and that the busy season lies ahead from the second quarter onward, the impact on the share price is considered limited. The inventory level has not changed materially from the end of April.
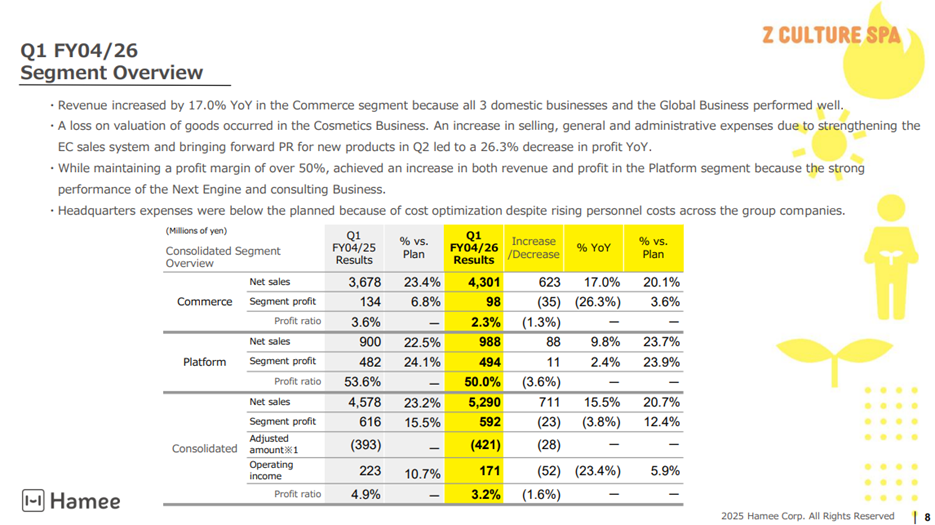
By segment, the Commerce Segment posted higher sales and lower earnings, while the Platform Segment posted higher sales and higher earnings.
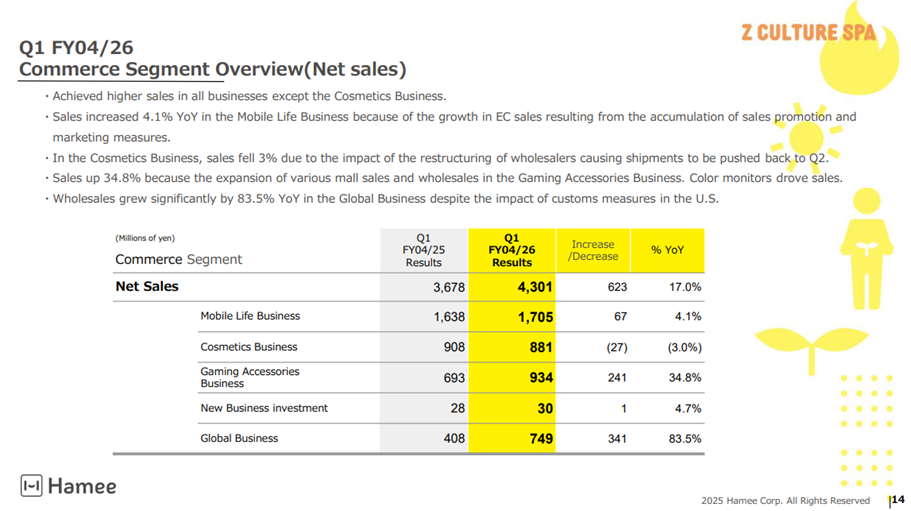
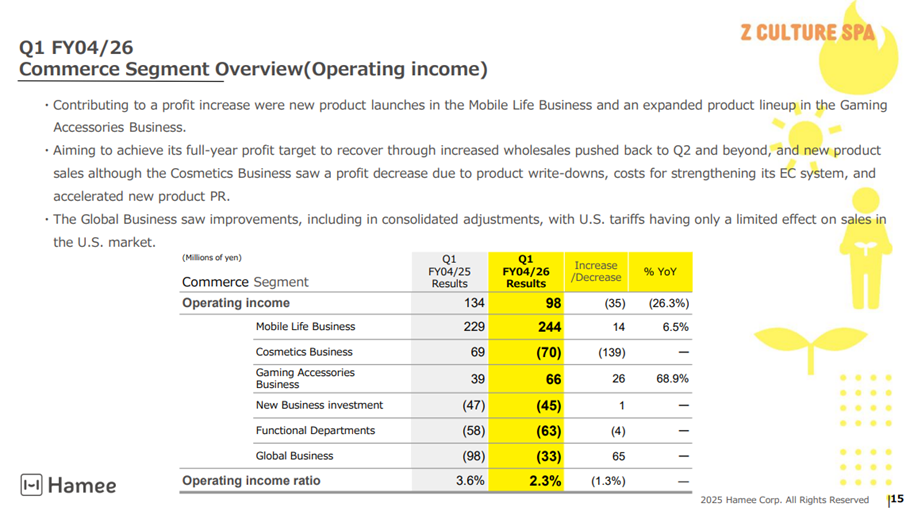
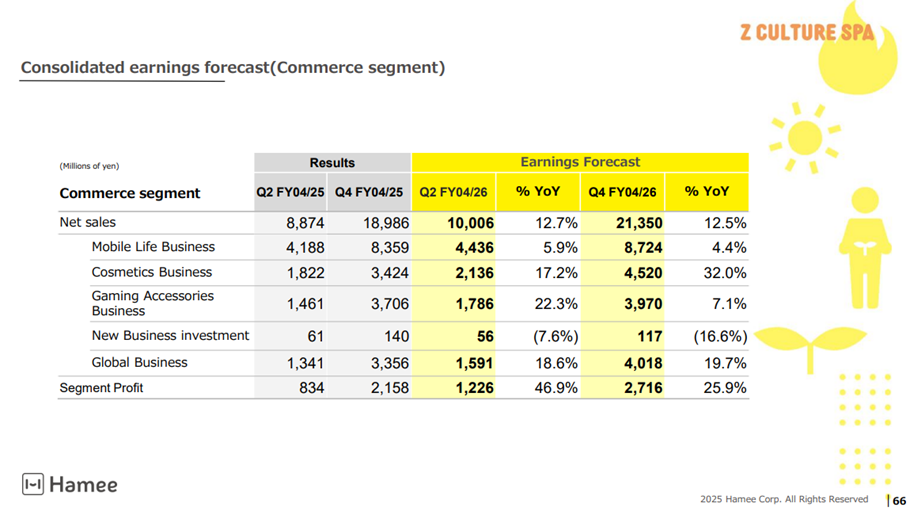
Commerce Segment details:
Net sales were JPY4.30 billion (up 17.0% YoY), and segment profit was JPY90 million (down 26.3% YoY). Progress rates relative to the full-year forecast were 20.1% for net sales and 3.6% for segment profit.
- Net sales: All businesses except the Cosmetics Business recorded higher sales. The sales decline in the Cosmetics Business was primarily due to shipment timing differences resulting from changes in wholesalers to expand sales channels.
- Segment profit: Profits increased/improved in the Mobile Life, Gaming Accessories, and Global businesses. Meanwhile, the Cosmetics Business reported a loss of JPY70 million due to the recognition of valuation losses on certain products, costs to strengthen the e-commerce sales structure, and front-loaded expenses for the PR of new products. The Company has already implemented measures to prevent recurrence of valuation losses, including small-lot ordering.
- Summary: The business portfolio is being operated in a well-balanced manner, and it can be observed that product strategies and the strengthening of sales channels, leveraging the characteristics of each business, are being carried out appropriately.
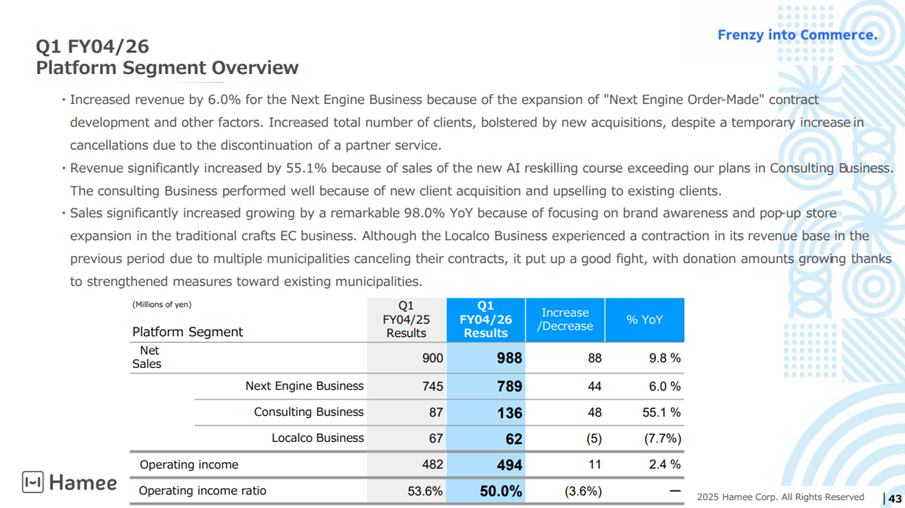
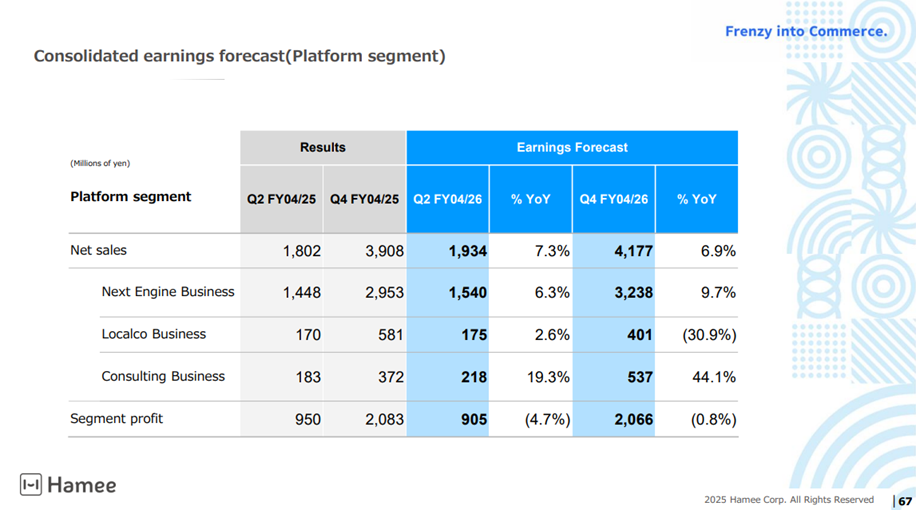
Platform Segment details:
Net sales were JPY980 million (up 9.8%), and segment profit was JPY490 million (up 2.4%), achieving steady growth while maintaining a high profit margin. Progress rates relative to the full-year forecast were 23.7% for net sales and 23.9% for segment profit.
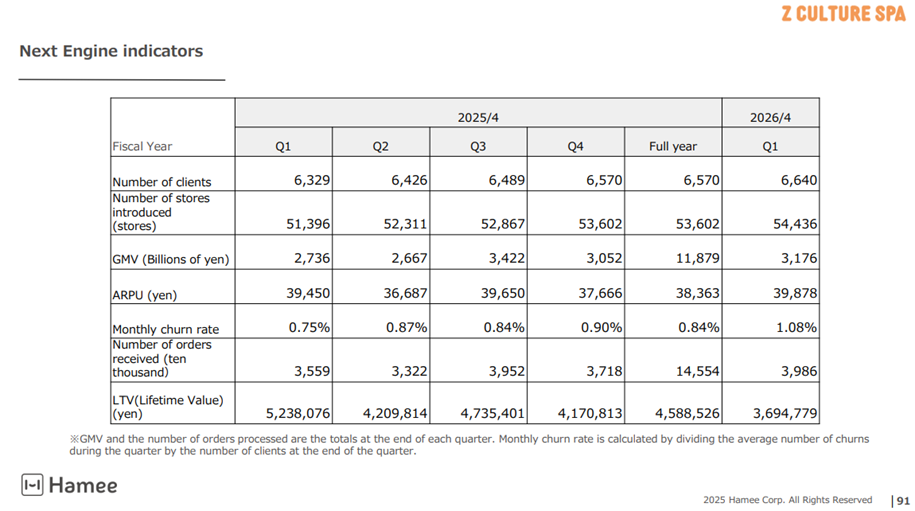
In the core NextEngine business, despite an increase in cancellations due to the service suspension of an external shipping system partnered with NextEngine, the Company achieved a 4.9% increase in the total number of contracted companies, a 16.1% increase in GMV, an 11.9% increase in the number of processed orders, and a 1.1% increase in ARPU. New offerings such as “NextEngine Order-Made” and the consulting business’s “AI Reskilling Course” have also begun to be launched.
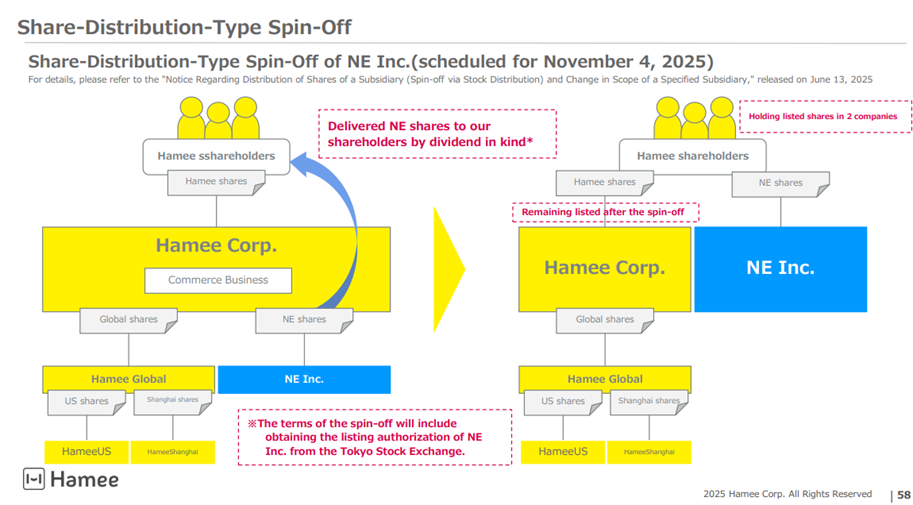
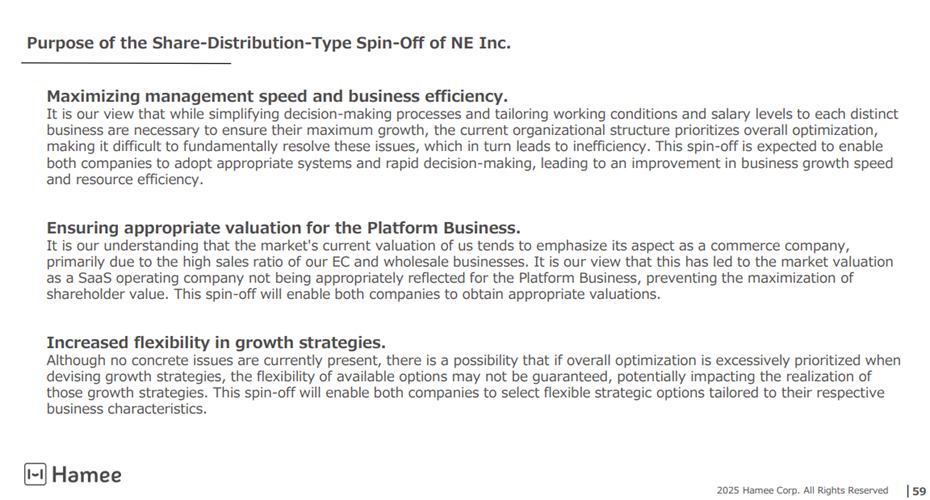
◇ Spin-off and listing of NE Inc.: to be listed on the TSE Growth Market on November 4, 2025
On September 30, 2025, the listing of NE Inc., which is responsible for the Company’s Platform Segment, on the TSE Growth Market was approved. The scheduled listing date is November 4, 2025; the industry classification is Information & Communications; and the securities code is 441A.
In connection with the listing, the issuance of 500,000 new shares through a public offering and a secondary offering of 75,000 shares through an over-allotment are envisaged. As a result, the number of shares issued at the time of listing will be 16,501 thousand shares.
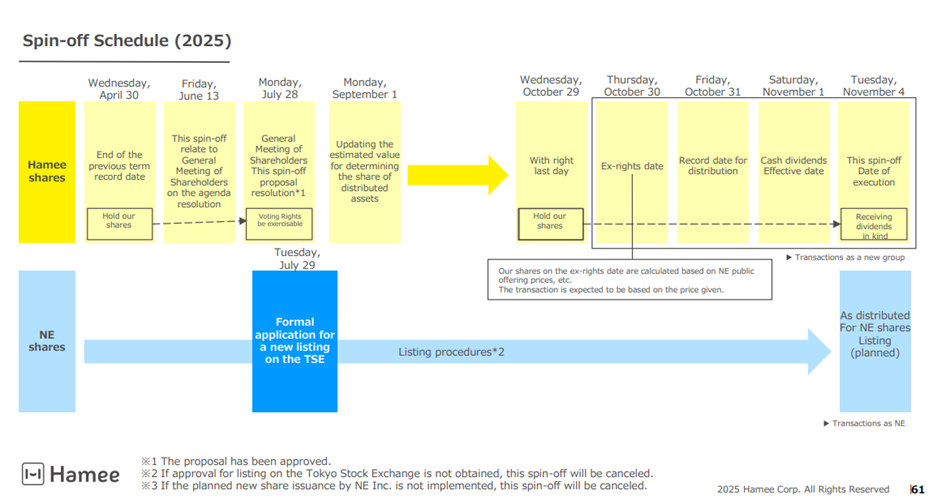
The key schedule is as follows.
NE Inc. provisional conditions for the public offering determined: Oct. 15, 2025
NE Inc. book-building period for the public offering: Oct. 17, 2025 – Oct. 23, 2025
NE Inc. public offering price determined: Oct. 24, 2025
NE Inc. subscription period for the public offering: Oct. 27, 2025 – Oct. 30, 2025
Hamee’s final day with shareholder rights: Oct. 29, 2025
Hamee ex-rights date: Oct. 30, 2025
Record date for distribution in kind of NE Inc. shares to Hamee shareholders: Oct. 31, 2025
Effective date of dividend in kind of NE Inc. shares to Hamee shareholders: Nov. 1, 2025
NE Inc. payment date for the public offering: Nov. 1, 2025
NE Inc. delivery date for the public offering: Nov. 4, 2025
NE Inc. listing: Nov. 4, 2025
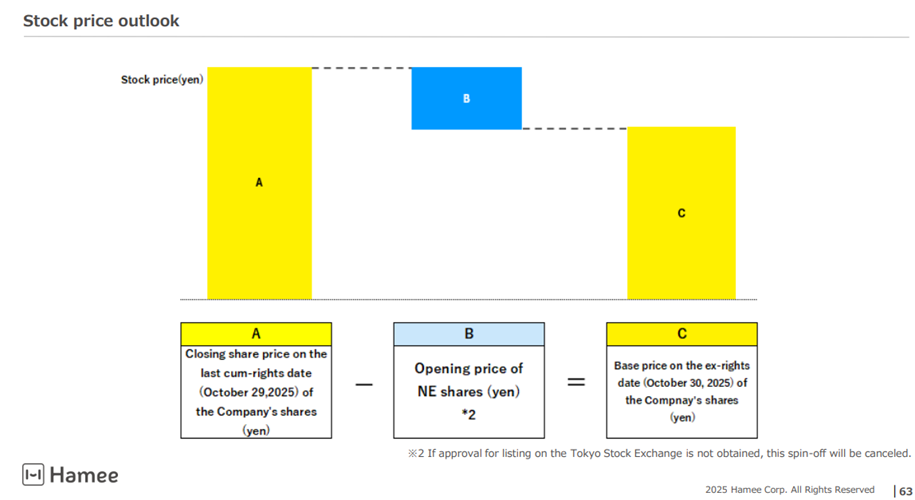
Shareholders of Hamee as of the close on October 29, 2025, will be entitled to receive NE Inc. shares as a dividend in kind. On and after October 30, 2025, which is the ex-rights date, Hamee’s share price will come to reflect only the business value of the Commerce Business.
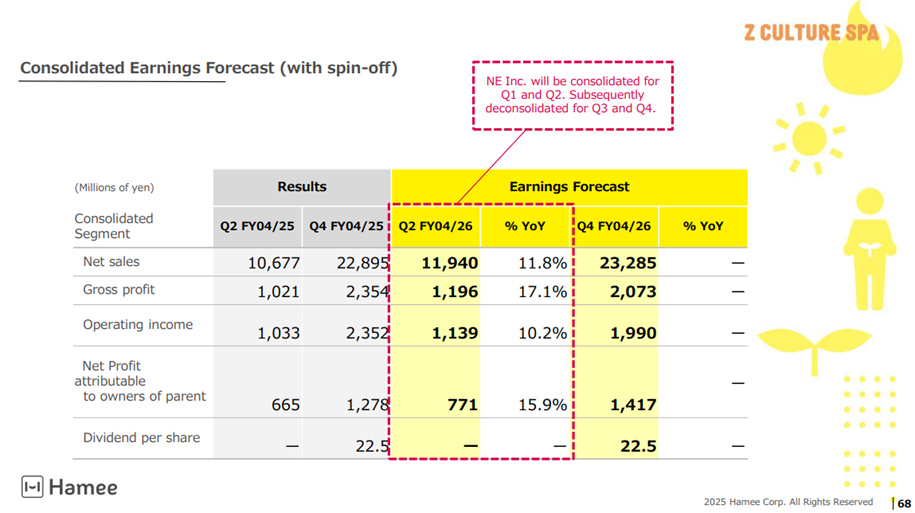
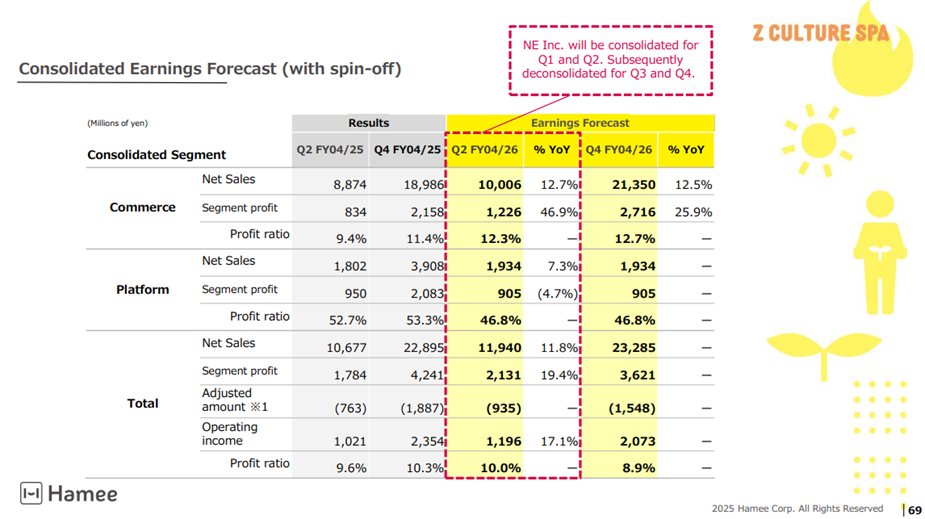
◇ FY04/2026 full-year outlook: revised in light of the spin-off of NE Inc.
Following the decision to approve NE Inc.’s listing, Hamee revised its earnings forecast, and NE Inc. presented a new earnings forecast.
In Hamee’s new full-year forecast, the results of NE Inc. for the second half of FY04/2026 will be deducted due to the spin-off. For this reason, operating profit and ordinary profit will appear to decline YoY. However, in substance, the four core businesses of the Commerce Segment, to be consolidated into Hamee, are expected to continue recording steady growth.
- Hamee (revised): net sales JPY23.28 billion, operating profit JPY2.07 billion, ordinary profit JPY1.99 billion, net income attributable to owners of the parent JPY1.41 billion, EPS JPY86.99, annual dividend per share JPY22.50 (unchanged).
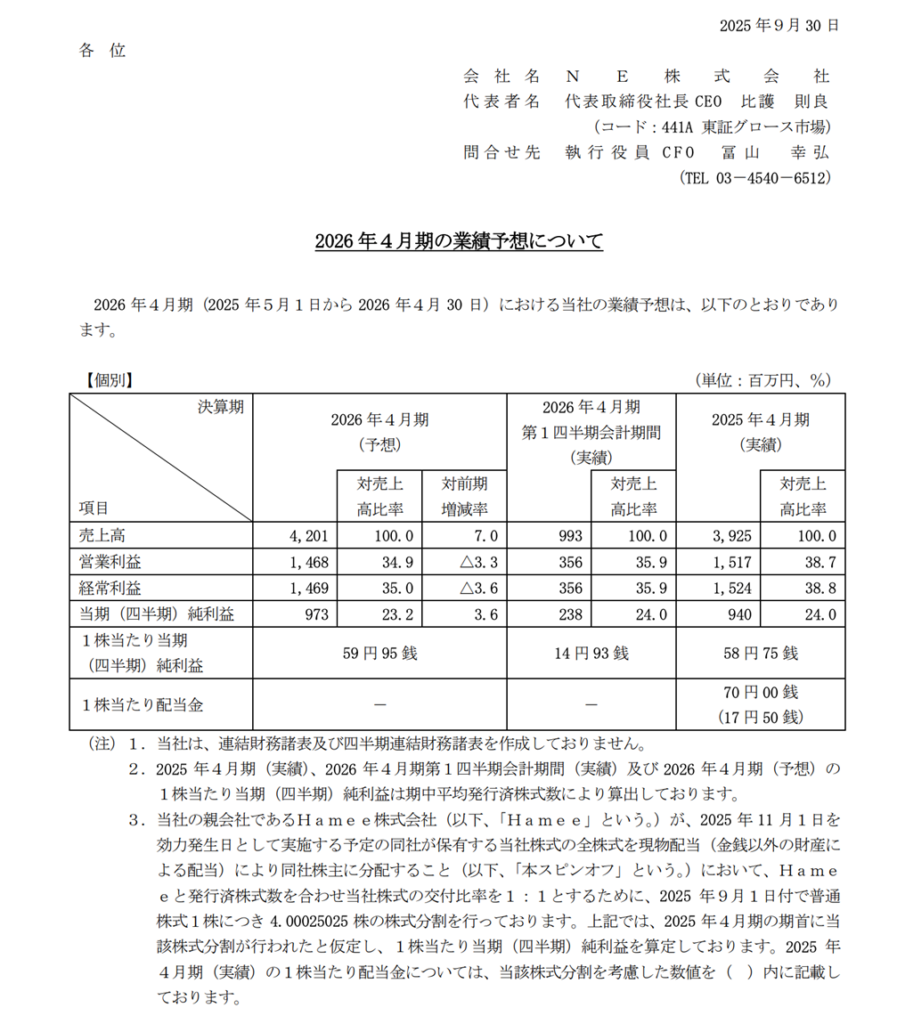
- NE Inc. (new): net sales JPY4.20 billion (up 7.0% YoY), operating profit JPY1.46 billion (down 3.3% YoY), ordinary profit JPY1.46 billion (down 3.6% YoY), net income attributable to owners of the parent JPY970 million (up 3.6% YoY), EPS JPY59.95, no annual dividend.
Although operating profit and ordinary profit at NE Inc. are projected to decline, the impact of one-off expenses related to the IPO is assumed to be envisaged. The KPIs of the Next Engine business itself are on a growth trajectory.
◇ Share price trends and points of focus going forward
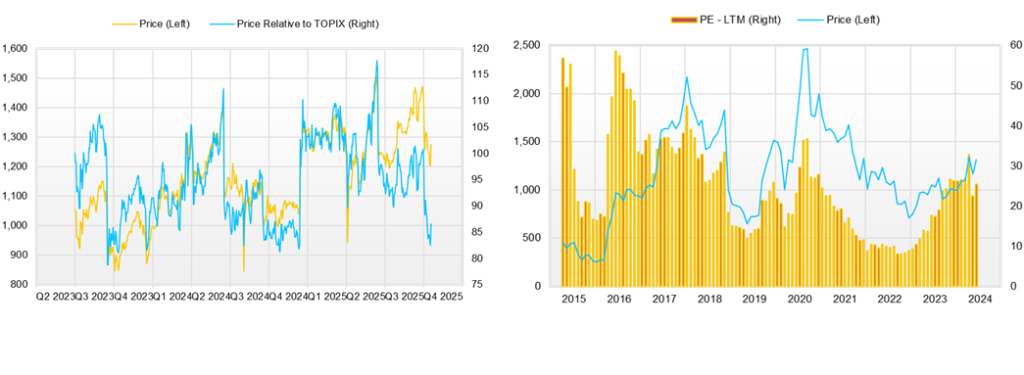
View on the recent share price trend:
Following the announcement of the first-quarter results, the Company’s share price moved from the 1,300-yen range to the 1,400-yen range, but fell into the 1,200-yen range in October. This is assumed to have been due to the adverse effect of the decline in operating profit and ordinary profit at Hamee, as well as the outlook for higher sales and lower earnings at NE Inc.
However, Hamee’s decline forecast is mainly due to deducting six months of NE Inc.’s results, and there is no change in the story of higher sales and higher earnings for the Commerce Segment. In addition, the decline forecast at NE Inc. is also attributed to one-off expenses related to the IPO. Therefore, the share price is expected to discount these factors calmly over a long period.
Impact on the share price from eliminating the conglomerate discount:
Investors are likely currently valuing Hamee by calculating the two business values separately and summing them up in a sum-of-the-parts approach.
- Current share price valuation: Based on the full-year forecast EPS that does not assume the separation, the forecast PER is approximately 10.5x, and the PBR is approximately 1.9x.
- Sum-of-the-parts valuation:
- Commerce Segment: A net sales growth rate of 12.5% and a segment profit margin of 12.7% are likely to merit a specific premium valuation as a specialty retailer in a growth phase.
- Platform Segment (NE Inc.): A high profitability, with a 7% increase in net sales and an operating profit margin of 34.9%, qualifies it for a high valuation as a platform operator.
From this perspective, there is room for a positive reassessment of the current share price. With NE Inc.’s spin-off and listing just ahead, the market is entering a crucial phase to determine whether it will accurately reflect the sum-of-the-parts in the share price.
Points of focus going forward:
In light of the above, the points of focus going forward are as follows.
- NE Inc. public offering price determination and share price formation: Toward the provisional conditions for the public offering on October 15, 2025, and the determination of the public offering price on the 24th, whether expectations will rise that the combined enterprise value of Hamee and NE Inc. will exceed Hamee’s current enterprise value, and whether share price formation will follow suit.
- Continued growth of the Commerce Segment: Whether core businesses, such as Mobile Life and Cosmetics, can continue to grow steadily and increase profits. In particular, execution will be key for additional print runs of products for the new iPhone, the success of new cosmetics products, and the expansion of overseas sales channels.
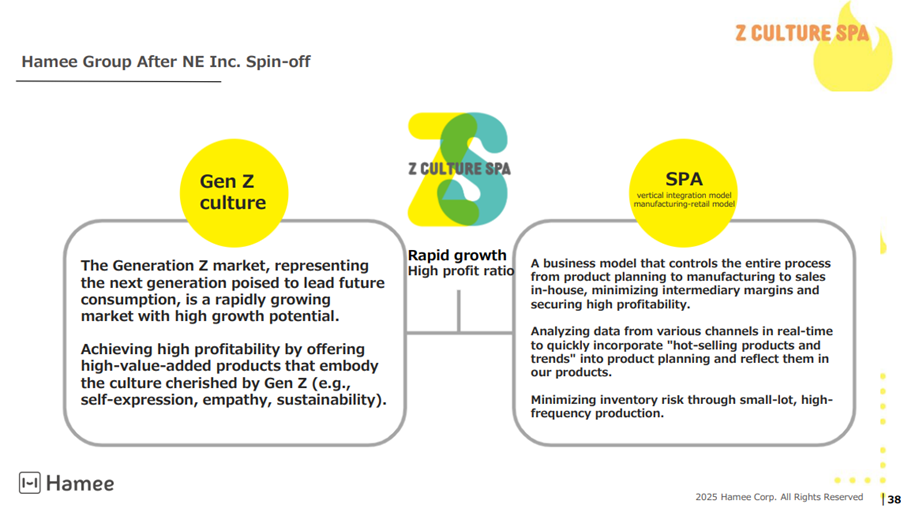
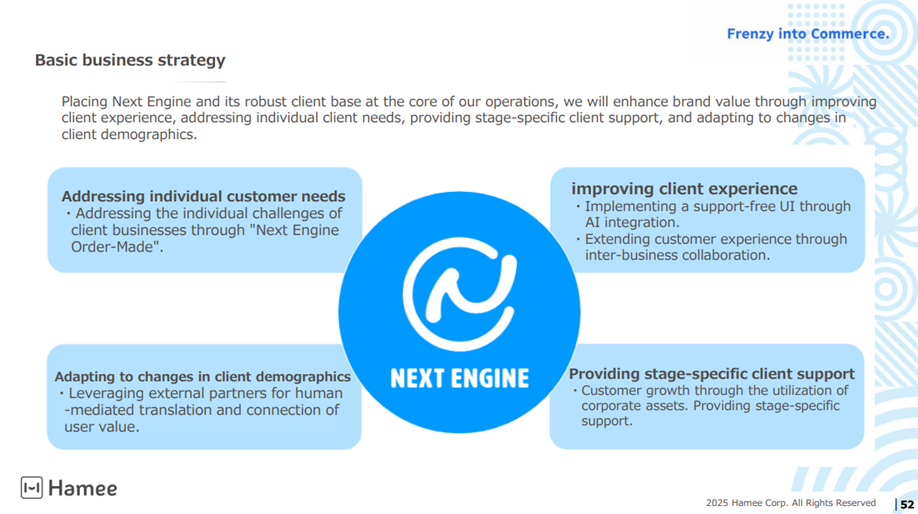
- Concretization of Hamee’s mission: To clearly present the concrete outlook for the Commerce Segment’s mission of “Gen Z Culture SPA & Decarbonization” and the Company’s competitive advantages, and reflect them in corporate value.
- Risk management: To minimize the impact of tariff hikes in the United States in the Commerce Segment.
- Clarification of NE Inc.’s strategy: To clearly present the growth-acceleration strategy for the NextEngine business and the thinking on capital allocation.
Company profile
◇ Hamee Corp. (hereinafter, the Company) was founded in 1997, listed its shares on the TSE Mothers in 2015, and is currently listed on the Standard Market. It operates two de-merged segments: the “Commerce Segment,” which develops businesses such as Mobile Accessories, the Cosmetics Business, the Gaming Accessories Business, and the Global Business; and the “Platform Segment,” whose primary business is to provide EC Attractions “NextEngine,” a cloud (SaaS)-based service for internet mail-order operators that automates tasks related to operating online shops and centrally manages order processing for multiple stores and inventory status across malls.
On November 4, 2025, the Company will conduct a share-distribution-type spin-off for NE Inc., which is responsible for the Platform Segment. It has been decided that NE Inc.’s shares will be listed on the TSE Growth Market. The series of reorganizations aims to avoid a conglomerate discount and to operate the two segments efficiently, so that each segment’s business value is appropriately and timely reflected in the share price. Attention will be focused on whether the share price will move accordingly.
Key financial data
| Unit: million yen | 2021/4 | 2022/4 | 2023/4 | 2024/4 | 2025/4 | 2026/4 CE |
| Sales | 12,363 | 13,413 | 14,038 | 17,612 | 22,895 | 23,285 |
| EBIT (Operating Income) | 2,180 | 2,202 | 1,251 | 1,964 | 2,346 | |
| Pretax Income | 2,144 | 2,463 | 1,396 | 2,009 | 1,991 | |
| Net Profit Attributable to Owner of Parent | 1,556 | 1,744 | 945 | 1,122 | 1,278 | 1,417 |
| Cash & Short-Term Investments | 3,355 | 4,026 | 3,536 | 4,022 | 4,994 | |
| Total assets | 8,342 | 10,524 | 12,392 | 14,885 | 16,973 | |
| Total Debt | 104 | 544 | 1,300 | 2,327 | 3,850 | |
| Net Debt | -3,251 | -3,482 | -2,236 | -1,694 | -1,144 | |
| Total liabilities | 1,814 | 2,271 | 3,431 | 4,728 | 6,402 | |
| Total Shareholders’ Equity | 6,528 | 8,253 | 8,961 | 10,157 | 10,570 | |
| Net Operating Cash Flow | 1,941 | 1,186 | 695 | 886 | 827 | |
| Capital Expenditure | 351 | 1,018 | 487 | 477 | 783 | |
| Net Investing Cash Flow | -412 | -886 | -1,507 | -877 | -922 | |
| Net Financing Cash Flow | -1,736 | 298 | 263 | 380 | 1,171 | |
| Free Cash Flow | 1,760 | 362 | 405 | 577 | 225 | |
| ROA (%) | 18.94 | 18.49 | 8.25 | 8.22 | 8.02 | |
| ROE (%) | 27.42 | 23.60 | 10.98 | 11.73 | 12.33 | |
| EPS (Yen) | 98.4 | 109.7 | 59.4 | 70.4 | 80.2 | 119.1 |
| BPS (Yen) | 411.1 | 519.1 | 563.0 | 637.6 | 662.6 | |
| Dividend per Share (Yen) | 10.00 | 22.50 | 22.50 | 22.50 | 22.50 | 22.50 |
| Shares Outstanding (Million Shares) | 16.21 | 16.27 | 16.27 | 16.28 | 16.29 |
Source: Omega Investment from company data, rounded to the nearest whole number.
Share price
Overview of Q1 FY04/2026
Overview of company-wide performance
Source: Company material
Source: Company material
Overview of the Commerce Segment
Source: Company material
Source: Company material
Overview of the Platform Segment
Source: Company material
Source: Company material
Spin-off and listing of NE Inc.
Source: Company material
Source: Company material
Source: Company material
Source: Company material
Strategy of the Hamee Group

Source: Company material
Source: Company material
Strategy of NE Inc.
Source: Company material
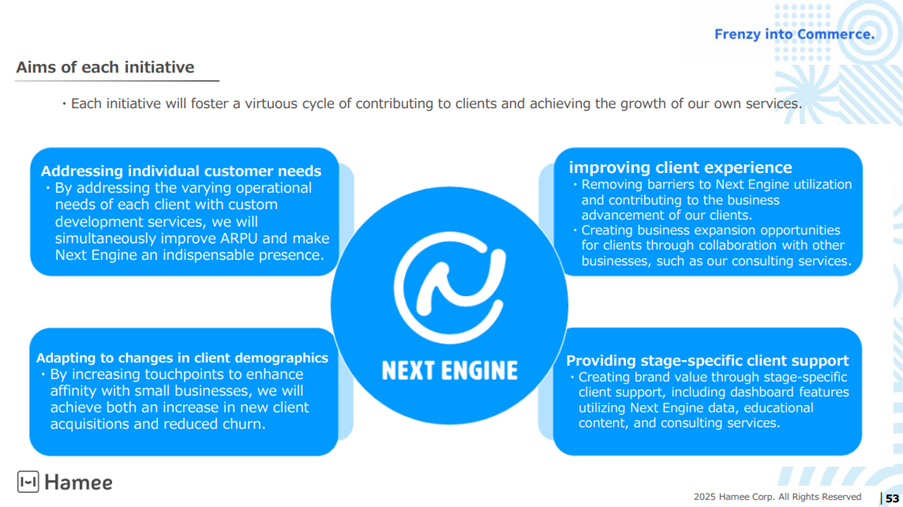
Source: Company material
FY04/2026 earnings forecast (with spin-off)
Source: Company material
Source: Company material
Source: Company material
Source: Company material
FY04/2026 earnings forecast (NE Inc.)
Source: Company material
Financial data (quarterly basis)
| Unit: million yen | 2024/4 | 2025/4 | 2026/4 | ||||||
| 1Q | 2Q | 3Q | 4Q | 1Q | 2Q | 3Q | 4Q | 1Q | |
| (Income Statement) | |||||||||
| Sales | 3,317 | 4,315 | 5,151 | 4,829 | 4,579 | 6,099 | 6,659 | 5,559 | 5,290 |
| Year-on-year | 6.8% | 22.3% | 31.8% | 38.1% | 38.1% | 41.3% | 29.3% | 15.1% | 15.5% |
| Cost of Goods Sold (COGS) | 1,279 | 1,631 | 1,858 | 1,977 | 1,841 | 2,628 | 2,668 | 2,261 | 2,275 |
| Gross Income | 2,038 | 2,684 | 3,293 | 2,852 | 2,738 | 3,471 | 3,991 | 3,297 | 3,016 |
| Gross Income Margin | 61.4% | 62.2% | 63.9% | 59.1% | 59.8% | 56.9% | 59.9% | 59.3% | 57.0% |
| SG&A Expense | 1,863 | 2,224 | 2,565 | 2,306 | 2,505 | 2,691 | 3,074 | 2,882 | 2,845 |
| EBIT (Operating Income) | 187 | 470 | 756 | 551 | 233 | 780 | 917 | 416 | 171 |
| Year-on-year | -24.8% | 44.1% | 27.0% | 545.8% | 24.7% | 65.9% | 21.3% | -24.6% | -23.4% |
| Operating Income Margin | 5.6% | 10.9% | 14.7% | 11.4% | 5.1% | 12.8% | 13.8% | 7.5% | 3.2% |
| EBITDA | 377 | 670 | 953 | 749 | 435 | 941 | 1,163 | 623 | 376 |
| Pretax Income | 205 | 492 | 737 | 576 | 200 | 811 | 702 | 278 | 97 |
| Consolidated Net Income | -133 | 334 | 492 | 428 | 101 | 564 | 400 | 212 | 25 |
| Minority Interest | 0 | 0 | 0 | 0 | 0 | 0 | 0 | 0 | 0 |
| Net Income ATOP | -133 | 334 | 492 | 428 | 101 | 564 | 400 | 212 | 25 |
| Year-on-year | -164.0% | 16.1% | 53.6% | 228.4% | -176.6% | 68.8% | -18.6% | -50.5% | -74.6% |
| Net Income Margin | -4.0% | 7.8% | 9.5% | 8.9% | 2.2% | 9.3% | 6.0% | 3.8% | 0.5% |
| (Balance Sheet) | |||||||||
| Cash & Short-Term Investments | 3,176 | 2,983 | 3,430 | 4,022 | 3,642 | 3,912 | 4,204 | 4,994 | 4,172 |
| Total assets | 12,350 | 13,197 | 14,210 | 14,885 | 15,295 | 16,838 | 18,197 | 16,973 | 16,416 |
| Total Debt | 1,700 | 1,650 | 1,928 | 2,327 | 3,232 | 3,980 | 3,927 | 3,850 | 3,850 |
| Net Debt | -1,476 | -1,333 | -1,502 | -1,694 | -410 | 68 | -277 | -1,144 | -322 |
| Total liabilities | 3,608 | 4,040 | 4,566 | 4,728 | 5,242 | 6,490 | 7,553 | 6,402 | 5,980 |
| Total Shareholders’ Equity | 8,742 | 9,156 | 9,644 | 10,157 | 10,053 | 10,348 | 10,644 | 10,570 | 10,437 |
| (Profitability %) | |||||||||
| ROA | 5.31 | 5.29 | 6.20 | 8.22 | 9.81 | 10.56 | 9.22 | 8.02 | 7.58 |
| ROE | 7.12 | 7.41 | 8.88 | 11.73 | 14.43 | 16.26 | 14.73 | 12.33 | 11.74 |
| (Per-share) Unit: yen | |||||||||
| EPS | -8.3 | 21.0 | 30.9 | 26.9 | 6.4 | 35.4 | 25.1 | 13.3 | 1.6 |
| BPS | 549.2 | 575.0 | 605.6 | 637.6 | 630.7 | 648.8 | 667.4 | 662.6 | 653.1 |
| Dividend per Share | 0.00 | 0.00 | 0.00 | 22.50 | 0.00 | 0.00 | 0.00 | 22.50 | 0.00 |
| Unit: million yen | 16.28 | 16.28 | 16.28 | 16.28 | 16.29 | 16.29 | 16.29 | 16.30 | 16.30 |
Source: Omega Investment from company materials
Financial data (full-year basis)
| Unit: million yen | 2017/4 | 2018/4 | 2019/4 | 2020/4 | 2021/4 | 2022/4 | 2023/4 | 2024/4 | 2025/4 |
| (Income Statement) | |||||||||
| Sales | 8,503 | 9,379 | 10,300 | 11,325 | 12,363 | 13,413 | 14,038 | 17,612 | 22,895 |
| Year-on-year | 30.8% | 10.3% | 9.8% | 10.0% | 9.2% | 8.5% | 4.7% | 25.5% | 30.0% |
| Cost of Goods Sold | 4,485 | 4,618 | 5,056 | 4,894 | 4,802 | 4,892 | 5,563 | 6,745 | 9,398 |
| Gross Income | 4,018 | 4,761 | 5,244 | 6,431 | 7,562 | 8,522 | 8,476 | 10,867 | 13,497 |
| Gross Income Margin | 47.3% | 50.8% | 50.9% | 56.8% | 61.2% | 63.5% | 60.4% | 61.7% | 59.0% |
| SG&A Expense | 2,916 | 3,381 | 4,080 | 4,686 | 5,382 | 6,319 | 7,225 | 8,959 | 11,151 |
| EBIT (Operating Income) | 1,102 | 1,380 | 1,164 | 1,745 | 2,180 | 2,202 | 1,251 | 1,964 | 2,354 |
| Year-on-year | 146.8% | 25.2% | -15.7% | 50.0% | 24.9% | 1.0% | -43.2% | 57.0% | 19.5% |
| Operating Income Margin | 13.0% | 14.7% | 11.3% | 15.4% | 17.6% | 16.4% | 8.9% | 11.1% | 10.2% |
| EBITDA | 1,272 | 1,627 | 1,525 | 2,227 | 2,694 | 2,840 | 2,042 | 2,749 | 3,162 |
| Pretax Income | 1,010 | 1,259 | 1,179 | 1,582 | 2,144 | 2,463 | 1,396 | 2,009 | 1,991 |
| Consolidated Net Income | 696 | 873 | 821 | 1,069 | 1,556 | 1,744 | 945 | 1,122 | 1,278 |
| Net Income ATOP | 696 | 873 | 821 | 1,069 | 1,556 | 1,744 | 945 | 1,122 | 1,278 |
| Year-on-year | 169.7% | 25.4% | -5.9% | 30.2% | 45.5% | 12.0% | -45.8% | 18.6% | 13.9% |
| Net Income Margin | 8.2% | 9.3% | 8.0% | 9.4% | 12.6% | 13.0% | 6.7% | 6.4% | 5.6% |
| (Balance Sheet) | |||||||||
| Cash & Short-Term Investments | 1,324 | 1,695 | 1,660 | 3,453 | 3,355 | 4,026 | 3,536 | 4,022 | 4,994 |
| Total assets | 4,240 | 5,042 | 5,761 | 8,097 | 8,342 | 10,524 | 12,392 | 14,885 | 16,973 |
| Total Debt | 468 | 298 | 500 | 1,740 | 104 | 544 | 1,300 | 2,327 | 3,850 |
| Net Debt | -856 | -1,397 | -1,160 | -1,713 | -3,251 | -3,482 | -2,236 | -1,694 | -1,144 |
| Total liabilities | 1,484 | 1,445 | 1,572 | 3,272 | 1,814 | 2,271 | 3,431 | 4,728 | 6,402 |
| Total Shareholders’ Equity | 2,756 | 3,597 | 4,189 | 4,824 | 6,528 | 8,253 | 8,961 | 10,157 | 10,570 |
| (Cash Flow) | |||||||||
| Net Operating Cash Flow | 576 | 1,246 | 651 | 1,934 | 1,941 | 1,186 | 695 | 886 | 827 |
| Capital Expenditure | 228 | 437 | 291 | 649 | 351 | 1,018 | 487 | 477 | 783 |
| Net Investing Cash Flow | -433 | -674 | -671 | -1,020 | -412 | -886 | -1,507 | -877 | -922 |
| Net Financing Cash Flow | 69 | -230 | -7 | 933 | -1,736 | 298 | 263 | 380 | 1,171 |
| Free Cash Flow | 464 | 960 | 526 | 1,440 | 1,760 | 362 | 405 | 577 | 225 |
| (Profitability %) | |||||||||
| ROA | 19.18 | 18.81 | 15.21 | 15.43 | 18.94 | 18.49 | 8.25 | 8.22 | 8.02 |
| ROE | 29.30 | 27.48 | 21.10 | 23.73 | 27.42 | 23.60 | 10.98 | 11.73 | 12.33 |
| Net Profit Margin | 8.18 | 9.31 | 7.97 | 9.44 | 12.59 | 13.00 | 6.73 | 6.37 | 5.58 |
| Asset Turnover | 2.34 | 2.02 | 1.91 | 1.63 | 1.50 | 1.42 | 1.23 | 1.29 | 1.44 |
| Financial Leverage | 1.53 | 1.46 | 1.39 | 1.54 | 1.45 | 1.28 | 1.33 | 1.43 | 1.54 |
| (Per-share) Unit: yen | |||||||||
| EPS | 44.2 | 54.7 | 51.2 | 67.4 | 98.4 | 109.7 | 59.4 | 70.4 | 80.2 |
| BPS | 174.0 | 224.1 | 263.0 | 305.5 | 411.1 | 519.1 | 563.0 | 637.6 | 662.6 |
| Dividend per Share | 4.50 | 5.50 | 6.50 | 7.00 | 10.00 | 22.50 | 22.50 | 22.50 | 22.50 |
| Shares Outstanding (Million Shares) | 15.74 | 15.94 | 16.08 | 16.10 | 16.21 | 16.27 | 16.27 | 16.28 | 16.29 |
Source: Omega Investment from company materials