2026-03-30
Home
Japanese

Omega Investment Co., Ltd.
Kidswell Bio (Investment report – 2Q update)
| Share price (12/15) | ¥209 | Dividend Yield (26/3 CE) | – % |
| 52weeks high/low | ¥93/417 | ROE(25/3 act) | -1.6 % |
| Avg Vol (3 month) | 896.2 thou shrs | Operating margin (25/3 act) | 0.5 % |
| Market Cap | ¥10.3 bn | Beta (5Y Monthly) | – |
| Enterprise Value | ¥9.9 bn | Shares Outstanding | 49.580 mn shrs |
| PER (26/3 CE) | – X | Listed market | TSE Growth |
| PBR (25/3 act) | 4.8 X |
| Click here for the PDF version of this page |
| PDF version |
Stepwise expansion of exposure centered on biosimilar profitability and expectations for SQ-SHED growth
Investment conclusion
As in the previous report, we believe that a “slightly bullish, stepwise expansion of exposure” investment stance toward Kidswell Bio Corporation (the “Company”) remains appropriate. This is because in the cumulative 2Q of FY3/2026, the Company recorded net sales of 3.276 billion yen (+87.2% YoY) and operating profit of 215 million yen, maintaining consolidated profitability, and interim net income also turned positive to 61 million yen, confirming that the move into the black is not a one-off. With a market capitalization of 12.2 billion yen, a PBR of 5.75x, and a beta of 1.5, the premium valuation and high volatility remain unchanged, and short-term swings driven by expectations and disappointments regarding the success or failure of cell therapies and new biosimilars can be expected. Therefore, over the medium term, we believe it is realistic to maintain a core holding while flexibly adjusting additional positions around events or in phases of sharp share price rallies.
This judgment is underpinned by two points on both results and plan: “progress in structural improvement” and “continued growth investment.” In the 2Q results, manufacturing and delivery of biosimilar APIs and other products progressed as planned, and together with contributions from supply price adjustments for some products, gross profit expanded to 993 million yen (2.0x YoY), and operating income turned positive from a loss in the previous year. The full-year outlook has been revised up to net sales of 5.5–6.0 billion yen and an operating loss of 600–300 million yen, a substantial improvement from the 1Q operating loss range of 1.7–1.0 billion yen, but the plan still calls for a full-year loss. The Company remains in a phase of continued upfront investment in cell therapies and new biosimilars. Meanwhile, a 125 million yen loss on the disposal of inventories arising from deviations in manufacturing processes at a CDMO (contract development and manufacturing organization) has been recorded as non-operating expenses, and we believe the fact that manufacturing risk and cost volatility have materialized needs to be recognized as a risk factor.
In the previous report, after confirmation of the “initial phase of turning profitable,” the near-term catalysts identified were (i) new biosimilar contracts, (ii) the interim analysis for pediatric cerebral palsy using “SQ-SHED,” stem cells from human exfoliated deciduous teeth, (scheduled for December 12, 2025), and (iii) the start of construction of a domestic biosimilar manufacturing facility (scheduled for March 2026), and a “slightly bullish, stepwise approach” premised on progress in these areas was presented. Looking at subsequent developments, regarding (i), in October 2025, the Company concluded a basic agreement and a basic contract with Alfresa Holdings and Chiome Bioscience for new biosimilar development, which is in line with the envisaged contract execution scenario. Concerning (iii), on the same date the Company reached a basic agreement with Alfresa Holdings, Chiome Bioscience and MBI to establish a joint venture, and with a framework now in place predicated on constructing a domestic manufacturing facility in Akita Prefecture, the story of building a fully integrated domestic supply chain has become more concrete, representing progress that we believe supports the previous hypothesis.
The source of the Company’s strength lies not only in its cash-generating capacity, backed by a track record in four biosimilar products, but also in the fact that, through alliances with Alfresa Holdings, Chiome Bioscience, and MBI, it can envisage a supply chain that consistently handles the entire process from development of new biosimilars through domestic manufacturing and supply. In addition, S-Quatre’s SQ-SHED pipeline is advancing in the pediatric and rare disease area, starting with cerebral palsy, and, if successful, will embed option value sufficient to justify the current PBR level. The current stage can be positioned as “the gateway from the initial phase of consolidated profitability into the full-fledged expansion phase.” If the forecast narrowing of the loss in FY3/2025 and the improvement in operating profitability in FY3/2026 are achieved, there will be further room for a re-rating. In light of this structural improvement and the future growth potential represented by SQ-SHED and other projects, and while premising volatility, we believe that a “slightly bullish, stepwise” investment approach that increases exposure over the medium term in line with quarterly KPI results (gross margin, deliveries and collections, development milestones) remains valid.
◇ FY3/2026 2Q results highlights: substantial increase in revenue and maintained profitability driven by biosimilars, while loss on disposal of inventories arising from manufacturing deviations materialized as a risk factor
In the cumulative 2Q of FY3/2026, against the backdrop of steady deliveries of biosimilar APIs and other products, both sales and profits significantly exceeded the previous year, and the Company maintained consolidated profitability, while at the same time recognizing a 125 million yen loss on disposal of inventories arising from manufacturing deviations at a CDMO as an issue brought to the fore in the results.
Net sales rose sharply to 3.276 billion yen (+87.2% YoY). The main factors were that manufacturing and delivery of biosimilar APIs and other products proceeded in line with the schedule agreed with partner pharmaceutical companies. Supply price adjustments were implemented for some products. Gross profit nearly doubled to 993 million yen (492 million yen in the same period of the previous year), and gross margin improved from 28.1% to 30.3%, confirming improved profitability on both the volume and unit price/cost fronts.
On the cost side, selling, general, and administrative expenses increased only slightly to 777 million yen (754 million yen in the same period of the previous year). The breakdown was R&D expenses of 388 million yen (340 million yen in the previous year) and other SG&A of 389 million yen (414 million yen in the previous year), indicating a structure that maintained R&D investment. In contrast, administrative and other SG&A costs were contained. As a result, operating income improved significantly from a loss of 262 million yen in the previous year to a profit of 215 million yen, and the profit-turn momentum that began in 1Q continued.
In non-operating expenses, in addition to interest expenses of 17 million yen on bank borrowings and other debt, the Company recorded a 125 million yen loss on the disposal of inventories arising from deviations in manufacturing processes at a CDMO, resulting in total non-operating expenses swelling to 144 million yen and ordinary income being limited to 77 million yen. The Company has stated that this loss was limited to part of the entrusted manufactured APIs and other products, that recurrence prevention measures and process reviews have already been implemented, and that it does not expect any impact on future manufacturing plans or stable supply. Still, manufacturing risk management remains an issue that requires continued attention.
Net income came to 61 million yen, turning positive from a loss of 242 million yen in the previous year. On the financial position, while total assets shrank to 5.815 billion yen (7.008 billion yen at the end of the previous fiscal year), the equity ratio improved significantly from 19.1% to 36.7%, reflecting the effects of a reduction of capital without compensation and loss offset, and streamlining of the capital structure through the exercise of convertible bonds and stock acquisition rights. Based on these results, the Company revised its full-year earnings forecast upwards to net sales of 5.5–6.0 billion yen (from 5.0–5.5 billion yen previously) and operating loss of 600–300 million yen (from a 1.7–1.0 billion yen operating loss previously), factoring in continued strength in the biosimilar business and narrowing of the loss through cost reviews.
These results can be viewed positively, as the Company maintained profitability through solid deliveries of biosimilar APIs and other products, improvements in gross margin, and a substantially revised-up full-year outlook. At the same time, the materialization of manufacturing risk in the form of a loss on disposal of inventories has served as a reminder of the structural risks inherent in a business that relies on plants and CDMOs. Going forward, we believe the key points determining how the equity market evaluates the Company will be the extent to which the manufacturing process can be stabilized, the effectiveness of recurrence prevention measures can be confirmed, and the extent to which the quarterly trend in gross margin and the balance of development investment can be controlled.
◇ Segment analysis: biosimilars as the earnings driver, cell therapy as the investment segment bearing future growth
Although the Company has a single segment, the “pharmaceutical development business,” on a consolidated basis, in substance it operates with a two-layer structure consisting of (i) the biosimilar business and (ii) the cell therapy business (S-Quatre). At present, virtually all sales and profits are generated by biosimilars, while cell therapy is in R&D and positioned as a future growth option.
・Biosimilar business:
The biosimilar business develops follow-on products capturing the expiry of patents on originator biologics and supplies APIs and drug products to partner pharmaceutical companies, receiving royalties and other consideration in line with sales performance. The Company is involved in four products, including GBS-001/010, a treatment for neutropenia, and GBS-007, a cure for age-related macular degeneration. It supports the supply system for four of the 22 biosimilars approved in Japan. The bulk of the 3.276 billion yen in cumulative 2Q FY3/2026 net sales was accounted for by this business, which grew substantially by 87.2% YoY. In 2Q, in addition to deliveries of APIs and other products progressing as planned, supply price corrections for some products boosted gross profit.
・Cell therapy business (regenerative medicine):
Wholly owned subsidiary S-Quatre operates the cell therapy business and focuses on developing regenerative medicine products using SQ-SHED, stem cells from human exfoliated deciduous teeth developed independently by S-Quatre. For its central theme, pediatric cerebral palsy, Nagoya University’s investigator-initiated clinical research using autologous SQ-SHED has completed administration in all three cases and achieved the primary safety endpoint. On the back of these results, the Company is preparing for domestic clinical trials of GCT-103, in collaboration with Mochida Pharmaceutical and, in the United States, has completed a pre-IND meeting (pre-submission consultation on clinical trial plans) with the FDA (Food and Drug Administration).
Furthermore, multiple co-research themes with academia and companies are being pursued, including pipelines for several rare and intractable diseases, such as congenital isolated hypoganglionosis and bone diseases; Treg × SHED; and combinations with lymphangiogenesis technologies targeting infertility and fibrosis. These are currently in the investment phase before contributing to sales. While they push up R&D expenses, over the medium to long term, they are expected to become second and third earnings drivers following cerebral palsy.
The biosimilar business, through the existing four products, new pipelines, and the development of domestic manufacturing infrastructure, is responsible for providing “stable earnings,” while the cell therapy business functions as a “high-growth option” focused on pediatric and rare diseases. We believe that enhancing the division of roles between the two and the circulation of cash flow will be the key to improving corporate value over the medium to long term.
◇ FY3/2026 earnings forecast: full-year outlook revised up toward higher sales and narrower loss, while maintaining the scenario of operating profitability next fiscal year as set out in the mid-term plan
The Company has revised its FY3/2026 full-year forecast upward to net sales of 5.5–6.0 billion yen and operating loss of 600–300 million yen, making the trend toward higher sales and a narrower loss more apparent compared with the previous forecast (net sales of 5.0–5.5 billion yen and operating loss of 1.7–1.0 billion yen). At the same time, the plan still calls for an operating loss this fiscal year, and there is no change in the mid-term scenario that positions FY3/2027 as the phase of full-scale operating profitability.
The latest revision reflects that the full-year outlook for manufacturing and delivery of biosimilar APIs and other products has become clearer to some extent, and that, after carefully examining the impact of supply price negotiations for some products, net sales are expected to exceed initial assumptions. In addition, as discussions and coordination with relevant parties regarding R&D investment and other items have progressed, expenses are now expected to be lower than initially projected, and the operating loss range has therefore been significantly narrowed. The full-year sales growth rate is projected at 8.2–18.1%, and the current fiscal year can be seen as a year of “maintaining a profit-making trend while compressing the loss.”
For FY3/2027, the Company is targeting net sales of 5.5–6.0 billion yen and operating profit of 0.1–1.0 billion yen, thus keeping sales at a level roughly the same as in the current fiscal year while positioning entry into operating profitability as a clear milestone. The drivers of the profit-turn are stable demand for existing biosimilars and the ramp-up of new biosimilars, as well as lower manufacturing costs through switching to newly approved CDMOs. Whether the biosimilar business can continue to enhance profitability in terms of volume, price, and cost from this fiscal year onward will be the precondition for operating profitability.
In the cell therapy business, Nagoya University’s investigator-initiated clinical research using autologous SQ-SHED for pediatric cerebral palsy has achieved the primary safety endpoint, and in November 2025, based on data up to 12 weeks after administration, an interim analysis result suggesting improvements in motor function, in addition to confirmation of safety and tolerability, was published as a preprint. Based on these results, for the allogeneic product GCT-103, the Company is preparing to initiate clinical trials in Japan with Mochida Pharmaceutical, with the potential for alliance milestones and out-licensing income from FY3/2027 onward. That said, the P&L contribution in the current fiscal year will be limited, and, for the time being, the structure will be to record these items upfront as R&D expenses.
On the other hand, the risks accompanying manufacturing and development are also evident. In the current fiscal year, the Company has recorded a 125 million yen loss on the disposal of inventories arising from deviations in manufacturing processes at a CDMO, and 17 million yen in interest expenses. The risks inherent in a business model that relies on external manufacturing of biosimilar APIs have materialized. The Company has implemented recurrence-prevention measures and process reviews and expects no impact on future manufacturing plans or stable supply; however, if manufacturing deviations or quality issues recur, there remains a risk that the assumptions underpinning the full-year forecast will be undermined. Investors need to monitor trends in gross margin, R&D expenses, and the presence or absence of manufacturing issues as KPIs to assess the likelihood of achieving operating profitability.
The upward revision to the full-year forecast and the maintenance of the operating profitability scenario next fiscal year indicate that the earnings power of the biosimilar business is stronger than initially envisaged, and the medium-term story has been reinforced. At the same time, risks remain, including the manufacturing deviation risk associated with dependence on CDMOs, uncertainties in the SQ-SHED development timeline, and the risk that results in land toward the lower end of the range. We consider that a realistic approach for investors is to adjust exposure levels according to the perceived likelihood of achieving operating profitability, while confirming, on a quarterly basis, trends in gross margin, development expenses, and the absence or presence of manufacturing trouble, as well as the content of the interim analysis for cerebral palsy.
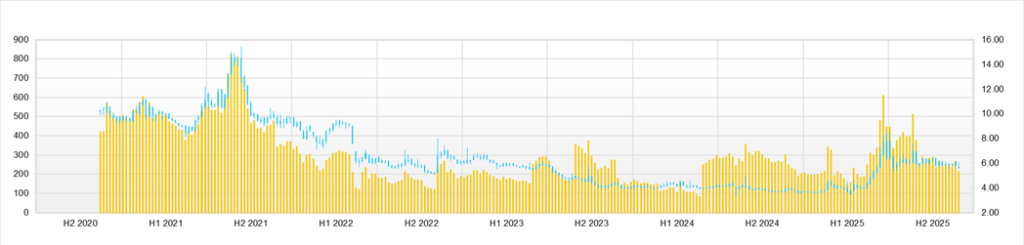
◇ Share price trend and key points to watch: seeking room for a re-rating in a highly volatile, high-PBR, event-driven market
Over the past three months, the Company’s share price has traded in a range of 236–302 yen, with the latest closing price around 249 yen, market capitalization around the 12 billion yen level, PBR of around 5.7–6x and PER not calculable due to losses, embodying the typical profile of a small-cap biotech name characterized by “high volatility, high PBR and event-driven trading.” Taking into account a market capitalization of 12.2 billion yen, PBR of 5.75x, ROE of -1.89%, ROIC of 11.18%, net cash of 407 million yen, and beta of 1.5, the current level represents a substantial premium valuation relative to the current profit level. It can be regarded as reflecting both the continuation of profitability in the biosimilar business and future growth from SQ-SHED.
Looking at the share price trend over the past three months (August 19 to November 17), after opening at 300 yen, hitting a high of 302 yen, and closing at 284 yen on August 19, the share price moved into the 300 yen range. Still, on August 20, it fell sharply, with a high of 286 yen, a low of 247 yen, and a close of 247 yen (-13.03% from the previous day), and then shifted into a box range of 260–280 yen in September. In late September, the closing price occasionally returned to around 280 yen. However, in October, the share price temporarily fell back to 249 yen, and from October 1 to November 14, 2025, the intraday range was 228–273 yen, with a closing price range of 231–263 yen. The share price thus still stands at an intermediate level, having risen substantially from the year-to-date low of 93 yen (April 7) yet remaining in a correction phase from the year-to-date high of 417 yen (June 25).
Examining the relationship between news flow and share price reactions, a typical event-driven pattern emerges. Following IR releases on November 13, 2025 for the “FY3/2026 2Q financial results” and “Recognition of non-operating expenses and upward revision of consolidated earnings forecast,” the closing price on November 14 rose from 250 yen to 263 yen (+5.20%), indicating that the market welcomed the increase in sales, maintenance of profitability and upward revision to the full-year forecast. However, the share price then fell back to 249 yen on the 17th, suggesting a pattern in which buying interest concentrates in response to short-term positive news but is offset within a few trading days by profit-taking from short-term players.
Similarly, the October 6, 2025, press release concerning the “basic agreement for establishing a domestic joint venture manufacturing company for biosimilars and other products jointly funded by Alfresa Holdings, Chiome Bioscience, and Mycenax Biotech” constitutes a positive factor for the medium to long term in that it builds domestic biosimilar manufacturing infrastructure. The share price on the announcement date, October 6, fell slightly to 239 yen (-1.65%), but then rose to 243 yen (+1.67%) on the 7th, 248 yen (+2.06%) on the 8th and 265 yen (+6.85%) on the 9th, representing an approximately 11% increase over several trading days, which can be seen as buying reflecting the theme once the supply-demand balance had been cleaned up.
From a technical perspective, within the three-month range of 236–302 yen, the 238–255 yen level in late August to early September is perceived as the support zone, and the 270–280 yen range in late September to early October as the resistance zone. As of mid-November, the share price is located roughly in the middle of this range, and appears to be in a consolidation phase around the 25-day moving average. With the high of 417 yen still holding, this level is likely to be perceived as significant resistance in the medium to long term, and in phases when the share price moves into the 300 yen range, selling pressure from investors looking to sell into strength is expected to intensify.
A PBR of 5–6x the current price can hardly be described as cheap. At the same time, ROE is currently negative, operating cash flow is highly volatile, and many factors are driving earnings volatility, including the loss on disposal of inventory arising from manufacturing deviations and the burden of interest expenses. Taking these points into account, the current share price reflects growth expectations. However, if the profit-making trend in the biosimilar business, the clear milestone of operating profitability in FY3/2027 (operating profit range of 0.1–1.0 billion yen) set out in the mid-term plan, and the future growth potential of the SQ-SHED pipeline are taken into consideration, we believe the stock can reasonably be regarded as having value appeal on a forward-looking basis, assuming future profit levels and ROE improvement, even though the PBR is high and PER is negative.
Conditions under which an overweight position could be considered include, first, that operating profitability in the biosimilar business becomes stable on a quarterly basis and that ROE clearly returns to positive territory in light of the balance between gross margin and R&D expenses; second, that no further manufacturing deviations occur at CDMOs and that the domestic manufacturing facility in Akita starts construction and progresses according to plan; and third, that the interim analysis in the clinical research on cerebral palsy using SQ-SHED shows efficacy signals, and that the joint development and commercialization plan with Mochida Pharmaceutical is presented with a concrete timeline. If these conditions are met, confidence in the medium- to long-term growth story will increase, and there will be greater scope to justify the PBR premium.
In terms of investment timing, likely triggers include (i) earnings forecast revisions and IR regarding manufacturing risks announced on the same day as financial results, (ii) clinical or alliance news related to SQ-SHED, (iii) disclosure on new biosimilar contracts and progress on the domestic manufacturing facility, and (iv) presentations on SQ-SHED technology at international conferences such as ISCT 2025. After stock prices surge sharply during such events, profit-taking and selling into strength are likely to emerge within several days to several weeks after sharp rallies, so we believe a realistic approach is stepwise buying on dips, utilizing phases where the share price pulls back towards around the 25-day moving average or approaches around 240 yen (a level where multiple troughs have formed over the past three months). Conversely, the area near 300 yen can be regarded as a zone where one should be wary of overheating driven by short-term money and consider reducing positions or hedging.
We believe that the current share price level, which appears expensive at first glance at PBR of 5–6x, in fact reflects strong expectations for a two-stage growth story of “biosimilar profitability + future growth from SQ-SHED.” In the short term, this is a highly volatile stock that can easily move by around 10% on the back of earnings or IR, and in the current phase, where it is more appropriate to pursue a trading-oriented approach that takes advantage of overheating and corrections around events than to hold a prominent core position, such an approach is suitable. For investors considering an overweight position over the medium to long term, we would recommend waiting until operating profitability on a full-year basis has been confirmed at least once and the interim results of SHED clinical trials have not significantly undershot market expectations.
Company profile
◇ A hybrid drug discovery venture that “creates value through biotech.”
Kidswell Bio Corporation is a drug discovery venture whose core is a two-layer model that generates stable cash flow in the biosimilar business while building future value through cell therapy using “SHED,” stem cells from human exfoliated deciduous teeth. Focusing on areas with high unmet medical needs, such as pediatric, rare, and intractable diseases, the Company has adopted the corporate philosophy of “Biotech Engineering Company, Striving for Value Creation – For Comprehensive Healthcare System for Children as well as Families and Society -.”
The business portfolio consists of the “biosimilar business,” which develops four biosimilar products (GBS-001, GBS-010, GBS-011 and GBS-007) that capture the expiry of patents on originator biologics and supplies APIs and other products, and “cell therapy (regenerative medicine),” which targets pediatric and rare diseases such as cerebral palsy using “SQ-SHED,” a cell therapy based on SHED (stem cells from human exfoliated deciduous teeth), developed by S-Quatre. In the biosimilar business, in addition to supplying APIs and drug products, the Company also earns royalties and milestone income based on sales performance. In the cell therapy business, clinical research and joint development across multiple disease areas with SQ-SHED at the core are being promoted.
Key financial data
| Unit: million yen | 2020 | 2021 | 2022 | 2023 | 2024 | 2025 CE |
| Sales | 997 | 1,569 | 2,776 | 2,431 | 5,082 | 5,500 〜6,000 |
| EBIT (Operating Income) | -970 | -976 | -551 | -1,336 | 28 | -300 〜-600 |
| Pretax Income | -1,000 | -550 | -656 | -1,421 | 73 | |
| Net Profit Attributable to Owner of Parent | -1,001 | -551 | -657 | -1,422 | -21 | |
| Cash & deposits | 1,461 | 1,161 | 1,067 | 2,231 | 2,995 | |
| Total assets | 3,934 | 3,470 | 3,895 | 5,086 | 7,008 | |
| Total Debt | 1,100 | 700 | 1,950 | 2,575 | 1,838 | |
| Net Debt | -361 | -461 | 883 | 344 | -1,157 | |
| Total liabilities | 2,324 | 1,767 | 2,661 | 4,254 | 5,598 | |
| Total Shareholders’ Equity | 1,610 | 1,703 | 1,234 | 831 | 1,411 | |
| Net Operating Cash Flow | -1,267 | -1,170 | -1,421 | -454 | 937 | |
| Capital Expenditure | 3 | 0 | 0 | 0 | 6 | |
| Net Investing Cash Flow | -22 | 527 | -29 | 0 | 65 | |
| Net Financing Cash Flow | 718 | 369 | 1,356 | 1,618 | -240 | |
| ROA (%) | -26.61 | -14.88 | -17.85 | -31.67 | -0.35 | |
| ROE (%) | -64.66 | -33.25 | -44.78 | -137.73 | -1.89 | |
| EPS (Yen) | -34.8 | -17.9 | -20.8 | -40.2 | -0.5 | |
| BPS (Yen) | 54.4 | 54.2 | 38.5 | 21.4 | 32.2 | |
| Dividend per Share (Yen) | 0.00 | 0.00 | 0.00 | 0.00 | 0.00 | |
| Shares Outstanding (Million shares) | 29.06 | 31.44 | 31.90 | 37.31 | 40.66 |
Source: Omega Investment from company data, rounded to the nearest whole number
Share price
Key stock price data
Financial data (quarterly basis)
| Unit: million yen | 2023/3 | 2024/3 | 2025/3 | ||||||
| 2Q | 3Q | 4Q | 1Q | 2Q | 3Q | 4Q | 1Q | 2Q | |
| (Income Statement) | |||||||||
| Sales | 536 | 985 | 864 | 483 | 1,267 | 1,286 | 2,046 | 1,721 | 1,556 |
| Year-on-year | 6.1% | 61.3% | -17.6% | 950.4% | 136.4% | 30.6% | 136.6% | 256.3% | 22.8% |
| Cost of Goods Sold (COGS) | 351 | 352 | 688 | 259 | 998 | 748 | 1,436 | 1,123 | 1,160 |
| Gross Income | 185 | 633 | 176 | 224 | 269 | 538 | 610 | 597 | 396 |
| Gross Income Margin | 34.5% | 64.3% | 20.4% | 46.3% | 21.2% | 41.8% | 29.8% | 34.7% | 25.4% |
| SG&A Expense | 449 | 580 | 845 | 383 | 372 | 414 | 444 | 413 | 365 |
| EBIT (Operating Income) | -265 | 53 | -669 | -159 | -104 | 125 | 166 | 185 | 31 |
| Year-on-year | -638.6% | -135.9% | 60.9% | -65.1% | -60.9% | 136.8% | -124.8% | -216.2% | -129.6% |
| Operating Income Margin | -49.4% | 5.3% | -77.3% | -32.9% | -8.2% | 9.7% | 8.1% | 10.7% | 2.0% |
| EBITDA | -264 | 53 | -668 | -159 | -103 | 125 | 166 | 185 | 31 |
| Pretax Income | -309 | 35 | -676 | -176 | -65 | 107 | 207 | 176 | -88 |
| Consolidated Net Income | -310 | 33 | -675 | -177 | -65 | 54 | 167 | 157 | -97 |
| Minority Interest | 0 | 0 | 0 | 0 | 0 | 0 | 0 | 0 | 0 |
| Net Income ATOP | -310 | 33 | -675 | -177 | -65 | 54 | 167 | 157 | -97 |
| Year-on-year | -909.1% | -121.6% | 45.9% | -62.5% | -79.0% | 64.4% | -124.7% | -188.9% | 48.3% |
| Net Income Margin | -57.8% | 3.3% | -78.0% | -36.6% | -5.1% | 4.2% | 8.1% | 9.1% | -6.2% |
| (Balance Sheet) | |||||||||
| Cash & deposits | 622 | 2,187 | 2,231 | 1,167 | 1,695 | 1,318 | 2,995 | 2,840 | 1,542 |
| Total assets | 3,194 | 5,199 | 5,086 | 4,609 | 4,646 | 4,575 | 7,008 | 6,579 | 5,815 |
| Total Debt | 1,775 | 2,275 | 2,575 | 2,402 | 2,131 | 2,034 | 1,838 | 1,549 | 1,134 |
| Net Debt | 1,153 | 88 | 344 | 1,235 | 436 | 715 | -1,157 | -1,291 | -407 |
| Total liabilities | 2,119 | 3,755 | 4,254 | 3,895 | 3,789 | 3,523 | 5,598 | 4,531 | 3,629 |
| Total Sharehjolders’ Equity | 1,075 | 1,444 | 831 | 714 | 857 | 1,052 | 1,411 | 2,048 | 2,186 |
| (Profitability %) | |||||||||
| ROA | -37.43 | -25.82 | -31.67 | -29.48 | -22.54 | -17.65 | -0.35 | 5.59 | 5.38 |
| ROE | -100.55 | -77.27 | -137.73 | -152.15 | -91.46 | -69.11 | -1.89 | 22.64 | 18.48 |
| (Per-share) Unit: JPY | |||||||||
| EPS | -9.3 | 0.9 | -17.5 | -4.5 | -1.6 | 1.3 | 3.8 | 3.3 | -2.0 |
| BPS | 30.0 | 37.6 | 21.4 | 18.1 | 21.1 | 25.9 | 32.2 | 43.0 | 44.1 |
| Dividend per Share | 0.00 | 0.00 | 0.00 | 0.00 | 0.00 | 0.00 | 0.00 | 0.00 | 0.00 |
| Shares Outstanding (milion shares) | 37.09 | 37.31 | 38.43 | 39.41 | 40.66 | 40.66 | 43.88 | 47.63 | 49.56 |
Source: Omega Investment from company data, rounded to the nearest whole number
Financial data (full-year basis)
| Unit: million yen | 2015 | 2016 | 2017 | 2018 | 2019 | 2020 | 2021 | 2022 | 2023 | 2024 |
| (Income Statement) | ||||||||||
| Sales | 1,161 | 1,089 | 1,060 | 1,022 | 1,078 | 997 | 1,569 | 2,776 | 2,431 | 5,082 |
| Year-on-year | 1817.7% | -6.2% | -2.7% | -3.6% | 5.5% | -7.5% | 57.5% | 76.9% | -12.4% | 109.0% |
| Cost of Goods Sold | 501 | 398 | 423 | 413 | 653 | 120 | 553 | 1,251 | 1,393 | 3,443 |
| Gross Income | 660 | 692 | 637 | 609 | 425 | 877 | 1,017 | 1,525 | 1,038 | 1,639 |
| Gross Income Margin | 56.9% | 63.5% | 60.1% | 59.6% | 39.4% | 88.0% | 64.8% | 54.9% | 42.7% | 32.3% |
| SG&A Expense | 1,480 | 1,876 | 1,551 | 1,414 | 1,586 | 1,847 | 1,992 | 2,076 | 2,374 | 1,611 |
| EBIT (Operating Income) | -820 | -1,184 | -913 | -806 | -1,161 | -970 | -976 | -551 | -1,336 | 28 |
| Year-on-year | 129.1% | 44.4% | -22.9% | -11.8% | 44.2% | -16.5% | 0.6% | -43.5% | 142.4% | -102.1% |
| Operating Income Margin | -70.7% | -108.7% | -86.2% | -78.8% | -107.8% | -97.3% | -62.2% | -19.8% | -54.9% | 0.5% |
| EBITDA | -820 | -1,184 | -913 | -805 | -1,161 | -969 | -973 | -550 | -1,335 | 29 |
| Pretax Income | -786 | -1,222 | -903 | -854 | -7,314 | -1,000 | -550 | -656 | -1,421 | 73 |
| Consolidated Net Income | -788 | -1,225 | -905 | -856 | -7,316 | -1,001 | -551 | -657 | -1,422 | -21 |
| Minority Interest | 0 | 0 | 0 | 0 | 0 | 0 | 0 | 0 | 0 | 0 |
| Net Income ATOP | -788 | -1,225 | -905 | -856 | -7,316 | -1,001 | -551 | -657 | -1,422 | -21 |
| Year-on-year | 108.9% | 55.5% | -26.1% | -5.3% | 754.4% | -86.3% | -45.0% | 19.3% | 116.3% | -98.5% |
| Net Income Margin | -67.9% | -112.4% | -85.4% | -83.8% | -678.9% | -100.5% | -35.1% | -23.7% | -58.5% | -0.4% |
| (Balance Sheet) | ||||||||||
| Cash & Deposits | 817 | 2,380 | 1,891 | 2,009 | 2,033 | 1,461 | 1,161 | 1,067 | 2,231 | 2,995 |
| Total assets | 1,694 | 3,706 | 3,025 | 3,151 | 3,592 | 3,934 | 3,470 | 3,895 | 5,086 | 7,008 |
| Total Debt | 810 | 0 | 0 | 0 | 1,225 | 1,100 | 700 | 1,950 | 2,575 | 1,838 |
| Net Debt | -7 | -2,380 | -1,891 | -2,009 | -808 | -361 | -461 | 883 | 344 | -1,157 |
| Total liabilities | 1,291 | 206 | 421 | 420 | 2,105 | 2,324 | 1,767 | 2,661 | 4,254 | 5,598 |
| Total Shareholders’ Equity | 403 | 3,500 | 2,604 | 2,731 | 1,487 | 1,610 | 1,703 | 1,234 | 831 | 1,411 |
| (Cash Flow) | ||||||||||
| Net Operating Cash Flow | -607 | -1,759 | -438 | -860 | -1,325 | -1,267 | -1,170 | -1,421 | -454 | 937 |
| Capital Expenditure | 2 | 0 | 0 | 0 | 2 | 3 | 0 | 0 | 0 | 6 |
| Net Investing Cash Flow | -122 | -150 | -50 | -0 | -137 | -22 | 527 | -29 | 0 | 65 |
| Net Financing Cash Flow | 947 | 3,472 | 0 | 978 | 1,222 | 718 | 369 | 1,356 | 1,618 | -240 |
| (Profitability ) | ||||||||||
| ROA (%) | -60.21 | -45.35 | -26.88 | -27.73 | -216.99 | -26.61 | -14.88 | -17.85 | -31.67 | -0.35 |
| ROE (%) | -122.00 | -62.74 | -29.64 | -32.10 | -346.86 | -64.66 | -33.25 | -44.78 | -137.73 | -1.89 |
| Net Margin (%) | -67.85 | -112.41 | -85.36 | -83.81 | -678.87 | -100.49 | -35.10 | -23.68 | -58.49 | -0.42 |
| Asset Turn | 0.89 | 0.40 | 0.31 | 0.33 | 0.32 | 0.26 | 0.42 | 0.75 | 0.54 | 0.84 |
| Assets/Equity | 2.03 | 1.38 | 1.10 | 1.16 | 1.60 | 2.43 | 2.23 | 2.51 | 4.35 | 5.39 |
| (Per-share) Unit: JPY | ||||||||||
| EPS | -75.7 | -68.5 | -47.3 | -43.8 | -264.7 | -34.8 | -17.9 | -20.8 | -40.2 | -0.5 |
| BPS | 34.9 | 182.9 | 136.1 | 134.3 | 53.8 | 54.4 | 54.2 | 38.5 | 21.4 | 32.2 |
| Dividend per Share | 0.00 | 0.00 | 0.00 | 0.00 | 0.00 | 0.00 | 0.00 | 0.00 | 0.00 | 0.00 |
| Shares Outstanding (million shares) | 10.85 | 18.74 | 19.14 | 19.68 | 27.65 | 29.06 | 31.44 | 31.90 | 37.31 | 40.66 |
Source: Omega Investment from company data, rounded to the nearest whole number