2026-07-09
Home
Japanese

Omega Investment Co., Ltd.
Chiome Bioscience (Investment report – 4Q update)
| Share price (3/2) | ¥109 | Dividend Yield (26/12 CE) | – % |
| 52weeks high/low | ¥105/172 | ROE(25/12 act) | -65.1 % |
| Avg Vol (3 month) | 670.8 thou shrs | Operating margin (TTM) | -165.1 % |
| Market Cap | ¥7.57 bn | Beta (5Y Monthly) | 0.4 |
| Enterprise Value | ¥6.41 bn | Shares Outstanding | 69.453 mn shrs |
| PER (26/12 CE) | – X | Listed market | TSE Growth |
| PBR (25/12 act) | 6.7 X |
| Click here for the PDF version of this page |
| PDF version |
Neutral stance maintained; visualization of earnings from drug discovery is the turning point for the share price.
Investment conclusion
Chiome Bioscience Inc. (the “Company”) maintains the same basic stance on its shares as in the previous report, namely “neutral to slightly bullish.” In terms of investment behavior, the basic approach is an event-driven style in which investors identify events that directly translate into earnings, such as progress in out-licensing and joint development, monetization of IDD projects, and business progress related to biosimilars, and gradually build positions when the share price corrects. Currently, quantitative indicators are a market capitalization of 7.7 billion yen, an actual PBR of 7.04x, ROE of −64.6%, ROIC of −61.0%, net cash of 943 million yen, and a beta of 1.26; the structure of a high PBR despite losses remains unchanged. As long as share price drivers are limited to progress reports, the upside to the share price is likely to remain substantial, and to lift the valuation range by one notch, it is essential to have disclosures from which the terms of contracts and the timing of contributions to sales and profits can be read.
In addition, in the current fiscal year, factors related to supply and demand in share trading are likely to influence investment decisions. Specifically, the Company has issued stock acquisition rights with a price-adjustment clause, with Growth Capital as the scheduled allottee, and it has been indicated that the scheduled allottee will repeatedly recover funds by selling in the market the shares acquired upon exercise of the rights. The higher the share price rises, the more additional supply is likely to be perceived; in the short term, this structure makes it easy for upside to be capped during rebound phases. Accordingly, rather than chasing the upside based on the story alone, it is easier from a risk management perspective to purchase shares after checking the contents of financial results announcements and timely disclosures when the share price corrects, or to observe the share price reaction after announcements and adjust positions based on that.
The previous investment conclusion rested on three pillars: (1) continued narrowing of losses through cost optimization; (2) progress in external validation of the platform as external alliances increase; and (3) upward movement of the share price range if signals at the early clinical stage accumulate. Among these, the foundation-building aspects of business operations—cost optimization and expansion of partnerships—are generally progressing as expected, but our current view is that a clear upward shift in the share price range is unlikely unless the visibility of monetization improves. In other words, while we can positively evaluate the very model in which the Company deploys its antibody creation platform, its strength, horizontally across drug discovery, drug discovery support, and IDD, what the market focuses on above all else is simply when, how much, and under which profit-and-loss line items revenue will be booked. From a longer-term perspective, the Company is now in a stage where the seeding phase is beginning to provide visibility into monetization and whether it can create a structure in which out-licensing and deal formation occur in succession, with 1.205 billion yen in cash as the valuation dividing line. In addition, as long as the weight on supply–demand persists, the conditions for breaking out of the range to the upside will be that disclosures appear from which earnings terms can be seen in drug discovery, and that a sense of reassurance on the cash front is obtained at the same time. The most realistic stance is to adjust positions while waiting for confirmation of these.
◇ Highlights of results for FY12/2026: sales declined due to a reactionary decrease in upfront income, but R&D expenses were contained, and the loss was narrowed
In FY12/2025, although net sales decreased to 593 million yen (781 million yen in the previous fiscal year), the operating loss improved to 979 million yen (1.03 billion yen in the previous fiscal year), and the loss was narrowed. The primary reason for the decline in net sales is that the upfront payment from a license agreement that was booked in the previous fiscal year was absent in the current fiscal year, and its absence directly reduced sales. The decline in sales in the current fiscal year is mainly due to this year-on-year peak-and-trough effect, and there is no need to casually link it to a deterioration in the Company’s underlying earning power.
Improvements on the cost side drove the narrowing of the loss. R&D expenses decreased to 776 million yen (936 million yen in the previous fiscal year), and the decline in booked costs, such as manufacturing expenses for clinical trial drugs, increased earnings. For companies whose net sales are easily affected by lump-sum income, the key consideration is not the fluctuations in sales but whether expenses and cash consumption are being controlled. In this respect, the current fiscal year’s results can be described as those of a year in which defensive management functioned.
By segment, external customer sales were 0 million yen in the drug discovery & development business and 593 million yen in the drug discovery support business, with net sales concentrated in the drug discovery support. In terms of profit, the drug discovery support business recorded a segment profit of 356 million yen. In contrast, the drug discovery & development business recorded a segment loss of 777 million yen, indicating that the structure is one in which the drug discovery support business earns profit and the drug discovery & development business is an investment. Net sales in drug discovery support exceeded the Company’s plan of 500 million yen by 93 million yen, with revenue from biosimilar-related work as the primary driver. In addition, revenue recognition for drug discovery support net sales is disclosed as 190 million yen for goods or services transferred at a point in time and 403 million yen for goods or services transferred over time, indicating a substantial level of recurring revenue.
However, a sense of tension regarding cash management remains. Cash and cash equivalents at the end of the period were 1.205 billion yen, a decrease of 858 million yen from the end of the previous fiscal year, and operating cash flow also remained negative at minus 936 million yen. As long as funds continue to decline, even if losses are being narrowed, the equity market is likely to remain cautious. The conditions under which the market will next change its evaluation are the following three points: (1) whether restraint on R&D expenses will continue in the next fiscal year; (2) whether the upside in drug discovery support will be reproduced; and (3) whether disclosures will be made in drug discovery that show the earnings terms and timing of recognition.
A combination of a reactionary decline in upfront payments and expense containment can explain the results for the current fiscal year. The next points of focus are whether the upside in drug discovery support will continue and whether disclosures in drug discovery will show the earnings terms and the timing of recognition.
◇ Segment analysis: earnings are concentrated in drug discovery support, while drug discovery is at a front-loaded investment stage toward out-licensing
The Company’s reportable segments consist of two pillars, the “drug discovery & development business” and the “drug discovery support business.” In FY12/2025, the structure became even clearer: drug discovery support generates almost all external net sales and profit, while drug discovery is ahead in research and development investment. The Company states that, in the drug discovery & development , it advances research and development of antibody drugs with the goal of out-licensing, and, in the drug discovery support business, it aims to generate revenue by providing services that support external drug discovery research.
・Drug discovery & development business: a business that develops antibody drugs in disease areas with high unmet medical needs and aims to obtain upfront payments, milestone income, and royalty income through out-licensing of patent rights and other rights related to the antibodies.
・Drug discovery support business: a business that supports drug discovery research at pharmaceutical companies, diagnostic drug companies, universities, and other organizations, and earns service fee income by generating antibodies and providing related services using the Company’s antibody generation technologies and other capabilities.
In FY12/2025, external customer net sales were 0 million yen (202 million yen in the previous fiscal year) in the drug discovery & development business and 593 million yen (577 million yen in the previous fiscal year) in the drug discovery support business, and in terms of sales composition, the drug discovery support business accounted for 100%. On the profit side, segment profit in the drug discovery support business increased to 356 million yen (310 million yen in the previous fiscal year). In contrast, the drug discovery & development business continued to run a deficit, with a segment loss of 777 million yen (814 million yen in the previous fiscal year).
◇ Forecast for FY12/2025: focus on company-wide return to profitability, with 600 million yen in drug discovery support at the core
In the Company’s disclosures for FY12/2026, only net sales of 600 million yen are disclosed for the drug discovery support business, and company-wide forecasts of net sales and profit, including the drug discovery & development business, have not been announced. The Company’s position is that it is currently difficult to estimate business forecasts for the drug discovery & development business reasonably, and the framework for the next fiscal year will also depend on events that directly lead to monetization in drug discovery, which remain uncertain. What is important is that the more limited the disclosures, the more easily the share price tends to run ahead of fundamentals, and the presence or absence of events determines the share price range.
In numerical terms, net sales in drug discovery support in FY12/2025 were 593 million yen, exceeding the Company’s plan of 500 million yen by 93 million yen. The forecast of 600 million yen for the next fiscal year is a plan that will slightly add to this level of actual results while essentially maintaining it. What will be noteworthy in the next fiscal year is not simply whether this forecast is reached, but the reproducibility of whether revenue from biosimilar-related business, which is cited as the upside factor this time, will contribute in the same way next fiscal year as well. If it is reproduced, the resilience of drug-discovery support will increase, and it will be possible to partially mitigate uncertainty in drug discovery. If this year’s upside proves to be a one-off, the achievement of 600 million yen will be more susceptible to the timing of individual projects.
In the revenue recognition breakdown, net sales in drug discovery support in FY12/2025 are reported as 190 million yen at a point in time and 403 million yen over time. These data indicate that delivery-type and recurring-type businesses are mixed, and that the probability of achieving next year’s target is likely to be affected not only by the buildup of recurring-type business but also by the timing of projects booked at a point in time. As long as company-wide revenue forecasts are not disclosed, the key evaluation criteria can be distilled into two points: whether downside risk in drug discovery support can be contained, and whether contracts in drug discovery yield visible revenue. In addition, operating cash flow in FY12/2025 was negative 935 million yen, and cash consumption continues. There are limits to how much profit improvement can be achieved in the next fiscal year through cost control alone, and the structure under which results ultimately depend on the extent to which revenue-linked drivers, such as out-licensing in drug discovery and the conclusion of joint development contracts, are concretized will continue to influence outcomes.
Since the only disclosed forecast is 600 million yen in drug discovery support, the share price is likely to be sensitive to news that directly ties into earnings in drug discovery. Whether the upside factors in drug discovery continue to support, and whether disclosures emerge from drug discovery that indicate the terms and timing of recognition, will be the points of divergence.
◇ Share price trend and points of focus going forward: supply–demand from capital increases and exercise of rights is capping the upside; breakout above the share price range awaits drug discovery catalysts with visible earnings terms
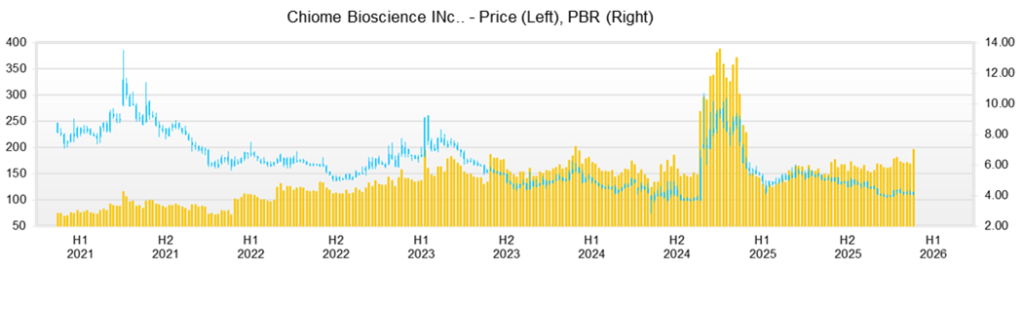
Over the past three months, the share price has been in a period of waiting for catalysts, with progress in financing and, in particular, the exercise of rights tending to act as a ceiling on supply and demand. The share price fell from 128 yen at the close on November 4, 2025, to 114 yen at the close on February 12, 2026; the high in this period was 136 yen on November 11, the year-to-date low was 105 yen on December 26, and the closing price on that day was 106 yen. PBR was 7.05x on February 12, and the shares are valued at a high PBR despite the Company being in a loss-making phase.
The share price tends to react sensitively to financing and concerns about dilution. On November 28, 2025, the Company issued its 23rd series of stock acquisition rights, with Growth Capital as the scheduled allottee, and disclosed a design under which the number of potential shares was 13,610,000. The exercise price would be adjusted to 92% of the closing price immediately before exercise. Because this evoked an increase in future share supply, the share price closed at 116 yen on the next trading day, December 1, a decline of 7.94% from the closing price of 126 yen on November 28, and trading volume surged to 1,560,900 shares. These data confirm that the market is discounting an increase in future supply in advance.
What is important here is the positioning of Growth Capital as the investor at the center of the supply–demand balance. It is the scheduled allottee of the 23rd series of stock acquisition rights, and the design is that the exercise price will be adjusted to 92% of the closing price. Furthermore, the Company’s disclosure clearly states that the allottee will basically exercise the rights and repeatedly recover funds by selling the acquired shares. In other words, the structure is such that the higher the share price rises, the more likely sales will be envisaged. In addition, a large shareholding report indicates a holding ratio of 16.67%, and its presence as a major shareholder has become more visible.
From a technical standpoint, the share price is trading within a range, with approximately 105 yen as the lower bound and the low 120 yen level as the ceiling. First, 105 yen is the low on December 26; if this level is breached, selling pressure tends to emerge, and the share price can easily move downward. The upside is heavy around 120 yen. In fact, the closing prices were 120 yen on January 19, 119 yen on January 20, and 118 yen on February 10; even when the price rises, it tends to stop around 120 yen, with selling on rebounds. Accordingly, investment ideas are likely to be narrowed down to two. (1) Buy after confirming that the share price has fallen to around 105 yen and has found support; or (2) follow through after confirming that the share price has clearly closed above the 120 yen level and has broken out of the range.
In the disclosures, it is assumed that the scheduled allottee will dispose of the shares it acquires in the market after exercise and recover the funds; therefore, in the short term, the upside is likely to be capped from a supply–demand perspective. The keys to a breakout above the range are that disclosures appear in drug discovery from which earning terms, such as upfront payments and milestones, and the timing of recognition can be read, and that a slowdown in cash consumption can be confirmed.
Company profile
◇ A biotech venture that combines drug discovery and drug discovery support, with an antibody creation platform at its core
Chiome Bioscience Inc. is a biotech venture that positions its proprietary antibody creation technologies and antibody engineering platform as the core of its competitiveness and runs a dual-track business model that combines (1) a drug discovery model, in which it develops antibody drug pipelines on its own or jointly and aims to obtain upfront payments, milestones, and royalties through licensing out to pharmaceutical companies and others, and (2) a drug discovery support model, in which it undertakes antibody generation, optimization, evaluation, and other work on a contract basis and covers its research and development expenses. In drug discovery, earnings can fluctuate significantly depending on the success or failure of clinical and out-licensing events. In contrast, on the drug discovery support side, revenue is determined by project acquisition capability, utilization, and unit prices. Hence, the Company seeks to maximize capital efficiency and growth opportunities by operating both wheels in parallel. As for its corporate profile, the Company was established in February 2005, is represented by Masamichi Koike, and had 64 employees as of December 31, 2025.
Key financial data
| Unit: million yen | 2021 | 2022 | 2023 | 2024 | 2025 | 2026 CE |
| Sales | 713 | 631 | 682 | 781 | 593 | NA |
| EBIT (Operating Income) | -1,334 | -1,259 | -1,205 | -1,031 | -980 | NA |
| Pretax Income | -1,466 | -1,238 | -1,215 | -1,018 | -980 | NA |
| Net Profit Attributable to Owner of Parent | -1,480 | -1,243 | -1,220 | -1,021 | -983 | NA |
| Cash & Short-Term Investments | 1,791 | 1,727 | 1,326 | 2,063 | 1,205 | |
| Total assets | 2,339 | 2,215 | 1,751 | 2,469 | 1,728 | |
| Total Debt | 183 | 184 | 291 | 282 | 262 | |
| Net Debt | -1,608 | -1,543 | -1,035 | -1,782 | -943 | |
| Total liabilities | 446 | 425 | 594 | 549 | 605 | |
| Total Shareholders’ Equity | 1,893 | 1,791 | 1,158 | 1,920 | 1,122 | |
| Net Operating Cash Flow | -1,131 | -1,191 | -1,069 | -1,001 | -936 | |
| Capital Expenditure | 0 | 0 | 0 | 0 | 40 | |
| Net Investing Cash Flow | -35 | 0 | 0 | 0 | -55 | |
| Net Financing Cash Flow | 271 | 1,127 | 667 | 1,738 | 133 | |
| ROA (%) | -50.73 | -54.57 | -61.51 | -48.37 | -46.84 | |
| ROE (%) | -59.16 | -67.48 | -82.76 | -66.33 | -64.61 | |
| EPS (Yen) | -36.7 | -28.3 | -24.6 | -17.5 | -14.5 | |
| BPS (Yen) | 46.4 | 37.0 | 22.0 | 28.7 | 16.4 | |
| Dividend per Share (Yen) | 0.00 | 0.00 | 0.00 | 0.00 | 0.00 | 0.00 |
| Shares Outstanding (Million shares) | 40.31 | 48.42 | 52.19 | 66.97 | 68.05 |
Source: Omega Investment from company data, rounded to the nearest whole number.
Share price
Key stock price data
Financial data (quarterly basis)
| Unit: million yen | 2023/12 | 2024/12 | 2025/12 | ||||||
| 4Q | 1Q | 2Q | 3Q | 4Q | 1Q | 2Q | 3Q | 4Q | |
| (Income Statement) | |||||||||
| Sales | 158 | 130 | 134 | 159 | 358 | 139 | 113 | 118 | 223 |
| Year-on-year | -19.6% | -23.5% | -29.2% | -3.8% | 126.1% | 7.0% | -15.7% | -25.7% | -37.6% |
| Cost of Goods Sold (COGS) | 67 | 73 | 56 | 74 | 145 | 58 | 55 | 53 | 72 |
| Gross Income | 92 | 57 | 78 | 85 | 213 | 81 | 58 | 65 | 151 |
| Gross Income Margin | 57.8% | 44.0% | 58.0% | 53.4% | 59.5% | 58.1% | 51.5% | 55.3% | 67.8% |
| SG&A Expense | 391 | 379 | 337 | 425 | 323 | 345 | 330 | 334 | 326 |
| EBIT (Operating Income) | -300 | -322 | -259 | -340 | -110 | -265 | -272 | -269 | -174 |
| Year-on-year | 36.7% | 42.6% | -40.2% | 38.1% | -63.3% | -17.9% | 5.1% | -21.0% | 58.7% |
| Operating Income Margin | -189.3% | -248.5% | -193.1% | -213.9% | -30.7% | -190.7% | -240.7% | -227.5% | -78.1% |
| EBITDA | -300 | -322 | -259 | -340 | -110 | -265 | -272 | -267 | -172 |
| Pretax Income | -300 | -303 | -259 | -351 | -105 | -265 | -273 | -259 | -182 |
| Net Income | -302 | -304 | -260 | -352 | -105 | -266 | -274 | -260 | -183 |
| Net Income ATOP | -302 | -304 | -260 | -352 | -105 | -266 | -274 | -260 | -183 |
| Year-on-year | 40.1% | 33.5% | -40.4% | 38.0% | -65.1% | -12.5% | 5.5% | -26.1% | 73.4% |
| Net Income Margin | -190.3% | -234.5% | -193.9% | -221.2% | -29.4% | -191.8% | -242.5% | -220.3% | -81.7% |
| (Balance Sheet) | |||||||||
| Cash & Short-Term Investments | 1,326 | 1,325 | 1,104 | 1,241 | 2,063 | 1,819 | 1,475 | 1,006 | 1,205 |
| Total assets | 1,751 | 1,754 | 1,557 | 1,694 | 2,469 | 2,205 | 1,963 | 1,549 | 1,728 |
| Total Debt | 291 | 314 | 292 | 303 | 282 | 282 | 261 | 79 | 262 |
| Net Debt | -1,035 | -1,012 | -812 | -938 | -1,782 | -1,537 | -1,214 | -926 | -943 |
| Total liabilities | 594 | 506 | 487 | 478 | 549 | 443 | 443 | 299 | 605 |
| Total Shareholders’ Equity | 1,158 | 1,248 | 1,071 | 1,216 | 1,920 | 1,761 | 1,519 | 1,250 | 1,122 |
| (Profitability %) | |||||||||
| ROA | -61.51 | -67.53 | -69.09 | -70.61 | -48.37 | -49.66 | -56.65 | -55.84 | -46.84 |
| ROE | -82.76 | -92.28 | -101.15 | -100.30 | -66.33 | -65.33 | -77.00 | -73.45 | -64.61 |
| (Per-share) Unit: JPY | |||||||||
| EPS | -5.8 | -5.6 | -4.6 | -6.1 | -1.7 | -3.9 | -4.0 | -3.8 | -2.7 |
| BPS | 22.0 | 22.4 | 19.0 | 19.9 | 28.7 | 26.0 | 22.3 | 18.4 | 16.4 |
| Dividend per Share | 0.00 | 0.00 | 0.00 | 0.00 | 0.00 | 0.00 | 0.00 | 0.00 | 0.00 |
| Shares Outstanding (million shares) | 52.19 | 55.40 | 56.39 | 61.24 | 66.97 | 67.77 | 68.05 | 68.05 | 68.05 |
Source: Omega Investment from company materials
Financial data (full-year basis)
| Unit: million yen | 2016/12 | 2017/12 | 2018/12 | 2019/12 | 2020/12 | 2021/12 | 2022/12 | 2023/12 | 2024/12 | 2025/12 |
| (Income Statement) | ||||||||||
| Sales | 252 | 260 | 213 | 448 | 481 | 713 | 631 | 682 | 781 | 593 |
| Year-on-year | -10.0% | 3.0% | -18.1% | 110.3% | 7.4% | 48.3% | -11.5% | 8.2% | 14.4% | -24.0% |
| Cost of Goods Sold | 228 | 94 | 107 | 167 | 238 | 292 | 283 | 285 | 349 | 238 |
| Gross Income | 25 | 166 | 106 | 281 | 243 | 421 | 348 | 398 | 432 | 356 |
| Gross Income Margin | 9.7% | 64.0% | 49.6% | 62.7% | 50.5% | 59.0% | 55.1% | 58.3% | 55.3% | 59.9% |
| SG&A Expense | 1,067 | 1,054 | 1,645 | 1,683 | 1,526 | 1,755 | 1,606 | 1,603 | 1,463 | 1,335 |
| EBIT (Operating Income) | -1,042 | -888 | -1,539 | -1,402 | -1,284 | -1,334 | -1,259 | -1,205 | -1,031 | -980 |
| Year-on-year | -17.9% | -14.8% | 73.4% | -8.9% | -8.4% | 3.9% | -5.7% | -4.2% | -14.5% | -5.0% |
| Operating Income Margin | -413.3% | -341.6% | -723.1% | -313.2% | -266.9% | -187.2% | -199.5% | -176.6% | -132.0% | -165.1% |
| EBITDA | -929 | -877 | -1,532 | -1,397 | -1,280 | -1,331 | -1,257 | -1,204 | -1,030 | -976 |
| Pretax Income | -1,501 | -880 | -1,531 | -1,401 | -1,291 | -1,466 | -1,238 | -1,215 | -1,018 | -980 |
| Net Income | -1,491 | -883 | -1,534 | -1,404 | -1,294 | -1,480 | -1,243 | -1,220 | -1,021 | -983 |
| Net Income ATOP | -1,491 | -883 | -1,534 | -1,404 | -1,294 | -1,480 | -1,243 | -1,220 | -1,021 | -983 |
| Year-on-year | 16.3% | -40.8% | 73.8% | -8.5% | -7.8% | 14.4% | -16.0% | -1.8% | -16.3% | -3.7% |
| Net Income Margin | -591.2% | -339.6% | -720.5% | -313.6% | -269.1% | -207.6% | -197.0% | -178.8% | -130.7% | -165.6% |
| (Balance Sheet) | ||||||||||
| Cash & Short-Term Investments | 4,553 | 4,027 | 2,329 | 2,106 | 2,686 | 1,791 | 1,727 | 1,326 | 2,063 | 1,205 |
| Total assets | 4,789 | 4,419 | 2,831 | 2,808 | 3,495 | 2,339 | 2,215 | 1,751 | 2,469 | 1,728 |
| Total Debt | 54 | 4 | 0 | 0 | 180 | 183 | 184 | 291 | 282 | 262 |
| Net Debt | -4,499 | -4,023 | -2,329 | -2,106 | -2,506 | -1,608 | -1,543 | -1,035 | -1,782 | -943 |
| Total liabilities | 224 | 202 | 154 | 187 | 385 | 446 | 425 | 594 | 549 | 605 |
| Total Shareholders’ Equity | 4,565 | 4,218 | 2,677 | 2,622 | 3,110 | 1,893 | 1,791 | 1,158 | 1,920 | 1,122 |
| (Cash Flow) | ||||||||||
| Net Operating Cash Flow | -970 | -867 | -1,689 | -1,537 | -1,360 | -1,131 | -1,191 | -1,069 | -1,001 | -936 |
| Capital Expenditure | 11 | 5 | 0 | 0 | 0 | 0 | 0 | 0 | 0 | 40 |
| Net Investing Cash Flow | 1,989 | -137 | 0 | -26 | -4 | -35 | 0 | 0 | 0 | -55 |
| Net Financing Cash Flow | 1,434 | 479 | -10 | 1,341 | 1,944 | 271 | 1,127 | 667 | 1,738 | 133 |
| (Profitability ) | ||||||||||
| ROA (%) | -30.72 | -19.17 | -42.30 | -49.79 | -41.06 | -50.73 | -54.57 | -61.51 | -48.37 | -46.84 |
| ROE (%) | -32.67 | -20.10 | -44.49 | -52.99 | -45.15 | -59.16 | -67.48 | -82.76 | -66.33 | -64.61 |
| Net Margin (%) | -591.23 | -339.59 | -720.46 | -313.65 | -269.06 | -207.58 | -197.03 | -178.77 | -130.73 | -165.65 |
| Asset Turn | 0.05 | 0.06 | 0.06 | 0.16 | 0.15 | 0.24 | 0.28 | 0.34 | 0.37 | 0.28 |
| Assets/Equity | 1.06 | 1.05 | 1.05 | 1.06 | 1.10 | 1.17 | 1.24 | 1.35 | 1.37 | 1.38 |
| (Per-share) Unit: JPY | ||||||||||
| EPS | -65.9 | -33.5 | -57.3 | -44.6 | -36.1 | -36.7 | -28.3 | -24.6 | -17.5 | -14.5 |
| BPS | 179.3 | 157.5 | 99.9 | 78.8 | 78.7 | 46.4 | 37.0 | 22.0 | 28.7 | 16.4 |
| Dividend per Share | 0.00 | 0.00 | 0.00 | 0.00 | 0.00 | 0.00 | 0.00 | 0.00 | 0.00 | 0.00 |
| Shares Outstanding (million shares) | 25.31 | 26.78 | 26.78 | 33.28 | 39.51 | 40.31 | 48.42 | 52.19 | 66.97 | 68.05 |
Source: Omega Investment from company materials