2026-03-30
Home
Japanese

Omega Investment Co., Ltd.
f-code (Investment report – 3Q update)
| Share price (12/17) | ¥1,433 | Dividend Yield (25/12 CE) | 0.0 % |
| 52weeks high/low | ¥1,136/2,985 | ROE(24/12) | 18.3 % |
| Avg Vol (3 month) | 193.2 thou shrs | Operating margin (TTM) | 27.9 % |
| Market Cap | ¥17.78 bn | Beta (5Y Monthly) | 1.62 |
| Enterprise Value | ¥21.19 bn | Shares Outstanding | 12.409 mn shrs |
| PER (25/12 CE) | 13.5 X | Listed market | TSE Growth |
| PBR (24/12 act) | 2.5 X |
| Click here for the PDF version of this page |
| PDF version |
The medium- to long-term bullish stance remains intact: the current weakness provides a good opportunity to add positions
◇ Investment conclusion: The share price has declined significantly following a correction from the August high. While mindful of the short-term downside from rising financial leverage and earnings volatility, it is reasonable to increase holdings in stages based on the medium- to long-term growth story.
The share price has been in a correction phase since the August high and is currently forming a significant dip. Given market concerns about financial leverage and earnings volatility, some short-term downside risk cannot be ruled out. However, given a bullish stance grounded in the medium- to long-term growth story, we consider it reasonable to take advantage of the current dip to increase holdings. Cumulative revenue for the first three quarters came in at 8.402 billion yen (+173% YoY), with operating profit of 1.811 billion yen (+91% YoY), reflecting continued strong growth. Progress against the revised full-year plan (revenue of 11.5 billion yen, operating profit of 2.3 billion yen) stands at 73.1% and 78.8%, respectively, which are sufficiently high. Backed by growth in DX and AI human resource education and cross-selling across group companies, the Company has revised its full-year earnings forecast by +15% for revenue and +4.5% for operating profit, meaning the upside in earnings we anticipated in the previous report has materialized.
In the investment conclusion at the time of the previous second quarter, we evaluated the contribution from the trinity model of SaaS, AI, and education centered on the web customer service tool “CODE Marketing Cloud” and M&A, and, based on second-quarter progress (52% for revenue and 54% for operating profit), adopted a bullish view on achieving and exceeding the full-year plan. In the current results, the full-year operating profit of approximately 320 million yen from three school-type companies is assumed to be added, and the main reasons cited for the upward revision are the expansion of the DX and AI education domain and stronger-than-expected growth and cross-selling among group companies. We can therefore conclude that the current third-quarter results broadly support the growth drivers outlined in the previous report. In addition, we evaluated the Company’s stance of “winning with base earnings” through fair value remeasurement of contingent consideration and goodwill impairment under IFRS, and this has also been substantiated at the time of these results by the fact that other income of 864 million yen and other expenses of 471 million yen are recorded while maintaining the operating margin, incorporating conservative accounting treatment.
On the other hand, in the previous report, we expected that the parallel implementation of share buybacks and interest-bearing financing would support a share price premium both in terms of supply–demand and growth investment, and we assumed an early re-rating triggered by KPI disclosure and upward revisions. In reality, however, the share price has corrected by around 30% from the year-to-date high of 2,985 yen (August 15) to around 2,020 yen recently. Despite strong earnings and an upward revision, valuation has fallen to a forward PER of 13.88x and PBR of 2.64x. We infer that this is mainly because, in addition to the Company having effectively shifted to a net debt position with negative net cash of 5.03 billion yen, the increase in goodwill from M&A has heightened investors’ perception of risk. The Company explains its financial soundness by dividing goodwill into “confirmed goodwill” (about 70% of the total, expected to be recovered within about 3.5 years based on the latest EBITDA level) and “unconfirmed goodwill,” where the latter is structured so that payment obligations do not arise if performance falls short. Nevertheless, there remains a gap between the Company’s explanations and market understanding at present.
Taking the above into account, the combination of the Company’s SaaS product portfolio and DX and AI education, expansion of the business portfolio through roll-up M&A, and high profitability with ROE of 18.27% and ROIC of 9.19% has been maintained, and the fundamental assumptions underlying our previous bullish view have, if anything, been reinforced. At the same time, however, higher leverage and a rising ratio of intangible assets are currently capping the multiples.
Accordingly, we position f-code as having moved from the rapid growth phase after its IPO to a stage where the market demands a balance between expansion and financial discipline. From a medium-term perspective, if stable trends in net debt and the net debt/EBITDA multiple, continued disclosure of goodwill-related KPIs, and sustained high growth in the AI and education domains can be confirmed, we believe there is substantial room for a renewed re-rating. From an investment action standpoint, rather than expecting a short-term share price rebound, a rational approach is to build positions in a time-diversified manner during the correction phase and patiently wait for the earnings accumulation to be reflected in the share price.
◇ Highlights of 3Q FY2025/12 results: Revenue and profit hit record highs, with high growth and rising leverage progressing in tandem
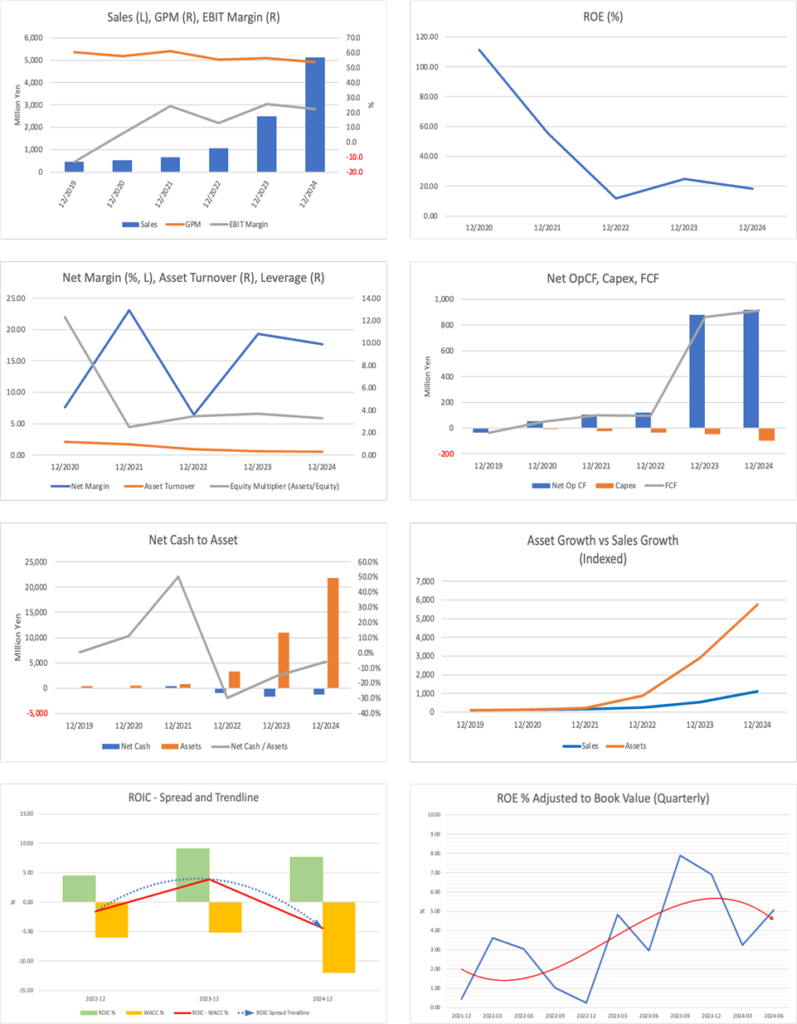
Cumulative results for the first three quarters of FY2025/12 represent aggressive results that combine high growth with profitability. Revenue reached a record high of 8.402 billion yen (+173.0% YoY), operating profit was 1.811 billion yen (+91.5% YoY), and quarterly net income attributable to owners of the parent was 1.035 billion yen (+89.3% YoY), also a record high. Basic earnings per share rose to 84.53 yen. Progress against the initial full-year forecast (revenue of 10.0 billion yen, operating profit of 2.2 billion yen) stands at 84.0% and 82.4%, respectively, which is high. Based on these results, the full-year earnings forecast has been revised upward to revenue of 11.5 billion yen and operating profit of 2.3 billion yen.
The main drivers of strong results are, in addition to organic growth at existing group companies, M&A in the education and community sectors, and expansion of cross-selling across both the Marketing, AI and technology domains. The three school-type companies are expected to contribute approximately 320 million yen in operating profit on a full-year basis, and Real us, which joined the group in August of the current fiscal year, executed three business acquisitions through roll-up M&A, thereby strengthening its course lineup and production structure. Looking at the profit structure, while continuing aggressive investment with SG&A expenses of 3.685 billion yen against gross profit of 5.103 billion yen, the Company has maintained an operating margin of 21.6%. Other income of 864 million yen and other expenses of 471 million yen include fair value remeasurement of contingent consideration and goodwill impairment under IFRS, but the structure of generating earnings through basic operating profit while absorbing this impact has been maintained.
In terms of financial position, of total assets of 28.652 billion yen (+ 6.964 billion yen from the end of the previous fiscal year), goodwill has reached 13.632 billion yen, accounting for about half. Due to the accumulation of interest-bearing debt and contingent consideration, total liabilities stand at 22.294 billion yen and total equity at 6.358 billion yen, with the equity attributable to owners of the parent ratio falling to 24.9% from 30.7% at the end of the previous fiscal year. Through borrowings of over 6.0 billion yen, recognition of put options, and share buybacks, leverage has increased as a result of prioritizing growth investment and shareholder returns. The Company divides goodwill into “confirmed” and “unconfirmed” portions, explains that the unconfirmed portion is structured so that payment obligations do not arise if performance falls short, and has indicated a policy of using a net debt/EBITDA multiple of within 2.5x as a management guideline, which confirms a particular stance toward risk management.
As of the third quarter, revenue and profit clearly exceed the levels assumed at the beginning of the fiscal year, and the track record toward the medium-term plan is favorable. At the same time, the levels of goodwill and interest-bearing debt have risen another notch. Going forward, when determining position size, it will be essential to consider not only the growth rate but also the progress of M&A investment recovery, trends in the net debt/EBITDA multiple, and the accumulation of operating cash flow.
◇ Segment analysis: Marketing underpins scale, while AI and technology drive high growth and profit
The Company’s earnings structure rests on two pillars: the “Marketing domain,” which underpins revenue scale and stability, and the “AI and technology domain,” which drives high growth and profit growth. In the first three quarters of FY2025/12, revenue totaled 8.402 billion yen, comprising 4.882 billion yen in the Marketing domain (58.1%) and 3.520 billion yen in the AI and technology domain (41.9%). Segment profit of 2.258 billion yen comprises 1.531 billion yen in the Marketing domain (67.8%) and 727 million yen in the AI and technology domain (32.2%), resulting in a balanced structure across both scale and earnings.
The Marketing domain is a broad umbrella encompassing marketing, data science, and product delivery. In addition to web ad operations, SEO, and SNS marketing, the Company provides tools such as chatbots and web customer service, runs initiatives to improve LTV, and offers services ranging from building data analytics platforms to end-to-end implementation. Its clients are primarily corporations, ranging from large companies to SMEs and stores. As a group, recurring revenue from ongoing transactions accounts for 85%, with one-off revenue at 15%, giving the segment a strong stock-type profile. Under the revised full-year plan, the Marketing domain is expected to generate revenue of 6.680 billion yen and segment profit of 2.050 billion yen, both representing strong YoY growth of 169.1% and 155.2%, respectively, thereby forming the foundation of the entire Company.
The AI and technology domain comprises engineering and AI services that support corporate DX and advanced digitalization. The Company provides generative AI engineering, AI reskilling training, website production, system and application development, infrastructure construction, and CMS implementation, thereby supporting upgrades to marketing initiatives. Under the revised full-year plan, revenue of 4.820 billion yen and segment profit of 900 million yen are expected, implying extremely high YoY growth rates of 408.6% and 214.5%, respectively. As of the third quarter, revenue progress rates are around 73% across both domains, while segment profit progress is 74.7% in Marketing and 80.8% in AI and technology, with the latter leading on the profit side. Furthermore, in the medium-term management plan, the Company clearly presents a structure in which each domain leverages its respective competitive advantage while enhancing customer value through cross-selling, outlining a growth story that assumes segment synergies.
◇ Earnings outlook: Revised full-year guidance appears highly achievable, and this year will be a touchstone toward 5.0 billion yen in operating profit under the medium-term plan
The revised full-year earnings forecast for FY2025/12 (revenue of 11.5 billion yen, operating profit of 2.3 billion yen) appears highly achievable given progress through the third quarter and the current business environment. Still, it represents a midpoint level relative to the medium-term management plan, “FCODE plan 2027.” Compared with the previous fiscal year, the revised forecast calls for revenue growth of 124.1%, operating profit growth of 72.0%, and net income attributable to owners of the parent of 54.2%, with EPS assumed to grow to 106.2 yen. As of the end of the third quarter, progress stands at 73.1% for revenue and 78.8% for operating profit, which are high levels, and the Company has indicated that these targets are sufficiently achievable.
The Company explains that the drivers of the upward revision are higher revenue from the expansion of the DX and AI human resource education domain, growth at existing group companies, and faster-than-expected cross-selling acceleration. It also describes the revised figures as a conservative level that incorporates growth investment for the next fiscal year, PMI-related costs, and group management costs, leaving some room for upside. By segment, the Company expects revenue of 6.680 billion yen in the Marketing domain and 4.820 billion yen in the AI and technology domain, with both segments at approximately 73% as of the third quarter. On a segment profit basis, total profit for the two domains is planned at 2.950 billion yen, of which 2.050 billion yen is in Marketing and 900 million yen in AI and technology, maintaining a structure in which AI and technology drive profit growth.
From a medium-term perspective, the core of the growth scenario is the “FCODE plan 2027,” which targets revenue of at least 15.0 billion yen, operating profit of at least 5.0 billion yen, and an operating profit CAGR of at least 50% in FY2027/12. Viewed against FY2024/12 results (revenue of 5.1 billion yen and operating profit of 1.4 billion yen), the revised FY2025/12 forecast is a waypoint on the medium-term track for both revenue and profit. It will mark a milestone of non-linear growth over the four years since listing, with revenue increasing by about 17x, operating profit by about 14x, and EBITDA by about 15x. However, since the plan assumes M&A, over the next two years, the Company will need to continue roll-up transactions targeting profitable companies at approximately 5x EV/EBITDA while simultaneously advancing PMI and strengthening group management functions. Regarding goodwill, the Company explains that it is divided into confirmed and unconfirmed portions, and that the latter is structured so that payment obligations do not arise from performance linkage. Nevertheless, unless continued KPI disclosure and cash flow generation accompany the achievement of the full-year forecast, it will be difficult to increase market confidence in the medium-term plan.
The revised guidance for the current fiscal year represents a reasonable range that balances high growth with high profit, and its achievement will further increase the likelihood of achieving an operating profit of 5.0 billion yen under the medium-term plan. At the same time, given that the plan assumes roll-ups and leverage, investors will need to monitor not only the final levels of revenue and profit but also qualitative indicators such as the accumulation of operating cash flow, trends in the net debt/EBITDA multiple, and continued profit contributions from the education and community domains.
While the upward revision to the FY2025 full-year forecast supports the direction of the medium-term plan, the next question is whether growth in both quality and quantity will accompany it. In particular, given that much of the Company’s growth originates from M&A, whether goodwill recoveries and cash flow generation can be confirmed, and whether leverage indicators can be stabilized will be key to the credibility of the 5.0 billion yen operating profit scenario and the Company’s valuation.
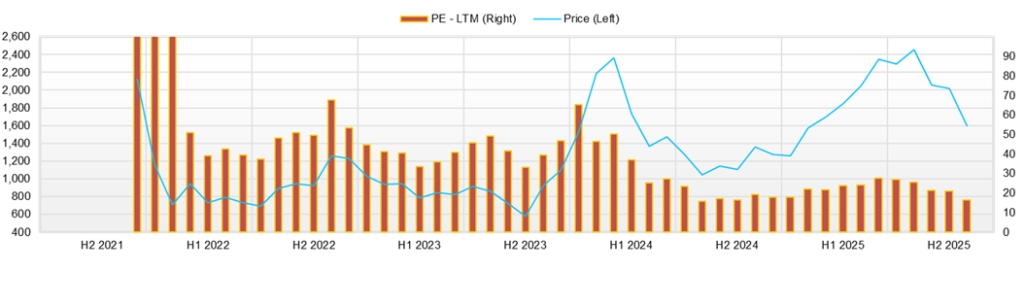
◇ Share price trend and points to watch: Recalibration of valuation under strong results and an upward revision, with focus on the tolerance for leverage
Over the past three months, the share price has been in a period when earnings are strong, but valuation is being recalibrated in light of leverage and intangible assets. With a market capitalization of 19.1 billion yen, a forward PER of 13.88x, PBR of 2.64x, ROE of 18.27%, and ROIC of 9.19%, the current level is neutral to slightly undervalued, given the Company’s high growth and high ROE. At the same time, the negative net cash of 5.03 billion yen indicates that the market recognizes the Company as a growth stock with leverage.
Looking at the share price trend, the year-to-date high was 2,985 yen (August 15). From the closing price of 2,712 yen on the same day, highs and closing prices have trended downward stepwise to 2,458 yen on August 29, 2,239 yen on September 5, 2,215 yen on October 22, 2,103 yen on October 24, and 1,544 yen on November 20. The decline of approximately 43% from the August 15 closing price to the November 20 closing price is substantial, and on a daily chart, the trend is clearly downward. The closing price on November 13, the day before the announcement of third-quarter results and the upward revision to full-year guidance, was 2,020 yen, while the closing price on November 18, the first trading day after the concentration of disclosures, was 1,583 yen, representing a correction of about 22% in just three trading days. The fact that the share price fell sharply despite results and an upward revision that appear to be positive catalysts suggests that the market reassessed the share price by prioritizing concerns over goodwill, contingent consideration, and the level of debt levels over the growth story.
In terms of news flow, on November 7 the Company disclosed the business acquisition of an online course license business by consolidated subsidiary Real us, and on November 14 it announced on the same day its third-quarter financial results summary, financial results presentation materials, supplementary materials on the content and safety of goodwill associated with M&A, and an upward revision to its FY2025/12 full-year earnings forecast. While the upward revisions to revenue and profit are positive on the earnings front, while goodwill was classified into confirmed and unconfirmed portions, it appears that the absolute levels of goodwill and liabilities recognized on the balance sheet and the existence of contingent consideration that could become fixed in the future through performance linkage have been newly recognized, and in the short term these have been priced in as risk factors.
Technically, closing-price highs have been trending downward from the 2,700 yen range in mid-August to 2,458 yen (August 29), 2,239 yen (September 5), 2,215 yen (October 22), 2,103 yen (October 24), and 2,020 yen (November 13). As a result, the 2,000 yen area is likely to be recognized as an upper resistance band in rebound phases, while the low 1,500 yen range is likely to be seen as the recent lower bound. In terms of investment timing, a realistic approach would be to enter in a time-diversified manner during a phase in which a dip is forming with accompanying trading volume in the 1,500–1,700 yen range, and to move to an overweight position in phases where there is progress on additional upward revisions, orders for large AI and education projects, and quantitative disclosure of goodwill recovery KPIs and the net debt/EBITDA multiple. As conditions for moving to an overweight, it will be essential that stabilization of leverage indicators and cash flow recovery from M&A investments be presented as specific indicators.
The recent sharp decline in the share price can be understood not as a deterioration in fundamentals but as the manifestation of a valuation gap regarding goodwill and leverage. If the Company can maintain its high growth potential and ROE levels while further advancing financial risk management and disclosure, we believe there remains substantial room for re-rating from the current level of multiples.
Company profile
◇ SaaS and DX support at the core, expanding business domains through M&A
f-code, Inc. is a rapidly growing company that integrates SaaS products originating from marketing with DX support services and is expanding its business portfolio through M&A. Building on its original business of digital marketing support, the Company has developed a model that supports both corporate digital marketing and DX by combining its own products, such as form optimization and web customer service, with a consulting approach that provides a one-stop service from strategy formulation through to implementation.
The Company was established on March 15, 2006. As of today, it has a group structure comprising 15 companies and approximately 850 officers and employees in total, having expanded its organization in line with its business scale through M&A.
Its mission is to “Create a better world with Marketing Technology.” In an environment where differences in digital technology use directly affect corporate competitiveness, the Company aims to support corporate DX and marketing innovation by providing cutting-edge digital technology and marketing expertise to companies across industries and regions. The number of ongoing client relationships has exceeded 2,000, and the Company is in a growth stage as a marketing tech group serving a broad customer base, ranging from large corporations to medium-sized and small companies.
Key financial data
| Unit: million yen | 2021 | 2022 | 2023 | 2024 | 2025 CE |
| Sales | 661 | 1,072 | 2,482 | 5,131 | 11,500 |
| EBIT (Operating Income) | 160 | 138 | 638 | 1,149 | |
| Pretax Income | 150 | 124 | 605 | 1,323 | 2,100 |
| Net Profit Attributable to Owner of Parent | 152 | 69 | 480 | 906 | 1,300 |
| Cash & Short-Term Investments | 602 | 978 | 4,040 | 6,236 | |
| Total assets | 843 | 3,281 | 10,975 | 21,825 | |
| Total Debt | 178 | 1,961 | 5,721 | 7,527 | |
| Net Debt | -424 | 983 | 1,681 | 1,291 | |
| Total liabilities | 351 | 2,592 | 7,655 | 15,720 | |
| Total Shareholders’ Equity | 492 | 690 | 3,187 | 6,728 | |
| Net Operating Cash Flow | 103 | 121 | 878 | 916 | |
| Capital Expenditure | 24 | 35 | 46 | 99 | |
| Net Investing Cash Flow | -16 | -1,441 | -3,404 | -2,881 | |
| Net Financing Cash Flow | 189 | 1,695 | 5,586 | 4,158 | |
| Free Cash Flow | 100 | 97 | 860 | 911 | |
| ROA (%) | 22.37 | 3.36 | 6.73 | 5.52 | |
| ROE (%) | 55.52 | 11.74 | 24.75 | 18.27 | |
| EPS (Yen) | 18.6 | 8.4 | 23.2 | 77.9 | 106.2 |
| BPS (Yen) | 60.0 | 83.2 | 302.2 | 548.8 | |
| Dividend per Share (Yen) | 0.00 | 0.00 | 0.00 | 0.00 | 0.00 |
| Shares Outstanding (Million shares) | 8.20 | 8.29 | 10.55 | 12.17 |
Source: Omega Investment from company data, rounded to the nearest whole number.
Share price
Key stock price data
Financial data (quarterly basis)
| Unit: million yen | 2023/12 | 2024/12 | 2025/12 | ||||||
| 3Q | 4Q | 1Q | 2Q | 3Q | 4Q | 1Q | 2Q | 3Q | |
| (Income Statement) | |||||||||
| Sales | 716 | 902 | 1,035 | 1,002 | 1,040 | 2,053 | 2,417 | 2,796 | 3,190 |
| Year-on-year | 135.5% | 234.1% | 168.7% | 109.3% | 45.2% | 127.7% | 133.4% | 178.9% | 206.7% |
| Cost of Goods Sold (COGS) | 292 | 423 | 401 | 482 | 475 | 1,050 | 808 | 1,261 | 1,319 |
| Gross Income | 424 | 479 | 635 | 520 | 565 | 1,003 | 1,608 | 1,535 | 1,871 |
| Gross Income Margin | 59.2% | 53.1% | 61.3% | 51.9% | 54.3% | 48.9% | 66.6% | 54.9% | 58.7% |
| SG&A Expense | 237 | 250 | 320 | 310 | 278 | 737 | 1,185 | 1,093 | 1,318 |
| EBIT (Operating Income) | 187 | 229 | 315 | 210 | 287 | 266 | 423 | 442 | 553 |
| Year-on-year | 378.9% | 1675.9% | 181.1% | 91.6% | 53.3% | 16.1% | 34.5% | 110.3% | 92.6% |
| Operating Income Margin | 26.2% | 25.4% | 30.4% | 21.0% | 27.6% | 13.0% | 17.5% | 15.8% | 17.3% |
| EBITDA | 205 | 252 | 356 | 257 | 333 | 292 | 460 | 484 | 600 |
| Pretax Income | 179 | 215 | 296 | 255 | 319 | 383 | 541 | 553 | 587 |
| Consolidated Net Income | 144 | 197 | 191 | 164 | 206 | 327 | 352 | 357 | 381 |
| Minority Interest | -0 | -0 | 8 | 4 | 2 | 15 | 28 | 36 | -8 |
| Net Income ATOP | 144 | 198 | 183 | 160 | 204 | 313 | 325 | 322 | 389 |
| Year-on-year | 654.1% | 3095.2% | 144.6% | 153.9% | 41.4% | 58.1% | 77.6% | 100.5% | 91.1% |
| Net Income Margin | 20.1% | 21.9% | 17.7% | 16.0% | 19.6% | 15.2% | 13.4% | 11.5% | 12.2% |
| (Balance Sheet) | |||||||||
| Cash & Short-Term Investments | 3,887 | 4,040 | 4,937 | 7,233 | 7,021 | 6,236 | 4,969 | 7,206 | 7,867 |
| Total assets | 10,552 | 10,975 | 14,588 | 17,973 | 17,629 | 21,825 | 24,553 | 25,838 | 28,652 |
| Total Debt | 5,649 | 5,721 | 8,430 | 8,484 | 7,988 | 7,527 | 9,155 | 11,104 | 13,312 |
| Net Debt | 1,762 | 1,681 | 3,493 | 1,251 | 967 | 1,291 | 4,187 | 3,898 | 5,446 |
| Total liabilities | 7,437 | 7,655 | 10,980 | 12,424 | 11,803 | 15,720 | 18,607 | 19,755 | 22,294 |
| Total Shareholders’ Equity | 2,981 | 3,187 | 3,408 | 5,988 | 6,277 | 6,728 | 6,619 | 6,741 | 7,134 |
| (Profitability %) | |||||||||
| ROA | 4.67 | 6.73 | 5.94 | 5.45 | 5.29 | 5.24 | 5.12 | 5.31 | 5.83 |
| ROE | 15.61 | 24.75 | 19.01 | 15.58 | 16.09 | 17.34 | 19.97 | 18.27 | 20.11 |
| (Per-share) Unit: JPY | |||||||||
| EPS | 6.9 | 9.4 | 17.3 | 13.2 | 16.8 | 25.5 | 26.4 | 26.3 | 31.9 |
| BPS | 283.5 | 302.2 | 282.1 | 494.5 | 518.3 | 548.8 | 536.8 | 552.5 | 584.3 |
| Dividend per Share | 0.00 | 0.00 | 0.00 | 0.00 | 0.00 | 0.00 | 0.00 | 0.00 | 0.00 |
| Shares Outstanding (million shares) | 10.49 | 10.55 | 10.61 | 12.11 | 12.11 | 12.17 | 12.35 | 12.40 | 12.41 |
Source: Omega Investment from company materials
Financial data (full-year basis)
| Unit: million yen | 2021 | 2022 | 2023 | 2024 |
| (Income Statement) | ||||
| Sales | 661 | 1,072 | 2,482 | 5,131 |
| Year-on-year | 24.3% | 62.3% | 131.5% | 106.7% |
| Cost of Goods Sold | 258 | 479 | 1,084 | 2,379 |
| Gross Income | 403 | 593 | 1,398 | 2,752 |
| Gross Income Margin | 61.0% | 55.3% | 56.3% | 53.6% |
| SG&A Expense | 242 | 455 | 759 | 1,603 |
| EBIT (Operating Income) | 160 | 138 | 638 | 1,149 |
| Year-on-year | 407.6% | -13.9% | 362.0% | 80.0% |
| Operating Income Margin | 24.3% | 12.9% | 25.7% | 22.4% |
| EBITDA | 164 | 172 | 711 | 1,238 |
| Pretax Income | 150 | 124 | 605 | 1,323 |
| Consolidated Net Income | 152 | 69 | 479 | 934 |
| Minority Interest | 0 | 0 | 0 | 28 |
| Net Income ATOP | 152 | 69 | 480 | 906 |
| Year-on-year | 275.3% | -54.5% | 591.7% | 88.8% |
| Net Income Margin | 23.1% | 6.5% | 19.3% | 17.7% |
| (Balance Sheet) | ||||
| Cash & Short-Term Investments | 602 | 978 | 4,040 | 6,236 |
| Total assets | 843 | 3,281 | 10,975 | 21,825 |
| Total Debt | 178 | 1,961 | 5,721 | 7,527 |
| Net Debt | -424 | 983 | 1,681 | 1,291 |
| Total liabilities | 351 | 2,592 | 7,655 | 15,720 |
| Total Shareholders’ Equity | 492 | 690 | 3,187 | 6,728 |
| (Cash Flow) | ||||
| Net Operating Cash Flow | 103 | 121 | 878 | 916 |
| Capital Expenditure | 24 | 35 | 46 | 99 |
| Net Investing Cash Flow | -16 | -1,441 | -3,404 | -2,881 |
| Net Financing Cash Flow | 189 | 1,695 | 5,586 | 4,158 |
| Free Cash Flow | 100 | 97 | 860 | 911 |
| (Profitability ) | ||||
| ROA (%) | 22.37 | 3.36 | 6.73 | 5.52 |
| ROE (%) | 55.52 | 11.74 | 24.75 | 18.27 |
| Net Margin (%) | 23.06 | 6.47 | 19.33 | 17.65 |
| Asset Turn | 0.97 | 0.52 | 0.35 | 0.31 |
| Assets/Equity | 2.48 | 3.49 | 3.68 | 3.31 |
| (Per-share) Unit: JPY | ||||
| EPS | 18.6 | 8.4 | 23.2 | 77.9 |
| BPS | 60.0 | 83.2 | 302.2 | 548.8 |
| Dividend per Share | 0.00 | 0.00 | 0.00 | 0.00 |
| Shares Outstanding (million shares) | 8.20 | 8.29 | 10.55 | 12.17 |
Source: Omega Investment from company materials