2026-03-30
Home
Japanese

Omega Investment Co., Ltd.
Ricksoft (Investment Report – 3Q update)
| Share price (2/13) | ¥955 | Dividend Yield (26/2 CE) | 0.0 % |
| 52weeks high/low | ¥738/1,230 | ROE(25/2 act) | 12.3% |
| Avg Vol (3 month) | 3.5 thou shrs | Operating margin (TTM) | 5.1 % |
| Market Cap | ¥4.34 bn | Beta (5Y Monthly) | 0.17 |
| Enterprise Value | ¥4.4 bn | Shares Outstanding | 4.550 mn shrs |
| PER (26/2 CE) | 13.6 X | Listed market | TSE Growth |
| PBR (25/2 act) | 1.3 X |
| Click here for the PDF version of this page |
| PDF version |
Deep value waiting for management’s next move. Customer advances are accumulating, and capital policy and visualization of earnings KPIs are the key.
◇ Investment conclusion: If not held, initiate a new position; if held, maintain; and on pullbacks, it is reasonable to add gradually.
Ricksoft, Co., Ltd. (hereinafter, “Ricksoft”) has net cash (3.782 billion yen) that is extremely large relative to market capitalization, and the downside for the share price is limited. On the other hand, a near-term step-up in the market’s assessment is unlikely unless there is a shift in capital allocation policy and a quantitative visualization of the revenue-model transformation. Therefore, investment in the shares is such that, if not held, it is reasonable to start new investment from the current level; if held, it is sensible to maintain the position; and for additional investment, it is reasonable to increase the weight on pullbacks gradually. Further investment should be made while confirming the progress of the rerating of the shares.
In the 3Q cumulative period of FY2/2026, net sales grew to 8.071 billion yen (+22.3% YoY), but operating profit was limited to 296 million yen (-3.5% YoY), and the gross profit margin declined to 22.1% (-4.5 pt YoY). The slowdown in profitability is mainly due to soaring license costs, and the fact that service gross profit improvement has fallen short is a drag on share-price valuation. However, contract liabilities have accumulated to 4.127 billion yen (2.352 billion yen at the previous fiscal year-end), and the visible stock of future sales is expanding. In addition, Professional Services sales grew to 1.030 billion yen (+63.6% YoY), and shots consistent with the aim of the structural reform “Reignite2030” that Ricksoft advocates, improving margins in high value-added areas, can also be confirmed. As for capital policy, while the company has conducted share repurchases in the past, they remain small relative to the scale of cash on hand and have not reached a point where the capital structure needs adjustment. Looking ahead, the rerating conditions are expected to be narrowed to: (1) showing a bottoming out in the gross profit margin on a quarterly basis, (2) showing, in a numerical framework, the priority order among share buybacks, dividends, and growth investment, and (3) proving, in orders and sales, the results of alliances including overseas project support (expansion of deal acquisition and delivery capabilities leveraging the capital and business alliance with Vietnam-based BiPlus Software).
◇ FY2/2026 3Q results highlights: Sales maintain high growth, but the gross profit margin declines due to rising license costs. The accumulation of contract liabilities (stock of future sales) is a leading indicator.
It is reasonable to evaluate Ricksoft’s 3Q results of FY2/2026 as follows: sales maintained high growth, but the gross profit margin declined due to rising license costs, and profits were sluggish. Net sales expanded steadily to 8.071 billion yen (+22.3% YoY), but operating profit was 296 million yen (-3.5% YoY), ordinary profit was 273 million yen (-13.6% YoY), and quarterly net income attributable to owners of the parent was 211 million yen (-13.3% YoY), resulting in profit declines.
The bottleneck on the profit side is gross profit. Gross profit was limited to a slight increase of 1.782 billion yen (+1.6% YoY), and the gross profit margin declined to 22.1% (-4.5 pt YoY). The factor is soaring license costs, which were partly offset by growth in Professional Services. In fact, by service, Technology Solutions increased to 6.515 billion yen (+19.7% YoY) and Professional Services increased to 1.030 billion yen (+63.6% YoY), and shoots of mix improvement are emerging, but In-house Products were flat at 525 million yen (+0.1% YoY).
On the cost side, SG&A expenses increased to 1.486 billion yen (+2.7% YoY), but the SG&A ratio improved to 18.4% (-3.5 pt YoY), and fixed-cost control in a revenue-growth phase is functioning. In terms of leading indicators, contract liabilities accumulated to 4.127 billion yen and increased by 720 million yen from 2Q, and visibility into future sales has improved. With the company viewing the profitability issue as essential and aiming to improve profits through the organizational structure reform “Reignite2030,” this will be the focus from the next quarter onward.
The revenue growth trend and accumulation of contract liabilities are strong, but the decline in gross profit margin to 22.1% is a factor capping the share price. The next evaluation axis is the simultaneous achievement of absorbing cost increases and a continued rise in the ratio of high-value-added services.
◇ Segment analysis: Reading growth drivers through the three pillars (Technology / Professional / In-house Products)
Ricksoft’s segment structure is one in which Technology Solutions serves as the foundation, Professional Services adds value, and In-house Products adds thickness to recurring billing. The breakdown of net sales of 8.071 billion yen in the 3Q cumulative period of FY2/2026 is: Technology Solutions 6.515 billion yen (composition 80.7%, +19.7% YoY), Professional Services 1.030 billion yen (12.8%, +63.6% YoY), and In-house Products 525 million yen (6.5%, +0.1% YoY).
・Technology Solutions: A revenue source that centers on license sales, such as Atlassian, and also captures operational needs before and after implementation.
・Professional Services: End-to-end support (SI/consulting) from requirements definition through design, implementation, and operations, where project unit prices and added value are likely to grow.
・In-house Products: Add-on development that enhances synergies with Atlassian, etc., with room to expand recurring billing.
Revenue recognition is a model in which project revenue volatility and recurring revenue coexist: for implementation projects, recognition at acceptance is the basic approach; for support and BPO, etc., recognition is monthly (annual contracts are prorated over the period); and for In-house Products as well, subscriptions are prorated over the period. In addition, the customer base is centered on large enterprises and characterized by deep implementation capabilities that drive ongoing transactions.
◇ Earnings outlook: The company’s plan is unchanged; whether it can be achieved depends on absorbing license costs and the growth speed in high-value-added areas.
For FY2/2026, it is reasonable to evaluate that, based on the company plan (net sales 10.168 billion yen, operating profit 411 million yen, ordinary profit 411 million yen, current net profit 315 million yen, year-end dividend 0 yen), sales are on the planned line, and profits depend on a rebound in the gross profit margin. The company clearly states that there is no change to the FY2/2026 earnings forecast, and that no guidance revision signal has been confirmed at this time.
In terms of progress, the progress rate versus the full-year plan in the 3Q cumulative period of FY2/2026 is stated to be 79.4% for net sales and 72.1% for operating profit. In contrast, sales accumulation is steady, and the structural factors in margin improvement in the remaining quarter(s) will drive profits. Therefore, downside risks are expected to be concentrated in: (1) a case where the surge in license costs continues more than assumed and the gross profit margin does not recover, and (2) a case where, even if growth in Professional Services contributes on the sales side, optimization of staffing and utilization is delayed and the conversion to profits is pushed back. The company recognizes the decline in the operating margin as an important issue. It indicates a policy of aiming to improve profits through the organizational structure reform “Reignite2030.” Investors are in a phase of simultaneously checking the quarterly gross profit margin, the service composition (in particular, the Professional Services ratio), and the growth rate of SG&A expenses.
In the medium term, based on Reignite2030, Ricksoft aims to achieve EBITDA of 3.0 billion yen in 2030, and this fiscal year will be the first year of restructuring the earnings profile while maintaining revenue growth. While allowing for short-term profit fluctuations, whether it can visualize the improvement track through continuous disclosure of KPIs (e.g., service gross profit margin, growth by service, utilization/productivity indicators) will affect the plan’s credibility.
While visibility into sales (progress: 79.4%) is high, profits depend on a rebound in gross profit margins. Whether, in 4Q, both cost absorption and a rise in the high-value-added ratio can be confirmed simultaneously will be important for the share price.
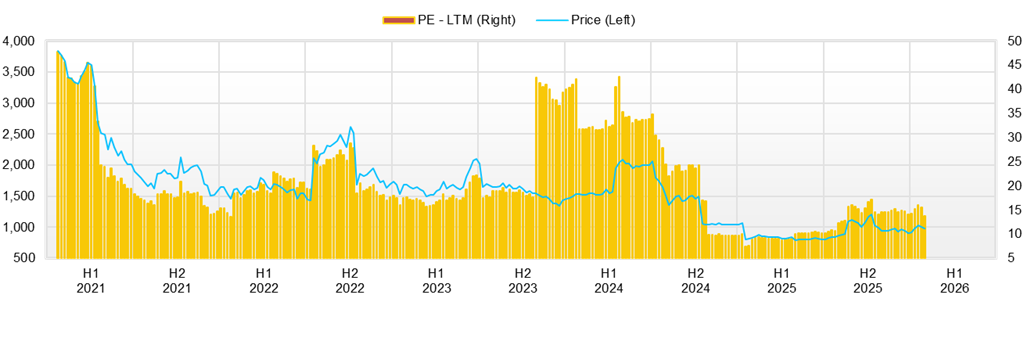
◇ Share price trend and points to watch going forward: The focus on results is the gross profit margin, and rerating depends on the capital allocation message.
Over the past three months, Ricksoft’s share price has moved in the following flow: a high in early October → a sharp drop on the 1H results → a gradual decline → a further drop on the 3Q results → buying back on the next business day, and the market is cautiously assessing Ricksoft as a name with revenue growth but profits that are hard to read. After hitting a high of 1,230 yen on October 8, 2025, it fell 13.2% from a closing price of 1,181 yen on the 1H results announcement date (October 14, 2025) to a closing price of 1,025 yen on the next day, October 15. Furthermore, it declined to a closing price of 907 yen on December 26, 2025. Although it recovered to a closing price of 1,010 yen on January 13, 2026, after the New Year, on January 14, 2026 (the 3Q results announcement date), it fell back -3.6% to a closing price of 974 yen. Up to this point, a tendency can be observed: sales tend to emerge when results do not show a recovery in gross profit margin. However, the next day, January 15, 2026, it rebounded sharply to a closing price of 1,045 yen versus the prior day, also indicating that disappointment selling on the results day tends to run its course quickly. Therefore, the market can be organized as follows: it goes to confirm whether or not improvement in the gross profit margin is visible rather than the negative factors themselves; if it is not visible, it sells first; but when the share price declines, buybacks tend to come in due to the thickness of cash.
Valuation is a forecast PER of 14.8x and an actual PBR of 1.44x. The fact that the PBR does not rise relative to the ROE of 12.3% is viewed as a reflection that the market places more importance on profit stability and visibility into shareholder returns than on growth. In addition, the thickness of cash, with a market capitalization of 4.7 billion yen versus NetCash of 3.782 billion yen, is substantial as downside support. For the valuation level to move up a step, management needs to clearly show how it will use cash (the priority order among share buybacks, dividends, and growth investment).
The share-price reaction to catalysts differs between results and medium- to long-term news. Results elicit a strong response, and the share price tends to decline. The moves around the 1H results (October 14 → 15) and the 3Q results (January 13 → 14) are typical of this. In the medium- to long-term, the immediate share-price reaction tends to be small. For example, the report on November 17, 2025, that the major shareholder Hikari Tsushin Group increased its ownership ratio and the capital and business alliance with BiPlus Software on December 18, 202,5 are essential as a story, but in the short term, they are unlikely to directly connect to valuation until numbers such as orders, sales, and profit become visible.
From a technical standpoint, it is practical for the time being to view the range as an upper level around 1,045 to 1,050 yen and a lower level around 900 yen. The fact that it recovered to 1,045 yen on January 15 indicates that 1,000 yen tends to be recognized as a psychological branching point, but it is also a level where selling on rallies tends to emerge on the upside. Volume is thin in regular times, but on days when it increases in a lump during sudden changes, price movements tend to become volatile as they cross the key levels of 1,000 yen and 900 yen. Going forward, the conditions to push the share price up to the next stage are when any of the following becomes realistic: (1) bottoming out and reversal of the gross profit margin (simultaneous achievement of absorbing rising license costs and improving the service mix), (2) continuous disclosure of model-transformation KPIs (making it possible to track service gross profit and composition ratios, productivity, etc. on a quarterly basis), (3) concretization of capital allocation (showing the framework for share buybacks, dividends, and growth investment with a sense of amount), and (4) quantitative presentation of the alliance effect (disclosure of how the BiPlus alliance contributed to orders and sales). From an investment timing perspective, upward revisions or hints of firmer guidance, updates to capital policies, new/expanded disclosure of KPIs, and additional moves by major shareholders can be among the most reliable triggers.
The downside is likely to be supported by the thickness of cash, but if the gross profit margin does not improve, it tends to be sold first. However, as the January 15 rebound shows, buybacks also tend to come in when the price falls. To raise the valuation level by a step, it is essential to show, in numbers, both improvement in the gross profit margin and clarification of capital allocation.
Company profile
◇ Handling overseas SaaS sales, implementation, and operations end-to-end. A tool solutions company capturing DX demand.
Ricksoft, Co., Ltd. combines license sales of overseas SaaS products centered on Atlassian products with implementation support and operational/accompanying support, creating a business model that connects customers’ operational reform and DX to recurring revenue. It operates as an integrated Tool Solutions business and provides value provision across three areas: Technology Solutions, Professional Services, and In-house Products.
As an IT services company, it has a structure that can provide end-to-end, from sales to implementation to operations, centered on overseas SaaS such as Atlassian. The company was established on January 4, 2005, and its human resources as of the end of 3Q of FY2/2026 were 144 employees, from which an operating scale can be read that acquires projects through the implementation capabilities of specialized human resources while suppressing excessive expansion of fixed costs.
Revenue opportunities lie in a combination of: (1) stock-type revenue linked to licenses, etc., of overseas vendor products, (2) project revenue from requirements definition through implementation, and (3) recurring billing revenue from operations/support and in-house add-ons, etc. In addition, it has an overseas subsidiary, Ricksoft, Inc., and is advancing the expansion of its global capabilities.
Key financial data
| Unit: million yen | 2021/2 | 2022/2 | 2023/2 | 2024/2 | 2025/2 | 2026/2 CE |
| Sales | 4,431 | 4,308 | 5,623 | 7,491 | 9,044 | 10,168 |
| EBIT (Operating Income) | 602 | 437 | 547 | 666 | 459 | 411 |
| Pretax Income | 601 | 450 | 567 | 350 | 462 | 411 |
| Net Profit Attributable to Owner of Parent | 446 | 327 | 424 | 269 | 356 | 315 |
| Cash & Short-Term Investments | 1,944 | 2,089 | 3,071 | 3,158 | 3,297 | |
| Total assets | 3,180 | 2,939 | 4,577 | 5,971 | 6,687 | |
| Total Debt | 0 | 0 | 0 | 0 | 0 | |
| Net Debt | -1,944 | -2,089 | -3,071 | -3,158 | -3,297 | |
| Total liabilities | 1,279 | 684 | 2,103 | 3,203 | 3,658 | |
| Total Shareholders’ Equity | 1,901 | 2,255 | 2,474 | 2,768 | 3,029 | |
| Net Operating Cash Flow | 478 | 161 | 978 | 100 | 377 | |
| Capital Expenditure | 9 | 61 | 25 | 30 | 95 | |
| Net Investing Cash Flow | -8 | -47 | -27 | -37 | -140 | |
| Net Financing Cash Flow | 19 | 23 | 18 | 7 | -91 | |
| Free Cash Flow | 469 | 110 | 968 | 86 | 298 | |
| ROA (%) | 17.47 | 10.69 | 11.28 | 5.10 | 5.62 | |
| ROE (%) | 26.70 | 15.73 | 17.92 | 10.26 | 12.27 | |
| EPS (Yen) | 103.6 | 74.5 | 94.4 | 59.2 | 78.6 | 70.5 |
| BPS (Yen) | 436.6 | 507.2 | 547.4 | 608.3 | 676.1 | |
| Dividend per Share (Yen) | 0.00 | 0.00 | 0.00 | 0.00 | 0.00 | 0.00 |
| Shares Outstanding (Million shares) | 4.29 | 4.37 | 4.51 | 4.55 | 4.55 |
Source: Omega Investment from company data, rounded to the nearest whole number.
Share price
Financial data (quarterly basis)
| Unit: million yen | 2024/2 | 2025/2 | 2026/2 | ||||||
| 3Q | 4Q | 1Q | 2Q | 3Q | 4Q | 1Q | 2Q | 3Q | |
| (Income Statement) | |||||||||
| Sales | 1,819 | 2,193 | 2,047 | 2,263 | 2,289 | 2,445 | 2,872 | 2,254 | 2,944 |
| Year-on-year | 50.3% | 30.8% | 30.2% | 18.7% | 25.8% | 11.5% | 40.3% | -0.4% | 28.6% |
| Cost of Goods Sold (COGS) | 1,258 | 1,553 | 1,429 | 1,703 | 1,711 | 1,826 | 2,247 | 1,722 | 2,319 |
| Gross Income | 561 | 641 | 617 | 560 | 577 | 619 | 625 | 532 | 625 |
| Gross Income Margin | 30.9% | 29.2% | 30.2% | 24.7% | 25.2% | 25.3% | 21.8% | 23.6% | 21.2% |
| SG&A Expense | 415 | 413 | 470 | 485 | 493 | 468 | 495 | 495 | 496 |
| EBIT (Operating Income) | 146 | 228 | 148 | 76 | 84 | 151 | 130 | 37 | 129 |
| Year-on-year | 37.0% | 42.0% | 0.7% | -48.0% | -42.3% | -33.5% | -11.9% | -50.7% | 53.6% |
| Operating Income Margin | 8.0% | 10.4% | 7.2% | 3.3% | 3.7% | 6.2% | 4.5% | 1.7% | 4.4% |
| EBITDA | 153 | 235 | 155 | 83 | 97 | 167 | 145 | 51 | 144 |
| Pretax Income | 179 | 236 | 155 | 77 | 85 | 145 | 97 | 41 | 135 |
| Consolidated Net Income | 131 | 177 | 115 | 62 | 68 | 111 | 74 | 36 | 102 |
| Minority Interest | 0 | 0 | 0 | 0 | 0 | 0 | 0 | 0 | 0 |
| Net Income ATOP | 131 | 177 | 115 | 62 | 68 | 111 | 74 | 36 | 102 |
| Year-on-year | 69.3% | 40.8% | 11.9% | -143.6% | -48.5% | -37.3% | -35.5% | -42.5% | 51.1% |
| Net Income Margin | 7.2% | 8.1% | 5.6% | 2.7% | 3.0% | 4.5% | 2.6% | 1.6% | 3.5% |
| (Balance Sheet) | |||||||||
| Cash & Short-Term Investments | 3,047 | 3,158 | 3,375 | 3,442 | 3,192 | 3,297 | 3,142 | 3,930 | 3,782 |
| Total assets | 5,830 | 5,971 | 6,291 | 6,588 | 6,004 | 6,687 | 7,365 | 7,533 | 8,426 |
| Total Debt | 0 | 0 | 0 | 0 | 0 | 0 | 0 | 0 | 0 |
| Net Debt | -3,047 | -3,158 | -3,375 | -3,442 | -3,192 | -3,297 | -3,142 | -3,930 | -3,782 |
| Total liabilities | 3,246 | 3,203 | 3,398 | 3,661 | 3,083 | 3,658 | 4,275 | 4,397 | 5,158 |
| Total Shareholders’ Equity | 2,585 | 2,768 | 2,893 | 2,927 | 2,921 | 3,029 | 3,090 | 3,137 | 3,268 |
| (Profitability %) | |||||||||
| ROA | 4.47 | 5.10 | 4.99 | 8.53 | 7.12 | 5.62 | 4.61 | 4.08 | 4.48 |
| ROE | 8.83 | 10.26 | 10.26 | 18.03 | 15.31 | 12.27 | 10.52 | 9.51 | 10.43 |
| (Per-share) Unit: JPY | |||||||||
| EPS | 28.8 | 38.9 | 25.3 | 13.6 | 15.1 | 24.8 | 16.6 | 7.9 | 22.7 |
| BPS | 568.0 | 608.3 | 635.7 | 643.9 | 652.0 | 676.1 | 689.7 | 697.1 | 726.3 |
| Dividend per Share | 0.00 | 0.00 | 0.00 | 0.00 | 0.00 | 0.00 | 0.00 | 0.00 | 0.00 |
| Shares Outstanding(million shares) | 4.55 | 4.55 | 4.55 | 4.55 | 4.55 | 4.55 | 4.55 | 4.55 | 4.55 |
Source: Omega Investment from company materials
Financial data (full-year basis)
| Unit: million yen | 2020/2 | 2021/2 | 2022/2 | 2023/2 | 2024/2 | 2025/2 |
| (Income Statement) | ||||||
| Sales | 3,089 | 4,431 | 4,308 | 5,623 | 7,491 | 9,044 |
| Year-on-year | 24.4% | 43.5% | -2.8% | 30.5% | 33.2% | 20.7% |
| Cost of Goods Sold | 1,904 | 2,868 | 2,779 | 3,759 | 5,249 | 6,670 |
| Gross Income | 1,184 | 1,563 | 1,529 | 1,864 | 2,242 | 2,374 |
| Gross Income Margin | 38.3% | 35.3% | 35.5% | 33.1% | 29.9% | 26.2% |
| SG&A Expense | 782 | 961 | 1,091 | 1,317 | 1,576 | 1,915 |
| EBIT (Operating Income) | 402 | 602 | 437 | 547 | 666 | 459 |
| Year-on-year | 8.3% | 49.6% | -27.3% | 25.0% | 21.7% | -31.1% |
| Operating Income Margin | 13.0% | 13.6% | 10.2% | 9.7% | 8.9% | 5.1% |
| EBITDA | 416 | 617 | 467 | 566 | 691 | 502 |
| Pretax Income | 403 | 601 | 450 | 567 | 350 | 462 |
| Consolidated Net Income | 289 | 446 | 327 | 424 | 269 | 356 |
| Minority Interest | 0 | 0 | 0 | 0 | 0 | 0 |
| Net Income ATOP | 289 | 446 | 327 | 424 | 269 | 356 |
| Year-on-year | 13.0% | 54.3% | -26.7% | 29.7% | -36.5% | 32.2% |
| Net Income Margin | 9.4% | 10.1% | 7.6% | 7.5% | 3.6% | 3.9% |
| (Balance Sheet) | ||||||
| Cash & Short-Term Investments | 1,458 | 1,944 | 2,089 | 3,071 | 3,158 | 3,297 |
| Total assets | 1,922 | 3,180 | 2,939 | 4,577 | 5,971 | 6,687 |
| Total Debt | 0 | 0 | 0 | 0 | 0 | 0 |
| Net Debt | -1,458 | -1,944 | -2,089 | -3,071 | -3,158 | -3,297 |
| Total liabilities | 484 | 1,279 | 684 | 2,103 | 3,203 | 3,658 |
| Total Shareholders’ Equity | 1,437 | 1,901 | 2,255 | 2,474 | 2,768 | 3,029 |
| (Cash Flow) | ||||||
| Net Operating Cash Flow | 316 | 478 | 161 | 978 | 100 | 377 |
| Capital Expenditure | 13 | 9 | 61 | 25 | 30 | 95 |
| Net Investing Cash Flow | -43 | -8 | -47 | -27 | -37 | -140 |
| Net Financing Cash Flow | 152 | 19 | 23 | 18 | 7 | -91 |
| Free Cash Flow | 303 | 469 | 110 | 968 | 86 | 298 |
| (Profitability %) | ||||||
| ROA | 16.97 | 17.47 | 10.69 | 11.28 | 5.10 | 5.62 |
| ROE | 23.80 | 26.70 | 15.73 | 17.92 | 10.26 | 12.27 |
| Net profit margin | 9.35 | 10.06 | 7.59 | 7.54 | 3.59 | 3.93 |
| Asset turnover ratio | 1.81 | 1.74 | 1.41 | 1.50 | 1.42 | 1.43 |
| Financial leverage | 1.40 | 1.53 | 1.47 | 1.59 | 2.01 | 2.18 |
| (Per-share) Unit: JPY | ||||||
| EPS | 68.5 | 103.6 | 74.5 | 94.4 | 59.2 | 78.6 |
| BPS | 336.0 | 436.6 | 507.2 | 547.4 | 608.3 | 676.1 |
| Dividend per Share | 0.00 | 0.00 | 0.00 | 0.00 | 0.00 | 0.00 |
| Shares Outstanding (million shrs) | 4.20 | 4.29 | 4.37 | 4.51 | 4.55 | 4.55 |
Source: Omega Investment from company materials