2026-04-10
Home
Japanese

Omega Investment Co., Ltd.
CHUGAI RO (Company note – 3Q update)

| Share price (2/26) | ¥4,975 | Dividend Yield (26/3 CE) | 3.0 % |
| 52weeks high/low | ¥2,723/5,220 | ROE(25/3) | 10.7 % |
| Avg Vol (3 month) | 26.8 thou shrs | Operating margin (25/3) | 7.5 % |
| Market Cap | ¥38.81 bn | Beta (5Y Monthly) | 0.30 |
| Enterprise Value | ¥31.26 bn | Shares Outstanding | 7.800 mn shrs |
| PER (26/3 CE) | 9.8 X | Listed market | TSE Prime section |
| PBR (25/3 act) | 1.3 X |
| Click here for the PDF version of this page |
| PDF version |
In the third quarter of FY3/2026, results remained solid. With higher-order intake, higher sales, and higher profits, the probability of achieving the full-year forecast is rising.
◇ Highlights of third-quarter results for FY3/2026: higher order intake, higher sales, and higher profits.
The third-quarter results for FY3/2026 announced by CHUGAI RO (hereinafter, the Company) on January 30, 2026, remained favorable.
Order intake was 28.11 billion yen (up 14.2% YoY), order backlog was 42.12 billion yen (up 14.5% YoY), net sales were 23.78 billion yen (up 7.0% YoY), and operating profit was 620 million yen (up 125.8% YoY). Ordinary profit was 820 million yen (up 65.7% YoY). Profit attributable to owners of parent was 2.33 billion yen (up 132.1% YoY).
The key points of these results are the steady progress and qualitative enrichment of order intake and profit and loss. Order intake has been progressing steadily. Proposals based on “contributing to carbon neutrality” have borne fruit, and the Company has won contracts for modification work on continuous annealing lines for steel in Japan, ladle preheating equipment for electric furnaces, heat-treatment equipment related to next-generation batteries, electric-heating-type heat-treatment facilities for mechanical parts, and continuous annealing furnaces for wire rod coils.
Profit and loss have also been progressing steadily. Net sales increased as projects such as production equipment for next-generation solar cells, heat-treatment equipment for solid electrolytes, energy-saving modification work on reheating furnaces for the steel industry in Japan, deodorizing furnaces, stainless steel manufacturing facilities for overseas customers, and a project under the Green Innovation Fund Project “Decarbonization of thermal processes in the manufacturing sector” of the New Energy and Industrial Technology Development Organization (NEDO), a National Research and Development Agency, progressed smoothly. On the profit side, the gross profit margin improved by 1.6 percentage points through appropriate pricing, and, while absorbing the increase in selling, general, and administrative expenses, this led to a substantial increase in operating profit. Furthermore, the sale of cross-shareholdings (extraordinary income) is also progressing steadily.
◇ Earnings forecast for FY3/2026: unchanged. The probability of achievement is increasing.
The Company left its full-year earnings forecast unchanged this time. Net sales are projected at 37.50 billion yen (up 3.5% YoY), operating profit at 3.00 billion yen (up 9.7% YoY), ordinary profit at 3.15 billion yen (up 4.9% YoY), and profit attributable to owners of parent at 3.70 billion yen (up 23.4% YoY). Net income per share is projected at 510.18 yen, and the annual dividend per share at 150 yen.
This forecast is achievable if the Company generates revenue in the fourth quarter at the same level as in the same quarter of the previous fiscal year. In light of the recent growth in order intake and backlog, the probability of achieving it has increased further.
◇ Change in representative director and change of president
At the Board of Directors meeting held on January 30, 2026, it was resolved that the president will change effective April 1, 2026. Representative Director, President and Executive Officer Akira Ozaki is scheduled to become Representative Director and Chairman, and Director, Senior Managing Executive Officer Mamoru Sakata is scheduled to become Representative Director, President and Executive Officer. The new president will be responsible for formulating and implementing the next Medium-Term Management Plan for FY2027 and beyond.
◇ Stock price trends and points of focus going forward
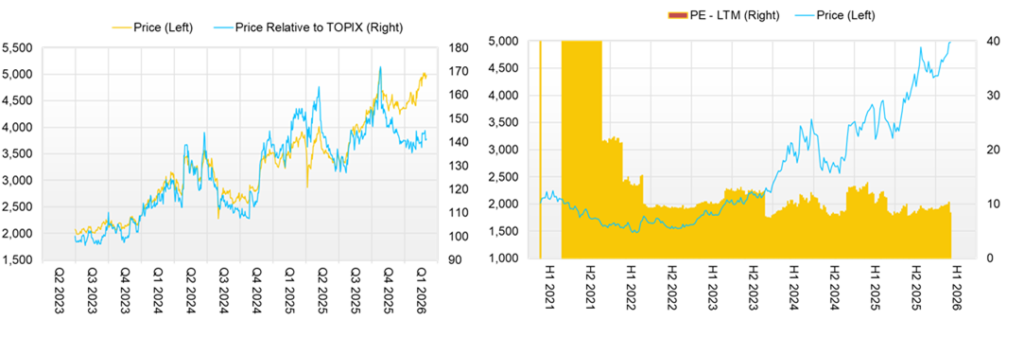
Following the announcement of the first-quarter results, the Company’s stock price rose steadily and reached a fiscal-year high of 5,220 yen on October 29, but after the announcement of the second-quarter results, it entered a phase of consolidating a base in the 4,200–4,600 yen range. Thereafter, as the third-quarter results were strong and the probability of achieving the full-year earnings forecast increased, the stock price rose to a level where it is poised to renew its high. PBR is 1.2x, and forward PER remains at 9.4x, and there is little sense that the stock price is overheated.
The future trend in the stock price will hinge on the final results for FY3/2026 and whether there is additional shareholder returns, the earnings trend in FY3/2027, and the direction of the next Medium-Term Management Plan, which will cover FY3/2028 and beyond.
First, a key focus is whether the results for FY3/2026 will align with the Company’s forecast and whether additional shareholder returns (an increase in dividends or additional treasury share acquisitions) will be implemented to achieve a total shareholder return ratio of 50%.
Next, attention will be focused on whether the Company’s earnings forecast for FY3/2027 will be in line with the target values of the current Medium-Term Management Plan (net sales of 41.5 billion yen, operating profit of 3.62 billion yen, and ROE of 10%). In light of the accumulation of order intake and order backlog to date, it appears that things are progressing smoothly.
Finally, the direction of the next Medium-Term Management Plan, which will be formulated during FY3/2027 under the new president, will be important. If its key customers, the steel and automotive industries, continue to actively pursue carbon-neutrality initiatives, and if carbon-neutral initiatives also advance in electronics-related industries and other sectors, the Company’s opportunities to play an active role are likely to increase further. Attention should also be paid to the new president’s capabilities and vision.
Order intake trend
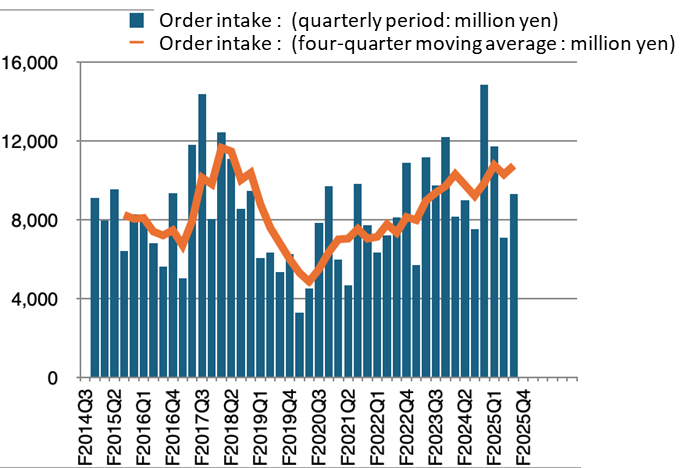
(Source: Omega Investment from company materials)
Company profile
CHUGAI RO CO., LTD.is Japan’s leading manufacturer of industrial furnaces and industrial burners, whose management philosophy is: “Chugai Ro creates new value through its core of thermal technology, thus contributing to society while realizing the prosperity of the company and the happiness of its employees.” With a track record of developing over 100 types of industrial furnaces, the Company is known as a “department store of industrial furnaces.” Under the slogan “Pioneering the future with thermal technology,” and based on its foundational technologies in thermal technology, engineering capabilities, and advanced technology accumulated since its founding in 1945, the Company provides industrial furnaces and related equipment to the steel, automotive, and information and communications industries. Currently, based on its Management Vision 2026, “Renovate ourselves to develop our future with the technology for carbon neutrality!”, the Company aims to contribute to society and expand corporate value through carbon-neutral technology under its Medium-Term Management Plan (FY2022–FY2026). Attention from the stock market is increasing.
Key financial data
| Unit: million yen | 2021 | 2022 | 2023 | 2024 | 2025 | 2026 CE |
| Sales | 24,717 | 26,317 | 27,976 | 29,283 | 36,247 | 37,500 |
| EBIT (Operating Income) | 389 | 1,264 | 1,310 | 1,479 | 2,737 | 3,000 |
| Pretax Income | 527 | 1,594 | 1,699 | 3,129 | 4,222 | |
| Net Profit Attributable to Owner of Parent | 329 | 1,360 | 1,231 | 2,197 | 2,998 | 3,700 |
| Cash & Short-Term Investments | 7,121 | 11,130 | 7,884 | 10,061 | 4,392 | |
| Total assets | 38,577 | 38,141 | 41,178 | 48,863 | 48,736 | |
| Total Debt | 5,988 | 3,988 | 3,988 | 7,288 | 5,507 | |
| Net Debt | -1,133 | -7,142 | -3,896 | -2,773 | 1,115 | |
| Total liabilities | 16,784 | 14,928 | 17,134 | 21,092 | 20,125 | |
| Total Shareholders’ Equity | 21,681 | 23,068 | 23,860 | 27,570 | 28,329 | |
| Net Operating Cash Flow | 3,300 | 6,090 | -2,500 | -891 | -3,696 | |
| Capital Expenditure | 442 | 317 | 240 | 1,335 | 798 | |
| Net Investing Cash Flow | -551 | 510 | -63 | 550 | 654 | |
| Net Financing Cash Flow | -4,481 | -2,508 | -727 | 2,451 | -2,701 | |
| Free Cash Flow | 3,036 | 5,963 | -2,688 | -2,161 | -4,419 | |
| ROA (%) | 0.77 | 3.55 | 3.10 | 4.88 | 6.14 | |
| ROE (%) | 1.56 | 6.08 | 5.25 | 8.54 | 10.73 | |
| EPS (Yen) | 42.9 | 177.2 | 162.0 | 293.8 | 407.6 | 510.18 |
| BPS (Yen) | 2,824.1 | 3,005.3 | 3,146.7 | 3,709.0 | 3,859.0 | |
| Dividend per Share (Yen) | 60.00 | 70.00 | 70.00 | 80.00 | 150.00 | 150.00 |
| Shares Outstanding (Million shares) | 7.80 | 7.80 | 7.80 | 7.80 | 7.80 |
Share price
Financial data (quarterly basis)
| Unit: million yen | 2024/3 | 2025/3 | 2026/3 | ||||||
| 3Q | 4Q | 1Q | 2Q | 3Q | 4Q | 1Q | 2Q | 3Q | |
| (Income Statement) | |||||||||
| Sales | 5,837 | 10,837 | 5,280 | 9,441 | 7,498 | 14,028 | 6,347 | 8,422 | 9,015 |
| Year-on-year | -15.3% | -5.7% | 11.4% | 20.0% | 28.5% | 29.4% | 20.2% | -10.8% | 20.2% |
| Cost of Goods Sold (COGS) | 4,905 | 7,681 | 4,759 | 7,521 | 6,138 | 10,238 | 5,464 | 6,658 | 7,203 |
| Gross Income | 932 | 3,156 | 521 | 1,920 | 1,360 | 3,790 | 883 | 1,764 | 1,812 |
| Gross Income Margin | 16.0% | 29.1% | 9.9% | 20.3% | 18.1% | 27.0% | 13.9% | 20.9% | 20.1% |
| SG&A Expense | 1,121 | 1,238 | 1,203 | 1,160 | 1,163 | 1,328 | 1,254 | 1,229 | 1,356 |
| EBIT (Operating Income) | -189 | 1,918 | -682 | 760 | 197 | 2,462 | -371 | 535 | 456 |
| Year-on-year | -253.7% | 2.1% | 8.9% | 102.1% | -204.2% | 28.4% | -45.6% | -29.6% | 131.5% |
| Operating Income Margin | -3.2% | 17.7% | -12.9% | 8.0% | 2.6% | 17.6% | -5.8% | 6.4% | 5.1% |
| EBITDA | -58 | 2,068 | -551 | 902 | 334 | 2,604 | -253 | 661 | 605 |
| Pretax Income | 189 | 1,903 | 50 | 775 | 704 | 2,693 | 1,032 | 514 | 1,915 |
| Consolidated Net Income | 101 | 1,391 | -9 | 544 | 504 | 2,033 | 673 | 333 | 1,319 |
| Minority Interest | -5 | 46 | 2 | 15 | 16 | 41 | -31 | -17 | 40 |
| Net Income ATOP | 106 | 1,344 | -12 | 530 | 487 | 1,993 | 704 | 351 | 1,278 |
| Year-on-year | -30.3% | -0.5% | -95.8% | -48.5% | 359.4% | 48.3% | -5966.7% | -33.8% | 162.4% |
| Net Income Margin | 1.8% | 12.4% | -0.2% | 5.6% | 6.5% | 14.2% | 11.1% | 4.2% | 14.2% |
| (Balance Sheet) | |||||||||
| Cash & Short-Term Investments | 8,640 | 10,061 | 6,097 | 5,567 | 3,855 | 4,392 | 6,071 | 5,853 | 6,726 |
| Total assets | 46,439 | 48,863 | 43,463 | 45,170 | 43,667 | 48,736 | 46,023 | 47,656 | 46,788 |
| Total Debt | 8,402 | 7,288 | 6,209 | 7,180 | 6,687 | 5,507 | 6,397 | 5,240 | 5,074 |
| Net Debt | -238 | -2,773 | 112 | 1,613 | 2,832 | 1,115 | 326 | -613 | -1,652 |
| Total liabilities | 21,744 | 21,092 | 17,079 | 18,797 | 17,115 | 20,125 | 18,878 | 19,322 | 17,645 |
| Total Shareholders’ Equity | 24,544 | 27,570 | 26,178 | 26,143 | 26,321 | 28,329 | 26,908 | 28,117 | 28,875 |
| (Profitability %) | |||||||||
| ROA | 5.29 | 4.88 | 5.61 | 4.23 | 5.22 | 6.14 | 8.30 | 7.61 | 9.56 |
| ROE | 9.40 | 8.54 | 9.82 | 7.76 | 9.24 | 10.73 | 13.99 | 13.03 | 15.67 |
| (Per-share) Unit: JPY | |||||||||
| EPS | 14.3 | 180.8 | -1.6 | 71.9 | 66.3 | 271.5 | 96.6 | 48.5 | 176.6 |
| BPS | 3,301.7 | 3,709.0 | 3,565.6 | 3,561.1 | 3,585.4 | 3,859.0 | 3,717.8 | 3,884.9 | 3,989.7 |
| Dividend per Share | 0.00 | 80.00 | 0.00 | 0.00 | 0.00 | 150.00 | 0.00 | 0.00 | 0.00 |
| Shares Outstanding (million shares) | 7.80 | 7.80 | 7.80 | 7.80 | 7.80 | 7.80 | 7.80 | 7.80 | 7.80 |
Financial data (full-year basis)
| Unit: million yen | 2016 | 2017 | 2018 | 2019 | 2020 | 2021 | 2022 | 2023 | 2024 | 2025 |
| (Income Statement) | ||||||||||
| Sales | 32,795 | 31,146 | 30,829 | 37,089 | 38,089 | 24,717 | 26,317 | 27,976 | 29,283 | 36,247 |
| Year-on-year | 33.6% | -5.0% | -1.0% | 20.3% | 2.7% | -35.1% | 6.5% | 6.3% | 4.7% | 23.8% |
| Cost of Goods Sold | 28,449 | 26,575 | 25,795 | 32,140 | 32,023 | 20,282 | 21,007 | 22,494 | 23,448 | 28,656 |
| Gross Income | 4,346 | 4,571 | 5,034 | 4,949 | 6,066 | 4,435 | 5,310 | 5,482 | 5,835 | 7,591 |
| Gross Income Margin | 13.3% | 14.7% | 16.3% | 13.3% | 15.9% | 17.9% | 20.2% | 19.6% | 19.9% | 20.9% |
| SG&A Expense | 3,669 | 3,797 | 3,853 | 3,962 | 4,354 | 4,046 | 4,046 | 4,172 | 4,356 | 4,854 |
| EBIT (Operating Income) | 677 | 774 | 1,181 | 987 | 1,712 | 389 | 1,264 | 1,310 | 1,479 | 2,737 |
| Year-on-year | 180.9% | 14.3% | 52.6% | -16.4% | 73.5% | -77.3% | 224.9% | 3.6% | 12.9% | 85.1% |
| Operating Income Margin | 2.1% | 2.5% | 3.8% | 2.7% | 4.5% | 1.6% | 4.8% | 4.7% | 5.1% | 7.6% |
| EBITDA | 1,037 | 1,112 | 1,527 | 1,378 | 2,080 | 749 | 1,676 | 1,710 | 1,953 | 3,289 |
| Pretax Income | 715 | 967 | 1,294 | 1,177 | 1,701 | 527 | 1,594 | 1,699 | 3,129 | 4,222 |
| Consolidated Net Income | 572 | 1,000 | 905 | 781 | 1,158 | 364 | 1,429 | 1,295 | 2,216 | 3,072 |
| Minority Interest | 27 | 21 | 40 | 26 | 37 | 35 | 69 | 64 | 19 | 74 |
| Net Income ATOP | 545 | 978 | 864 | 754 | 1,120 | 329 | 1,360 | 1,231 | 2,197 | 2,998 |
| Year-on-year | 79.9% | 79.4% | -11.7% | -12.7% | 48.5% | -70.6% | 313.4% | -9.5% | 78.5% | 36.5% |
| Net Income Margin | 1.7% | 3.1% | 2.8% | 2.0% | 2.9% | 1.3% | 5.2% | 4.4% | 7.5% | 8.3% |
| (Balance Sheet) | ||||||||||
| Cash & Short-Term Investments | 6,923 | 7,833 | 6,858 | 5,169 | 8,658 | 7,121 | 11,130 | 7,884 | 10,061 | 4,392 |
| Total assets | 39,665 | 38,502 | 41,368 | 42,731 | 46,696 | 38,577 | 38,141 | 41,178 | 48,863 | 48,736 |
| Total Debt | 3,988 | 3,988 | 4,010 | 4,995 | 9,988 | 5,988 | 3,988 | 3,988 | 7,288 | 5,507 |
| Net Debt | -2,935 | -3,845 | -2,848 | -174 | 1,330 | -1,133 | -7,142 | -3,896 | -2,773 | 1,115 |
| Total liabilities | 20,300 | 18,131 | 20,131 | 21,774 | 26,006 | 16,784 | 14,928 | 17,134 | 21,092 | 20,125 |
| Total Shareholders’ Equity | 19,292 | 20,295 | 21,138 | 20,875 | 20,589 | 21,681 | 23,068 | 23,860 | 27,570 | 28,329 |
| (Cash Flow) | ||||||||||
| Net Operating Cash Flow | 1,260 | 1,033 | 377 | -1,348 | -580 | 3,300 | 6,090 | -2,500 | -891 | -3,696 |
| Capital Expenditure | 290 | 113 | 420 | 456 | 244 | 442 | 317 | 240 | 1,335 | 798 |
| Net Investing Cash Flow | -499 | 402 | -837 | -478 | -442 | -551 | 510 | -63 | 550 | 654 |
| Net Financing Cash Flow | -405 | -484 | -468 | 279 | 4,510 | -4,481 | -2,508 | -727 | 2,451 | -2,701 |
| Free Cash Flow | 1,016 | 933 | 2 | -1,725 | -775 | 3,036 | 5,963 | -2,688 | -2,161 | -4,419 |
| (Profitability ) | ||||||||||
| ROA (%) | 1.45 | 2.50 | 2.17 | 1.80 | 2.51 | 0.77 | 3.55 | 3.10 | 4.88 | 6.14 |
| ROE (%) | 2.78 | 4.95 | 4.18 | 3.59 | 5.41 | 1.56 | 6.08 | 5.25 | 8.54 | 10.73 |
| Net Margin (%) | 1.66 | 3.14 | 2.81 | 2.04 | 2.94 | 1.33 | 5.17 | 4.40 | 7.50 | 8.27 |
| Asset Turn | 0.87 | 0.80 | 0.77 | 0.88 | 0.85 | 0.58 | 0.69 | 0.71 | 0.65 | 0.74 |
| Assets/Equity | 1.92 | 1.97 | 1.93 | 2.00 | 2.16 | 2.02 | 1.71 | 1.69 | 1.75 | 1.75 |
| (Per-share) Unit: JPY | ||||||||||
| EPS | 70.0 | 125.7 | 111.0 | 97.2 | 145.9 | 42.9 | 177.2 | 162.0 | 293.8 | 407.6 |
| BPS | 2,478.6 | 2,607.8 | 2,716.9 | 2,718.6 | 2,681.5 | 2,824.1 | 3,005.3 | 3,146.7 | 3,709.0 | 3,859.0 |
| Dividend per Share | 60.00 | 60.00 | 60.00 | 60.00 | 60.00 | 60.00 | 70.00 | 70.00 | 80.00 | 150.00 |
| Shares Outstanding (million shares) | 7.80 | 7.80 | 7.80 | 7.80 | 7.80 | 7.80 | 7.80 | 7.80 | 7.80 | 7.80 |