2026-04-13
Home
Japanese

Omega Investment Co., Ltd.
Prestige International (Investment report – basic)
| Share price (4/9) | ¥684 | Dividend Yield (26/3 CE) | 3.8 % |
| 52weeks high/low | ¥586/762 | ROE(25/3 act) | 10.8 % |
| Avg Vol (3 month) | 224.8 thou shrs | Operating margin (25/3 act) | 12.5 % |
| Market Cap | ¥86.98 bn | Beta (5Y Monthly) | 0.19 |
| Enterprise Value | ¥66.03 bn | Shares Outstanding | 127.176 mn shrs |
| PER (26/3 CE) | 16.3 X | Listed market | TSE Prime |
| PBR (25/3 act) | 1.8 X |
| Click here for the PDF version of this page |
| PDF version |
A high-quality company that steadily builds stable earnings and cash generation through resilient operations-based BPO.
Investment conclusion
The core investment appeal lies in resilient, stable earnings and cash generation created by operating know-how and economies of scale. Continue holding over the medium- to long-term.
Prestige International Inc. (the “Company”) is an operations-based BPO that provides assistance services, such as roadside assistance and housing trouble response, to major customers, including non-life insurers, automotive-related companies, and real estate-related companies. Backed by the high switching costs inherent in BPO/operations-based businesses, the accumulation of operating know-how, and economies of scale, the Company is highly attractive, with a structure capable of capturing demand less susceptible to economic conditions and generating stable, long-term earnings and abundant cash flow. In light of the quality of the business, the strength of the balance sheet, and the level of shareholder returns, the Company’s shares should be viewed not as a short-term trading vehicle, but as a stock suited for medium- to long-term holding, allowing investors to receive dividends while benefiting over time from the accumulation of corporate value. The fact that the shareholder base already includes many high-quality long-term shareholders and foreign investors also suggests that investors value the stock’s downside resilience and long-term suitability.
On the other hand, the share price has traded within a range since 2022 and has underperformed TOPIX. Although the market recognizes the resilience of demand and the Company’s cash-generating capability, sustained margin improvement has been difficult to see. Earnings growth has therefore not readily led to a re-rating of the stock. In fact, in FY3/2025, consolidated sales maintained top-line growth at 63.719 billion yen (up 8.5% YoY), and operating profit of 7.961 billion yen (up 0.5%) and ordinary profit of 8.416 billion yen (down 0.5%) also landed at high levels. However, net profit attributable to owners of parent came to 4.870 billion yen (down 15.9%), highlighting a situation in which profits did not accumulate smoothly. Demand remains strong, but hiring difficulties and higher costs have dampened investors’ expectations for firmer margins, and we view this as one reason the stock has remained range-bound. At the same time, cash flow from operating activities remained high at 7.840 billion yen, and attention should be paid to the fact that the Company’s underlying earning power has not broken down.
We view the current share price as close to fair value, broadly discounting for stable earnings, cash-generating capability, and the Company’s shareholder return stance. Whether the stock is re-rated from here depends on whether the market can gain conviction in sustained margin improvement and the continuity of capital policy. In other words, if margins turn upward through the success of price increases and the accumulation of higher-value-added projects, if supply constraints ease through improvements in hiring, retention, and utilization rates, and if the Company moves closer to a state in which it can fully capture demand. If the return policy, including share repurchases, is presented more quantitatively and continuously, then the accumulation of corporate value will be more likely to be reflected in the share price, making a correction of the long-standing range more realistic. As early indicators of gaining that conviction, the execution status of fee revisions and the degree of margin improvement, the easing of supply constraints through hiring, retention, and utilization rates, and the continuity of shareholder returns, including share repurchases, are the points most likely to move investor sentiment ahead of the reported figures.
One point to keep in mind is that in operations-based BPO, even when demand appears resilient, there can be repeated phases in which profits do not necessarily grow proportionally. In particular, if labor-cost inflation and hiring difficulties persist over the long term, time lags are likely even when price revisions progress, and this could be compounded by higher training and retention costs, potentially putting more pressure on margins than expected.
As a result, even if revenue continues to grow, there is a real possibility that valuation multiples will not expand and the stock will remain range-bound. In addition, any deterioration in contract terms with major customers, changes in the project mix that erode profitability, or a half-finished capital policy that leaves an excess-capital discount in place could pose downside risks to both earnings and the stock price. Moreover, the high foreign ownership ratio should also be recognized as a short-term volatility factor, as the stock may be sold in a deteriorating market environment regardless of company-specific factors. Therefore, in seeking favorable medium- to long-term returns, it is necessary, on the premise that stable earnings and cash generation are being maintained, to continuously confirm through the early indicators noted above (price revisions and margins, hiring and retention and utilization rates, and the continuity of shareholder returns) that these risks have not materialized and that margin improvement and greater clarity in capital policy are progressing over the medium term.
1. Business Model and Business Structure
An operations-based BPO company centered on 24-hour assistance services, integrating process design, dispatch arrangements, and IT.
The Company is an operations-based service company that undertakes customer operations for corporations, municipalities, and others, and provides end-to-end services ranging from routine operations to emergency response through contact center operations, various assistance services (including on-site dispatch), and BPO. Its fields cover assistance services related to non-life insurance and automobiles, property support for housing and real estate, medical and related support for overseas travelers and expatriates, various customer support services, financial guarantee services such as rent debt guarantees, and outsourced services in the IT and social fields.
In FY3/2025, the sales mix by segment was 43% Automotive, 14% Property, 14% Global, 10% Customer, 17% Financial Guarantee, 1% IT, and 1% Social, with an overseas ratio of 7%.
What characterizes the Company is that it does not merely handle customer inquiries on behalf of client companies; rather, as an operations-based BPO company, it supports clients’ customer experience and operating efficiency simultaneously by operating as an integrated whole the 24/7/365 assistance services at the core of its offering, the contact center, field dispatch arrangements through partner networks, and operating systems (“vertical integration”). Because workflows and IT become embedded in clients’ operations, changing outsourcing providers tends to involve transfer costs and risks to operating quality. As a result, switching costs rise, creating a structure in which earnings continuity and visibility are more likely to improve.
The core Automotive Business serves non-life insurance companies and automotive-related companies (manufacturers and dealers, among others) as major customers. It provides end users with roadside assistance, extended warranties, and other services. Its revenue sources include 24-hour customer contact, dealer support, and everything from planning to maintaining dispatch systems for roadside assistance services, as well as operations for emergency repairs, tow-truck dispatch, transportation home, accommodation, rental cars, and vehicle transport.
The Property Business serves real estate management companies, parking lot operators, and others as customers, and responds 24 hours a day to emergency requests from residents and users. It handles everything from primary reception to dispatch arrangements for water leaks, electrical equipment issues, malfunctions in ancillary facilities, parking lot trouble, and the like, and also includes home equipment extended warranties, as well as the planning, development, operation, and maintenance of customer contact and dispatch systems. The Company also offers pet-related assistance services (consultation, house calls, transportation, etc.), expanding operations-based BPO into the everyday infrastructure domain.
In the Global Business, the Company provides 24-hour Japanese-language reception and claims agent services to insured persons under overseas travel insurance policies on behalf of non-life insurers, and leveraging that network, it also develops healthcare programs (HCP) for expatriates of Japanese companies and medical support programs (MSP) for local subsidiaries. It also monetizes insurance-, healthcare-, and payments-related operational services, including the issuance and operation in the United States of local-currency-settlement credit cards in partnership with U.S. based local financial institutions and Japanese airlines.
Up to this point, the main earnings drivers are centered on mission critical assistance services. At the same time, the Company also encompasses adjacent areas, seeking both new project acquisition and earnings diversification.
The Customer Business provides CRM services and the like to card companies, e-commerce site operators, telecommunications companies, and others. Its services are wide-ranging, including accident reception for non-life insurers, product warranties, services for municipalities, administrative outsourcing for small-amount and short-term insurance, development of sales promotion systems, and even personnel dispatch and placement.
The Financial Guarantee Business offers rent-guarantee programs, including rent-debt guarantees, for customers such as real estate management companies. It extends this scheme to medical expense guarantees, eldercare expense guarantees, child support payment guarantees, and other areas.
The IT Business is responsible for the development and operation of systems that enhance telephone-response and SCM operations, as well as core systems, automatic dispatch systems, assessment systems, and the like across the Group’s businesses, underpinning the productivity and quality of operations-based BPO.
The Social Business engages in social contribution activities, including regional revitalization, through such initiatives as the women’s sports team Aranmare and the childcare business Orangery.
The Company has a business structure that captures mission critical everyday operations in areas such as daily life, mobility, housing, and guarantee. It supports them through 24-hour operations, while broadening its base through adjacent CRM, guarantee, and IT services. Even in the cumulative results for Q3 FY3/2026, the Company remained on a path of higher sales and higher profits, emphasizing growth in its major businesses and the start-up of operations for newly acquired clients. Going forward, investors’ focus, more than on the strength of demand itself, will be on how far the Company can structurally raise margins while restraining labor intensity through price revisions, greater value-added offerings, higher utilization rates, and the use of IT/DX.
【Sales trends by segment】
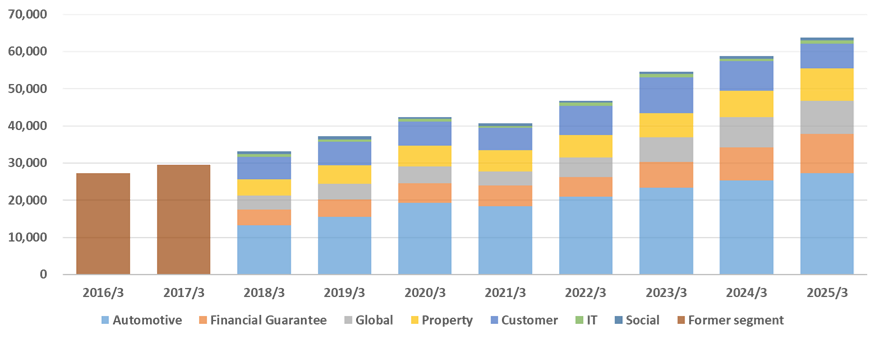
| Unit: million yen | 2016/3 | 2017/3 | 2018/3 | 2019/3 | 2020/3 | 2021/3 | 2022/3 | 2023/3 | 2024/3 | 2025/3 |
| Automotive | – | – | 13,204 | 15,500 | 19,345 | 18,408 | 20,879 | 23,282 | 25,301 | 27,254 |
| Financial Guarantee | – | – | 4,309 | 4,726 | 5,252 | 5,589 | 5,350 | 6,937 | 8,972 | 10,573 |
| Global | – | – | 3,675 | 4,125 | 4,495 | 3,761 | 5,248 | 6,732 | 8,105 | 8,934 |
| Property | – | – | 4,386 | 4,958 | 5,501 | 5,649 | 5,982 | 6,483 | 7,062 | 8,652 |
| Customer | – | – | 6,056 | 6,448 | 6,543 | 6,002 | 7,967 | 9,588 | 7,949 | 6,743 |
| IT | – | – | 743 | 627 | 750 | 587 | 794 | 879 | 666 | 866 |
| Social | – | – | 746 | 814 | 493 | 622 | 524 | 662 | 684 | 697 |
| Former segment | 27,328 | 29,478 | – | – | – | – | – | – | – | – |
Source: Calculated by Omega Investment based on FactSet’s standard criteria, rounded to the nearest whole number.
2. Business Strengths
The core of the business lies in the accumulation of operations, and the barriers to entry lie in “people” and “operations.”
The essence of Prestige International lies not in a conventional call center (inbound calls) but in providing BPO/assistance services that take over parts of client companies’ workflows and operate them while ensuring quality, speed, and compliance. From the client’s perspective, this is not simply the procurement of personnel; it is outsourcing as a package that includes service quality design, KPI management, business transfer, peak handling, incident response, and various controls, including personal information management. This is where switching costs arise. Changing outsourcing providers involves not only large transfer costs but also the risk of lower quality and customer service incidents. As a result, players who establish a certain level of quality and operating capability tend to be in a position to secure ongoing contracts and recurring earnings, making performance relatively stable even as the economic phase changes.
A key strength of the Company is its accumulated operating templates across multiple businesses, including Automotive, Property, Global, Customer, and Financial Guarantee. For example, 24/7/365 operations, incident response, balancing customer satisfaction with operating efficiency, negotiating price revisions in periods of rising costs, and managing partner companies (external resources) all derive their value from on-site learning curves and systematization. BPO does not scale linearly like an IT product, but the more standardized and automated operations become, the more processing volume and quality can be increased even with the same headcount. Ultimately, the business moves from being a labor-cost business toward an operating design business. Companies that reach this point gain stronger proposal capabilities to clients and are more likely to possess pricing power.
At the same time, the Company’s business is prone to supply constraints even during growth phases. If hiring, training, retention, utilization rates, and the absorption of seasonal fluctuations become bottlenecks, the Company may not be able to fully capture demand even when orders are available, causing top-line growth to slow. Furthermore, in an environment of wage inflation, margins depend heavily on the speed of price revisions and on improvements in operating efficiency. Accordingly, what is important in evaluating the Company’s business is not merely year-on-year changes in sales and profits, but rather structural perspectives: (1) whether operating quality and efficiency are improving, (2) whether price revisions are being executed continuously, (3) whether supply constraints are being eased through hiring and retention, and (4) whether the mix can be improved without retaining low-margin projects.
3. Earnings Structure by Business
The main pillars are Automotive and Financial Guarantee, with Property and Global serving as secondary pillars.
Cumulative Q3 FY3/2026 results showed higher sales and profits, with the Company as a whole also reporting a record-high profit. Looking at the segment composition, Automotive is the largest by sales volume, followed by Financial Guarantee, Global, Property, and Customer. On the earnings side, a key feature is that the Financial Guarantee Business has high margins and is an important factor lifting the Company’s total profits. This structure suggests that the Company is not solely labor-intensive, but is enhancing overall earnings stability and capital efficiency by combining high-margin businesses, particularly guarantee-related operations.
• Automotive: the scale pillar, but margins are prone to fluctuation in periods of rising costs
The Automotive Business continues to record higher sales. While an increase in the number of insured vehicles at automobile insurance companies and fee revisions have been positive factors, this area is also readily affected by rising external costs, including revisions to payment rates for partner companies. This business is a touchstone for measuring the Company’s overall pricing power and operating efficiency. The sustainability of margins will depend on how quickly it can realize price revisions and on whether it can effectively raise processing capacity by leveling peak and off-peak workloads and automating operations. Conversely, if the Company can continue increasing sales while absorbing higher external costs, that would support the view that its operating capability is firmly embedded as an organizational competence.
• Property: an area where the launch of new services and the correction of low-margin projects are progressing at the same time
In Property, new on-site services such as Home Assist are operating stably and contributing to higher sales and higher profits. The key point is that the Company continues negotiating service fees with low-profitability clients in areas such as Park Assist and is working to optimize service content. In BPO, retaining low-margin projects solely for sales leads to operational exhaustion on the ground and chronically lower margins. The fact that the Company is trying to correct this is a sign that it values the quality of earnings, and the more the mix improves, the stronger its earnings structure will become.
• Global: continuing growth investment while securing profits, supporting long-term upside
In Global, the solid performance of healthcare programs and the acquisition of new clients are contributing to sales growth. The fact that the business has achieved higher profits even while making investments, such as hiring local staff to improve quality at overseas locations, can be interpreted as prioritizing long-term competitiveness over short-term profit maximization. While Global is less exposed than Automotive to domestic market maturity and rising costs, it is an area with a high degree of operational difficulty in terms of quality control, talent, and governance. It is therefore necessary to continuously monitor KPIs in the investment phase, including quality, retention, processing volume, and the repeatability of customer acquisition.
• Financial Guarantee: a high-margin growth engine, improving the business portfolio through the Group company Entrust
Financial Guarantee is maintaining double-digit growth in both sales and profits, supported not only by rent debt guarantees but also by the expansion of medical expense guarantees and eldercare expense guarantees. This indicates that the Company’s business extends beyond operations-based BPO and is capable of delivering high added value through processes such as screening, guarantees, and collections. A weakness of BPO is that margins tend to be pressured during periods of wage inflation, but businesses such as Financial Guarantee, where the source of added value lies more in operational capability, screening capability, data, and collection know-how, have relatively high margins and help stabilize the Company’s total earnings. The longer this area continues to grow, the closer the Company as a whole comes to becoming a structurally high-profit enterprise.
• Customer / IT / Social: should be positioned as complementary areas, with profitability and strategic significance assessed separately
Even with flat sales, Customer has grown profit, indicating room for operating improvement. On the other hand, IT has seen lower sales and lower profits, while Social remains in the red. At the company-wide level, this raises the question of what should be expanded, what should remain as a source of earnings, and what should be reduced or redesigned. This should be evaluated not in terms of simple expansion, but by separating strategic roles, such as internalizing operations, differentiation, quality, governance, and customer acquisition pathways, from profitability.
4. On the Overseas Business
Building medical, insurance, and payment systems overseas and evolving into higher-value-added BPO
In the Company’s Global Business, the medium-term business plan clearly outlines a strategy to increase touchpoints and strengthen linkages among services throughout the cycle, from before departure to return home, for expatriates and overseas travelers, thereby establishing an economic ecosystem around medical care and insurance. The principal services, overseas travel accident insurance attached services (OTAI), healthcare programs for expatriates (HCP), medical support programs (MSP), Japanese Help Desk (JHD), Premium Health Clinic (PHC), and the credit card business in the United States, are all designed to capture, as operations-based BPO. These areas require continuity of operation and have a high degree of urgency.
The source of competitive advantage indicated by the medium-term business plan lies not merely in front-desk operations, but in the Company’s ability to secure local medical networks and operating systems on an area basis. In particular, JHD has installed help desks for Japanese patients in 53 hospitals, mainly in Southeast Asia (as of the end of March 2024), and earns compensation for each support case through assistance with medical procedures. In addition, the Japan-focused clinics (PHC) operating in India and Mexico provide convenience and quality of service through a deep network with multiple locations in specific regions, and building such a tangible network could become a barrier to entry for competitors.
It is extremely important that this strategy has moved beyond concept and is beginning to translate directly into improved near-term performance. In FY3/2025, the Global Business achieved strong growth in both sales and profits, with sales of 8.934 billion yen (up 10.2% YoY) and an operating profit of 1.138 billion yen (up 41.3% YoY). In addition to new HCP client acquisitions and an increase in membership associated with area expansion among existing clients, margin improvement through fee revisions contributed to earnings growth.
Going forward, the investment issues can be distilled into whether the expansion of the membership base will lead not merely to greater scale but also to margin improvement through fee revisions and better operating efficiency, and whether the Company can absorb external variables such as medical-cost inflation, foreign exchange fluctuations, and geopolitical risk through its operating know-how. In addition, the extent to which top-line growth exceeds the increase in fixed costs accompanying network expansion, in other words, the degree of operating leverage, will also be a focus. As in the domestic BPO business, this is an area where the depth of operations determines profitability, so in terms of stock-price drivers, margins and the repeatability of the earnings model are likely to be valued more than sales growth. Quarterly trends in profitability and the progress of fee revisions will be the watershed that determines whether the overseas business is regarded not merely as a source of future growth potential but as a core area that actually contributes to lifting corporate value.
5. Major Shareholders, Shareholder Composition, and Implications for Supply and Demand
A structure in which heavy insider ownership provides the foundation for stable supply and demand, while trading by overseas asset managers can create short-term volatility
The Company has 127,176,300 shares outstanding, a free-float ratio of 66.5%, and institutional investors account for 55.2% of the free float. Shareholder distribution consists of 36.68% held by institutional investors, 33.53% by insiders, and 29.79% by others, with substantial insider ownership likely contributing to downside resilience in the medium- to long term. At the same time, the fact that institutional investors hold more than half of the free float also suggests that swings in supply and demand are readily reflected in the stock price.
Among the major shareholders, Shinichi Tamagami is the largest stable shareholder, holding 29.71% (37,789 thousand shares), and acts as an anchor for supply and demand. He is followed by Fidelity Management & Research with 6.42% (8,164 thousand shares), Valex Partners with 5.22%, Jupiter Asset Management with 3.80%, Amova Asset Management with 3.03%, and Vanguard with 2.50%, among other leading domestic and overseas asset managers. Looking at changes in shareholdings over the past six months, Amova increased its holdings by about 2.084 million shares and Sumitomo Mitsui Trust Asset Management by about 2.215 million shares, indicating that major institutional investors have increased their positions. Rather than being fixed and stable, the shareholder composition can be interpreted as leaving room for institutional investor positions to shift in response to stock price levels and market conditions.
In normal market conditions, insider holdings, including those of the founding family and related parties, provide a certain level of support, making the stock less prone to sharp declines. In market-wide risk-off phases, however, overseas investors may sell sizable holdings at once, making the stock more vulnerable to supply-and-demand-driven swings regardless of the Company’s earnings or news flow. To detect changes in supply and demand early, investors should continuously monitor major shareholder holdings, treasury stock, and the ratios of institutional ownership and free float, along with the progress of margin improvement and capital policy. If these factors improve and the stock enters a phase in which buying becomes easier and selling becomes less likely, thereby strengthening downside support, an increase in the holding ratio should be considered.
6. Management Policy, Medium-Term Business Plan, and Growth Scenario
The evaluation axes of the medium-term plan are margins and capital policy. The results of capacity expansion and DX will move the stock.
In its 8th Medium-Term Business Plan (from FY3/2025 to FY3/2027), the Company has set forth “Origin/Next 50: Connecting Growth” and indicated a policy of reviewing its “origin,” “strengths,” and “future vision” at the milestone of the 40th anniversary of its founding in FY3/2027. The targets for the final year of the plan are sales of 75.0 billion yen, operating profit of 10.0 billion yen, and ROE at 15%, reflecting a design in which sales and earnings are steadily accumulated while capital efficiency is improved.
The growth scenario can be organized around advancing both “increasing orders” and “raising profitability” simultaneously, against a backdrop of demand for operations-based BPO. As one of its strategies, the Company has positioned the expansion of supply capacity to create additional room for growth. In FY3/2025, it established satellite sites linked to large-scale BPO centers, securing capacity for approximately 700 seats. In addition, through measures such as withdrawing from low-profit projects, improving outsourcing capacity by establishing a satellite site in Misawa City, Aomori Prefecture, and promoting DX using AI technology, the Company achieved results in FY3/2025 close to plan. In other words, the key to execution under the medium-term plan lies in assuming strong demand, securing people and sites, and at the same time protecting and improving margins by lowering labor intensity through DX.
In terms of recent earnings topics, in addition to achieving record-high profit in cumulative Q3 FY3/2026 through growth in major businesses, attention should be paid to the fact that operations for newly acquired clients commenced in the Automotive and Global businesses. This confirms that the Company is successfully winning orders, and the next question is whether the start-up of operations can lead to margin improvement rather than ending in an initial phase of cost front-loading.
On capital policy, the Company has set out “shareholder returns and improvement in the capital structure with an awareness of capital cost.” The medium-term plan clearly states a target total return ratio of 70% or more by March 2027. As a concrete measure, share repurchases have been executed twice in 2025 under a cap of 750,000 shares, and the third round was executed in February 2026 after the repurchase limit had been expanded to an upper limit of 1,450,000 shares. This confirms that shareholder returns are being implemented not as a one-off measure, but with a certain degree of continuity.
What investors should monitor going forward is not only sales growth but also three points: (1) whether supply-capacity enhancement through satellites and other measures leads to improvements in utilization rates and productivity, (2) whether AI/DX absorbs cost increases and lifts the operating profit margin, and (3) whether the policy of a total return ratio of 70% or more is executed quantitatively and continuously. If these progress simultaneously, we believe the market’s evaluation axis will shift from scale expansion, that is, sales growth, to improved profitability and capital efficiency, and a correction in the stock’s valuation will follow.
7. Outline and Strategy of the Medium-Term Business Plan
How “Origin/Next 50: Connecting Growth” will be implemented in the business.
The first important point is that the Company positions growth not as mere sales expansion, but as a process of redesigning both its businesses and organization to respond to environmental changes over the next decade while passing on to the next generation the corporate culture, values, and strengths it has cultivated since its founding (= Origin) (= Next). BPO/operations-based businesses are less exposed to economic cycles, but because they are labor-intensive, the ceiling on growth is readily apparent. Acknowledging this constraint head-on, the medium-term plan presents as the pillars of its overall strategy: (1) creating additional room for growth through productivity improvement, (2) developing flow-type revenue models that do not depend on human capital, and (3) agile site deployment to enhance outsourcing capacity. In other words, the Company is envisioning a model in which it uses its traditional stock-type operating earnings as a base, organically expands volume while capturing adjacent areas to existing operations, and, in parallel, gradually shifts its earnings structure toward system- and AI-enabled flow-type models. This reflects the Company’s stance of seeking to incorporate external environmental changes, such as labor shortages, the use of AI, and the maturation of the domestic market, not as threats, but as opportunities for redesign.
The source of value is an operational trinity: contact center × IT/DX × field.
A keyword that succinctly expresses the Company’s competitiveness is the trinity of the contact center (operations at BPO sites), IT systems, and field services such as on-site dispatch, as presented in the medium-term plan as its conventional form of service delivery. This does not merely mean that it has a large menu of services; rather, it refers to a structure in which the Company can take control, end-to-end through data and operating design, of the core of clients’ workflows—reception, judgment, dispatch, and follow-up. In operations-based BPO, switching costs arise not only from the effort of migration, but from the risk of quality incidents and the burden of rebuilding governance. What the Company is aiming for is to position itself in areas where operating know-how, governance, and networks, including field capabilities through partner companies, become increasingly effective as clients’ operations become more advanced and complex. This is consistent with the Company’s emphasis that such areas do not easily become commoditized, even as AI spreads. Rather, AI is positioned not as a replacement for people, but as a means of simultaneously improving the quality and profitability of operations by incorporating voice recognition (Voice to Text) and LLMs (Azure OpenAI/GPT, etc.) to raise operator productivity, improve the accuracy of dispatch arrangements, and enhance efficiency through prediction.
(1) Automotive: extending a once-in-a-century transformation into “accidents, dispatch, and assessment.”
In the medium-term plan, the Company views the automotive industry as undergoing a once-in-a-century transformation. It highlights the expansion of service opportunities beyond conventional boundaries, against the backdrop of trends such as CASE, MaaS, EVs, autonomous driving, and connected vehicles. One specific example presented is the concept of extending emergency call services at the time of an accident via drive recorders to MaaS and public transportation, including local buses, taxis, and autonomous vehicles, and further into trouble response and crime prevention. In addition, the Company must aim not only to remain within accident response operations, but also to capture surrounding operations in the claims-assessment area of non-life insurance, where standards have become stricter in recent years, including accident assessment and insurance claim payment support. The Company’s next move here is to connect to flow-type models that do not rely on human capital, such as calculating damage amounts using AI-based image analysis. Automotive is large in scale, and margins are influenced by the quality of price revisions and operating-efficiency improvements, but the Company is attempting, in this area, to shift the center of value from operations to systems and thereby raise the ceiling on earnings.
(2) Property: expanding Home Assist from “housing” to “daily living,” and next-generation management (Smart Desk / Smart Call)
In Property, the Company clearly states that it will expand Home Assist, which dispatches personnel to handle water, electricity, and other issues, from a focus on owner-occupied condominiums to rental properties. In addition, in response to the structural issue of property management-staff shortages, it is rolling out next-generation management services. Specifically, this involves the IoT-enabled digitization of guidance, reception, and attendance via smartphone apps, tablets, and touchscreens, combined with the Company’s strengths in human operations that only people can perform, such as on-site dispatch, regular patrols, inspections, cleaning, and garbage disposal. Names such as Smart Desk and Smart Call function not merely as digital initiatives, but as interfaces for connecting to integrated customer services that combine operations and IT. Furthermore, the Company is broadening its perspective from “housing” to “daily living” and is developing adjacent areas, such as large-home appliance repair and pet services. Property is an area where the accumulation of data and operations is especially effective because there are many customer touchpoints, including residents, management companies, and owners, allowing the Company to target LTV expansion through horizontal service deployment.
(3) Global: deepening medical support for expatriates through healthcare programs
In Global, the Company indicates that new introductions of healthcare programs are expected to continue, driven by services for corporate expatriates and supported by the post-COVID recovery in human mobility. The key point is that it is not limiting itself to responding to medical issues overseas, but is adopting a strategy to expand earnings opportunities in expatriate medical support by increasing touchpoints, such as travel clinics at the time of assignment and medical checkups during temporary returns to Japan. Overseas, the Company has indicated a policy of expanding its service network through schemes that place help desks in hospitals to provide interpretation and document guidance, mainly by expanding locations in Asia, as well as by opening small clinics. While Global is difficult from the standpoint of quality control and governance, once an operating template is established, stickiness tends to be strong, making this an area where the Company can readily embody the stock-type business it emphasizes.
(4) Financial Guarantee: expanding into medical and eldercare guarantees with Entrust at the center
Financial Guarantee is positioned around guarantee-related businesses led by Entrust, and the Company clearly speaks of expansion not only in the solid real estate rental field, but also in medical guarantees and eldercare guarantees. In particular, it recognizes high latent demand for medical guarantees against the backdrop of rising unpaid receivables stemming from inbound demand and other factors, in addition to conventional nonpayment risk, and in eldercare guarantees, it refers to market opportunities based on the occurrence of a certain amount of nonperformance at serviced senior housing and similar facilities. While a weakness of operations-based BPO is margin pressure amid wage inflation, Financial Guarantee is better positioned to serve as a mechanism for raising the Company’s overall margin floor, as the source of added value lies more readily in screening, operations, collections, and other systems. As a result, the Company’s business portfolio moves away from sole dependence on labor intensity and becomes more effective at improving capital efficiency.
How to reduce dependence on human capital: flow-type revenue models and in-house IT/DX
The key point of the medium-term plan is that, in recognizing itself as “labor-intensive,” the Company places both productivity improvement and the development of flow-type revenue models on equal footing. As a concrete example of a flow-type model, the Company explains that it will expand a scheme in which the client’s telephone network is incorporated into the Company’s own contact center, operations are unified, including PBX and PI/CTI, and data are shared in real time, thereby generating revenue that does not depend on human capital. It also gives examples, such as systems that calculate accident damage amounts using AI, indicating an intention to go beyond outsourcing operations to system provision and the use of the client’s own human capital, thereby complementing labor shortages on the client side while preventing opportunity loss on the Company’s side.
Supporting this is IT/DX. The Company’s policy is to strengthen development and maintenance systems both in Japan and overseas, expand offshore development, internalize systems for BPO operations, and build labor-saving and automation systems that incorporate AI. The more this progresses, the more the Company’s competitive advantage will shift from the number of people it has to its ability to integrate operations and systems, simultaneously raising the ceiling on both margins and growth.
8. Performance Analysis (Long-Term Trend to Most Recent Results)
Stable growth continues; the focus is on the resilience of margins and the earnings contribution of rising orders
Backed by a recurring-revenue-oriented earnings structure driven by operations-based BPO, the Company’s performance has maintained a gradual, long-term growth trend in both sales and profits. Because mission critical assistance services, which are less susceptible to economic cycles, sit at the core, rapid expansion phases are limited, but the Company has also avoided large profit declines. The main Automotive Business, including roadside services and extended warranties for non-life insurers and automobile manufacturers, together with the Property Business, which handles housing and parking lot trouble response and home equipment extended warranties for real estate management companies and parking lot operators, has contributed to higher sales, and the characteristics of operations-based BPO have tended to enhance the stability of earnings.
As noted earlier, in FY3/2025, the Company recorded higher sales of 63.719 billion yen (up 8.5% YoY) and an operating profit of 7.961 billion yen (up 0.5% YoY). However, profit growth was limited due to higher labor costs and increased hiring-related expenses. Operating cash flow remained high at 7.840 billion yen, confirming that cash-generating capability itself remains sound. This structure, in which sales continue to grow while margins expand only modestly, is inferred to be one factor behind the stock remaining range-bound.
In cumulative Q3 FY3/2026, sales reached 52.621 billion yen (up 10.5% YoY) and operating profit 6.680 billion yen (up 11.3%), representing higher sales and higher profits and a new record-high level. In addition to growth in the core businesses, the start-up of operations for new clients contributed. What is important here is whether the increase in orders will not merely result in temporary start-up costs, but will spread into full-year margin improvement.
From a long-term perspective, the focus is on whether the pace of sales expansion indicated in the medium-term business plan can be maintained. For the stock to be re-rated, the key will be whether the Company can demonstrate not only sales growth but also a sustained upward trend in operating profit margins. In an environment of labor-cost inflation, margins can improve step by step if price revisions progress and the mix of higher-value-added projects increases. However, if hiring difficulties persist, workforce shortages may prevent the Company from fully meeting demand growth, potentially constraining sales growth. Going forward, the focus should be on the operating profit margin, which shows whether profits are keeping pace by absorbing cost increases; ROE, which indicates how much profit is generated using shareholders’ equity; and whether free cash flow, which serves as the source for growth investment and shareholder returns, is accumulating steadily.
9. Full-Year Earnings Forecast and Key Monitoring Points
Company guidance calls for 70.0 billion yen in sales and 8.5 billion yen in operating profit. Whether these can be achieved depends on absorbing labor costs and monetizing newly launched operations.
Under the Company’s full-year guidance for FY3/2026, it expects sales of 70.0 billion yen (up 9.9% YoY), operating profit of 8.5 billion yen (up 6.8%), ordinary profit of 8.9 billion yen (up 5.7%), net profit attributable to owners of parent of 5.3 billion yen (up 8.8%), and EPS of 41.80 yen. Cumulative progress through Q3 FY3/2026 stands at 52.621 billion yen in sales (75.2% of full-year guidance) and 6.680 billion yen in operating profit (78.6%), with profit progress outpacing sales progress. At this point, achieving Company guidance appears fully achievable. Heading into the fiscal year-end, the focus will be less on adding further sales than on whether the Company can absorb cost increases, maintain margins, and secure profits in line with plan.
There are three points from which we would like to check whether the Company can fully capture profits this fiscal year. The first is the defense of margins. In the previous fiscal year (FY3/2025), sales increased to 63.719 billion yen, but operating profit was 7.961 billion yen, and profit growth was limited, as higher labor costs and increased hiring-related expenses constrained it relative to sales growth. This year, we want to continue checking whether the Company has avoided reverting to the same pattern, namely, whether cost increases are being absorbed through price revisions and productivity improvements. The second is the monetization of new projects. The start-up of operations for newly acquired clients can be a factor in lifting sales, but during the launch phase, costs tend to come first. We would like to confirm whether profitability improves quarter by quarter and whether these projects are making a substantive contribution to full-year profit. The third is changes in business mix. As of Q3, profit progress is high in Automotive and Financial Guarantee, and Property is also solid, but IT and Social could weigh on earnings. It is necessary to determine whether growth in the strong businesses more than offsets the unprofitable areas and whether the pace of improvement in company-wide profit and loss remains on track with the company’s guidance.
What matters in judging whether full-year guidance can be achieved is not so much whether sales exceed assumptions, but whether cost increases are being absorbed and whether the operating profit margin is being maintained and improved. Specifically, at each earnings announcement, we would like to confirm whether factors such as securing personnel, utilization rates, and the success of price increases are reflected in quarterly profits. The planned annual dividend for FY3/2026 is 26 yen. If confidence in achieving the profit plan rises, the sense of dividend security is also likely to come into focus and become a support for the stock price.
10. Balance Sheet, Cash Flow, and Capital Allocation
Defense lies in cash; offense lies in making margins and capital policy visible.
The Company has net cash of 19.35 billion yen and a conservative financial structure that is effectively debt-free. This level is equivalent to about 23% of its market capitalization, which is 88.1 billion yen. Operations-based BPO is a business that requires ongoing operating investment, including in talent acquisition and site development. A clear strength is that, even in economic downturns or temporary periods of cost increases, the Company is unlikely to face funding constraints due to its strong financial structure. At the same time, if cash and deposits remain elevated, this could affect PER and PBR levels from a capital-efficiency standpoint, making the policy for allocating cash on hand an important factor in assessing fair value. The Company has also stated in its medium-term business plan that it will review invested capital, lower its equity ratio from 64.3% to the 50% range, and increase shareholder returns so that equity does not build up excessively, which is welcome from an investor perspective.
Operating cash flow in FY3/2025 was high at 7.840 billion yen, confirming cash generation consistent with earnings. This is not a business like manufacturing that requires permanent large-scale capital expenditures; the center of cash flow for investing is limited to operating and growth investments, such as the acquisition of fixed assets. Therefore, as long as operating cash flow remains stable, free cash flow is also in a position to accumulate easily. Under this structure, the Company continues to deliver shareholder returns through dividends and share repurchases, and plans an annual dividend of 26 yen for FY3/2026. As long as stable operating cash flow continues, the source of funds available to return to shareholders through dividends and the like should persist.
From a capital-efficiency standpoint, the Company achieves returns above the cost of capital, with ROIC of 11.48% and ROE of 10.7%. In theory, this is a phase in which internal reinvestment creates economic value. As long as the quality of growth investments is maintained, financial flexibility will be a source of value expansion. However, if margins remain sluggish and cash merely accumulates, the market is more likely to focus on an excess-capital discount. Investors need to confirm (1) the stability of operating cash flow, (2) whether growth investment is leading to margin improvement, and (3) whether dividends and share repurchases are being carried out continuously. We believe that when the market judges not only that the Company has a strong balance sheet but also that it is allocating its funds toward margin improvement and shareholder returns, the stock can move out of its historical range, and valuation can improve.
11. Capital Efficiency and Economic Value Creation (ROE / ROIC–WACC)
ROIC exceeds the cost of capital. The next focus is on maintaining sound returns on capital and capital allocation.
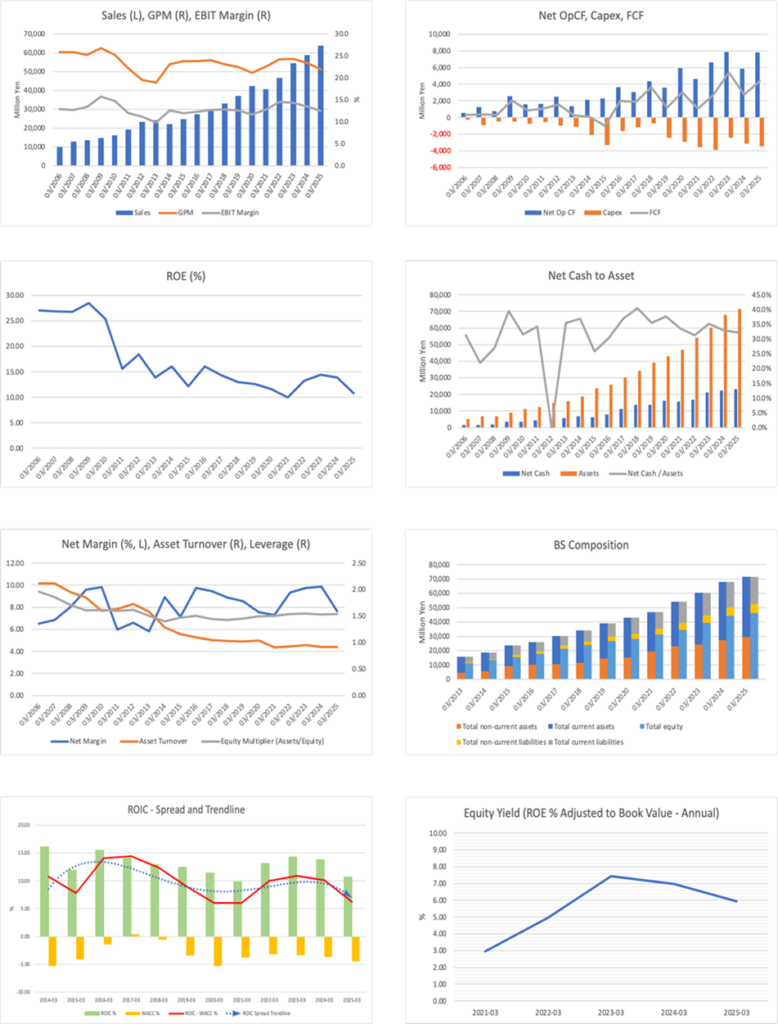
Quantitatively, the Company’s capital efficiency is in value-creation territory. ROIC is 11.48%, WACC is 4.47%, and ROIC–WACC is +7.01 percentage points. In other words, the Company’s invested capital at present is generating earning power that sufficiently exceeds its cost of capital. In theory, reinvestment contributes to the accumulation of economic value (EVA). ROE is also at a double-digit level at 10.7%, and the next focus is whether the Company can maintain and extend this favorable level of capital efficiency.
What investors emphasize is not so much the absolute levels of ROIC or WACC as whether the situation in which ROIC exceeds WACC can be sustained. If rising labor costs and hiring difficulties persist over the long term, the cost burden will increase, operating margins will come under pressure, and as a result, ROIC will tend to decline,e and the excess spread will narrow. Conversely, if price revisions penetrate, the mix of higher-value-added projects increases, utilization rates improve, and productivity improves through DX. Operating margins can be improved, maintained, and expanded. It is therefore important not only to confirm whether sales are growing, but also whether the operating profit margin is rising, or at least not falling, in judging whether ROIC can remain above WACC.
Another important issue is how capital is used. In phases where net cash is substantial, even if profits are being generated, equity tends to accumulate, and ROE growth can slow. That said, the Company has clearly set out in its medium-term business plan a policy of reviewing invested capital and lowering the equity ratio to the 50% range, thereby presenting a path toward improving ROE through capital structure optimization. In addition, by targeting a total return ratio of 70% or more and actually executing share repurchases, the Company is showing management’s intention not to leave an excess-capital discount in place, which can be viewed positively. The key to the Company’s ability to increase shareholder value lies in its ability to maintain a situation in which ROIC exceeds WACC in the core business while steadily improving ROE through capital policy, such as dividends and share repurchases. The Company has clearly indicated that direction in its medium-term plan, has already begun execution, and expects continued progress.
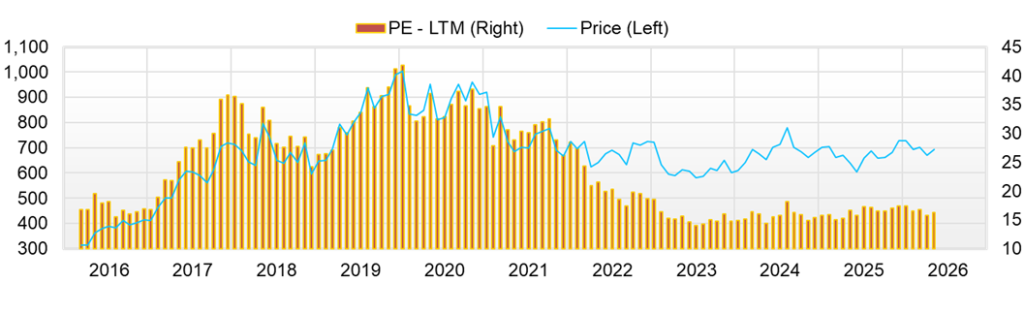
12. Share Price Trend and Current Valuation
The stock is range-bound. The catalysts for an upside breakout are margin improvement and continued capital policy.
The Company’s current share price is around 700 yen, giving it a market capitalization of about 88.1 billion yen. Over the past year, the shares have traded between a low of 586 yen (June 23, 2025) and a high of 762 yen (January 19, 2026). The stock has recovered from the low but has not reached the high and currently sits near the middle of the range. Valuation stands at a forward PER of 15.75x and an actual PBR of 1.85x. Based on the Company’s forecast annual dividend of 26 yen and a share price around 700 yen, the dividend yield is in the high-3% range, suggesting that stable earnings and the shareholder-return stance are already discounted to some extent.
Subtracting the Company’s net cash of 19.35 billion yen from market capitalization gives an enterprise value (EV) of about 68.8 billion yen. Against the FY3/2026 operating profit forecast of 8.5 billion yen, EV/operating profit is about 8x. Furthermore, using forecast net profit (EPS of 41.8 yen multiplied by shares outstanding) to calculate a PER after deducting net cash yields approximately 13x, indicating that the earnings multiple after adjusting for cash is lower than the ordinary PER of about 16x.
The downside in the stock price is likely to be supported by cash and dividends. However, for the stock to break out of its range, it will be necessary for two things to occur at the same time: operating profit margin improvement must be confirmed over multiple quarters, and capital policy, including share repurchases, must be shown in a quantitative and continuous manner.
Short-term risk is characterized by the fact that the market tends to discount cost overruns and changes in supply and demand ahead of the actual quality of earnings itself. First, in an environment in which hiring difficulties and wage increases continue, margins can come under pressure before anything else even if sales remain firm, creating situations in which the stock adjusts before earnings guidance is revised downward. Second, price revisions tend to take time to negotiate, and if the timing or scope of revisions is delayed, margins become difficult to read in the interim. Also from the standpoint of shareholder composition, in risk-off phases investors may sell Japanese equities in size as overseas investors adjust risk, and as a result the Company’s shares may be sold purely because of supply-and-demand factors regardless of the Company’s earnings or news flow. Furthermore, in phases in which the stock is valued at a relatively high PER, if the Company reports earnings where profit falls short of investor expectations even amid sales growth, valuation multiples are more likely to be discounted and the stock price may fall. In addition, if the continuity of share repurchases and the return policy becomes unclear, the market is likely to interpret that as a weakening of downside support, and even with a dividend yield, the stock could retreat toward the lower end of its historical range. Accordingly, in the short term, the key variables for the stock price are likely to be the movement of the operating profit margin, the degree of improvement in hiring and utilization, progress in price revisions, and the execution status of shareholder return measures, rather than sales growth alone.
13. Consideration of Fair Value
The current share price level broadly discounts resilient earnings and the shareholder return stance. The upside factors are confirmation of sustained margin improvement and continuity of returns.
First, we work backward from PER and PBR to infer what the market is discounting. Using a market capitalization of 88.1 billion yen, a forward PER of 15.75x, and an actual PBR of 1.85x, the market-implied forecast net profit is about 5.6 billion yen (= 88.1 ÷ 15.75), and year-end equity is about 47.6 billion yen (= 88.1 ÷ 1.85). The market-implied ROE derived from this is around 11% to 12%, which is close to the previous year’s actual ROE of 10.7%. In other words, the market appears to value stable earnings, but is not yet discounting a further step-up in margins or a major strengthening of shareholder returns.
Next, in a PER-based analysis, using the Company’s FY3/2026 full-year net profit plan of 5.3 billion yen (EPS of 41.80 yen) as the starting point and assuming a range of 14x to 18x (centered on 15.75x) as the appropriate multiple for stable earnings, implied equity value is broadly 74.0 billion yen to 95.0 billion yen (with a central value in the low-80-billion-yen range). The current market capitalization of 88.1 billion yen lies within that range, suggesting that a higher market capitalization would require either an upward revision to earnings or a re-rating in the valuation multiple. From a PBR perspective, applying a range of 1.6x to 2.2x to the inferred equity of about 47.6 billion yen yields approximately 76.0 billion yen to 105.0 billion yen, placing the current share price around the midpoint.
The Company’s earning power generated by the business (ROIC) substantially exceeds its cost of capital (WACC): ROIC is 11.48%, WACC is 4.47%, and the excess spread is +7.01 percentage points. In other words, the Company is currently in a position where it uses capital effectively to generate profits, and, in theory, this makes it difficult for PBR to collapse materially. At the same time, whether this sizeable spread can be maintained going forward depends on the direction of margins. If rising labor costs and hiring difficulties persist, the spread is likely to narrow. Conversely, if price revisions penetrate, the business shifts to higher value-added offerings, utilization rates improve, and productivity rises through DX, then the spread should be easier to maintain. Accordingly, ROIC supports the view that PBR is unlikely to sink to an extremely low level, while also serving as an indicator confirming that whether the share price and PBR can move meaningfully higher depends on margin improvement and the continuity of capital policy.
DCF is treated as a reference because of its high sensitivity to assumptions. Using FY3/2025 operating cash flow of 7.840 billion yen and fixed asset acquisitions of 3.444 billion yen, the simple FCF is estimated at 4.4 billion yen, but this omits the effects of working capital and other factors and can vary significantly depending on the assumed normalized level. With a WACC of 4.47% and a terminal growth rate of 0% to 1%, the implied enterprise value (EV) ranges from around 100.0 billion yen to just under 130.0 billion yen. Equity value could move higher after adding net cash of 19.35 billion yen, but the result depends heavily on the assumptions.
Looking at the overlap among the enterprise values indicated by the three methods of PER, PBR, and ROIC, the indicative range for equity value (market capitalization) falls broadly between 76.0 billion yen and 100.0 billion yen, with the midpoint in the low-90-billion-yen range. The current market capitalization of 88.1 billion yen is near this level, so that the current share price can be interpreted as close to broadly fair value. For the share price to move meaningfully higher from here, two conditions will likely need to be met simultaneously: operating profit margin improvement must be confirmed over multiple quarters, and shareholder returns, including dividends and share repurchases, must be presented quantitatively and executed on an ongoing basis.
14. Final Investment View Based on Performance, Capital Efficiency, and Fair Value
The basic stance is to continue holding; the source of alpha is structural margin improvement and continued returns.
The Company’s current position, with a market capitalization of 88.1 billion yen, a forward PER of 15.75x, and an actual PBR of 1.85x, broadly discounts its stable earnings, operations-based BPO business, cash-generating capability, and shareholder returns. The FY3/2026 full-year forecast, which appears achievable, calls for sales of 70.0 billion yen, operating profit of 8.5 billion yen, net profit of 5.3 billion yen, and a dividend of 26 yen. Thus, there is little concern about a short-term downturn in earnings. In terms of capital efficiency, ROIC exceeds WACC, ensuring the foundation for economic value creation. However, the sizeable net cash balance of 19.35 billion yen could become a factor capping valuation if capital policy lacks clarity. Under the medium-term plan, the Company has set out “Origin/Next 50: Connecting Growth,” and seeks to improve capital efficiency, including from an ROE perspective. In addition, its target of a total return ratio of 70% or more, and the execution of share repurchases and additional repurchases are factors that could reduce the excess-capital discount.
Taking the above into account, the final investment view is to continue holding over the medium- to long-term. Rather than seeking to trade short-term share-price movements, the main source of return should be positioned as the accumulation of corporate value through margin improvement and progress in capital policy, while collecting dividends.
The conditions that would justify increasing the holding ratio can be distilled into the simultaneous achievement of two things: operating profit margins moving upward over multiple quarters through price revisions, the accumulation of higher-value-added projects, and improved utilization rates; and the return policy being implemented quantitatively and continuously. Conversely, if margins come under more pressure than expected because wage increases and hiring difficulties persist for longer, if contract terms with major customers deteriorate, if the mix shifts toward lower-margin work rather than higher-margin work, or if capital policy becomes ambiguous and excess funds remain idle on the balance sheet, these would become downside factors for both earnings and the stock price. In conclusion, the current phase is one in which investors hold a high-quality stable stock in an appropriate valuation range and determine the next action by confirming progress in margins and capital policy.
15. Why Growth Tends to Stall, and Why It Still Looks Like a Good Company
Companies whose shares tend to remain range-bound over the long term have some common features. First, they are growing, but acceleration is difficult to see. BPO grows through the accumulation of projects, but there are phases in which profit growth is not straightforward because of supply constraints and start-up costs. Second, they are strongly affected by the external environment, including wages and hiring, making the upper limit of margins relatively visible. Third, when cash and equity are substantial, the market tends to find it difficult to assign a higher valuation to the company as long as it appears to be leaving capital idle, even when there is room to improve capital efficiency. When these factors overlap, the result is a stock that is difficult to drive down but also difficult to drive up.
Even so, the Company is favored by high-quality shareholders because the quality of the business and the strength of the balance sheet support long-term downside resilience. Since the essence of BPO lies in stable operations and customer continuity, the greatest risk is a loss of trust from a single incident, but the Company has continued to operate across multiple fields and has built a track record. In addition, the growth of high-margin areas such as Financial Guarantee has improved the Company’s overall earnings portfolio. As a result, for investors who emphasize dividends and the accumulation of corporate value over short-term themes, the shares become easier to consider for long-term holding.
Key stock price data
Key financial data
| Unit: million yen | 2020 | 2021 | 2022 | 2023 | 2024 | 2025 CE |
| Sales | 40,618 | 46,744 | 54,563 | 58,739 | 63,720 | 70,000 |
| EBIT (Operating Income) | 5,185 | 6,783 | 7,814 | 7,922 | 7,946 | |
| Pretax Income | 5,343 | 7,118 | 8,375 | 9,093 | 8,405 | |
| Net Profit Attributable to Owner of Parent | 2,969 | 4,357 | 5,319 | 5,791 | 4,870 | 5,300 |
| Cash & Short-Term Investments | 16,310 | 18,238 | 21,671 | 22,790 | 23,408 | |
| Total assets | 46,756 | 54,029 | 60,273 | 67,836 | 71,591 | |
| Total Debt | 567 | 1,373 | 469 | 381 | 321 | |
| Net Debt | -15,744 | -16,865 | -21,202 | -22,409 | -23,086 | |
| Total liabilities | 13,867 | 17,463 | 18,455 | 20,612 | 21,949 | |
| Total Shareholders’ Equity | 31,072 | 34,517 | 39,329 | 44,300 | 46,292 | |
| Net Operating Cash Flow | 4,631 | 6,610 | 7,888 | 5,884 | 7,841 | |
| Capital Expenditure | 3,568 | 3,905 | 2,458 | 3,140 | 3,444 | |
| Net Investing Cash Flow | -4,137 | -4,346 | -2,539 | -2,614 | -3,870 | |
| Net Financing Cash Flow | -1,357 | -764 | -2,250 | -2,377 | -3,197 | |
| Free Cash Flow | 1,063 | 2,706 | 5,430 | 2,744 | 4,397 | |
| ROA (%) | 6.62 | 8.65 | 9.31 | 9.04 | 6.99 | |
| ROE (%) | 9.99 | 13.29 | 14.40 | 13.85 | 10.75 | |
| EPS (Yen) | 23.2 | 34.0 | 41.6 | 45.3 | 38.3 | 41.8 |
| BPS (Yen) | 242.5 | 270.5 | 307.3 | 347.8 | 365.1 | |
| Dividend per Share (Yen) | 7.00 | 8.50 | 11.00 | 12.00 | 24.00 | 26.00 |
| Shares Outstanding (Million shares) | 128.06 | 128.19 | 128.45 | 128.68 | 128.68 |
Source: Calculated by Omega Investment based on FactSet’s standard criteria, rounded to the nearest whole number.
Share price
Financial data (quarterly basis)
| Unit: million yen | 2024/3 | 2025/3 | 2026/3 | ||||||
| 3Q | 4Q | 1Q | 2Q | 3Q | 4Q | 1Q | 2Q | 3Q | |
| (Income Statement) | |||||||||
| Sales | 14,982 | 14,994 | 15,049 | 15,721 | 16,831 | 16,119 | 16,724 | 17,677 | 18,221 |
| Year-on-year | 5.0% | 6.3% | 8.1% | 5.9% | 12.3% | 7.5% | 11.1% | 12.4% | 8.3% |
| Cost of Goods Sold (COGS) | 11,519 | 11,404 | 11,836 | 12,277 | 12,988 | 12,581 | 13,257 | 13,798 | 14,135 |
| Gross Income | 3,463 | 3,590 | 3,213 | 3,444 | 3,843 | 3,538 | 3,467 | 3,879 | 4,086 |
| Gross Income Margin | 23.1% | 23.9% | 21.4% | 21.9% | 22.8% | 21.9% | 20.7% | 21.9% | 22.4% |
| SG&A Expense | 1,466 | 1,523 | 1,483 | 1,444 | 1,573 | 1,571 | 1,532 | 1,558 | 1,662 |
| EBIT (Operating Income) | 1,997 | 2,067 | 1,730 | 2,000 | 2,270 | 1,967 | 1,935 | 2,321 | 2,424 |
| Year-on-year | -9.3% | 14.8% | -8.5% | 1.6% | 13.7% | -4.8% | 11.9% | 16.1% | 6.8% |
| Operating Income Margin | 13.3% | 13.8% | 11.5% | 12.7% | 13.5% | 12.2% | 11.6% | 13.1% | 13.3% |
| EBITDA | 2,514 | 2,610 | 2,244 | 2,572 | 2,883 | 2,595 | 2,530 | 2,936 | 3,102 |
| Pretax Income | 2,122 | 2,864 | 1,663 | 2,283 | 2,454 | 2,006 | 2,015 | 2,669 | 2,735 |
| Consolidated Net Income | 1,628 | 2,096 | 917 | 1,617 | 1,591 | 1,390 | 1,192 | 1,860 | 1,713 |
| Minority Interest | 131 | 159 | 132 | 171 | 157 | 185 | 179 | 212 | 183 |
| Net Income ATOP | 1,497 | 1,937 | 786 | 1,446 | 1,434 | 1,205 | 1,013 | 1,649 | 1,530 |
| Year-on-year | 14.9% | 24.4% | -26.9% | 12.7% | -4.2% | -37.8% | 28.9% | 14.0% | 6.7% |
| Net Income Margin | 10.0% | 12.9% | 5.2% | 9.2% | 8.5% | 7.5% | 6.1% | 9.3% | 8.4% |
| (Balance Sheet) | |||||||||
| Cash & Short-Term Investments | 19,872 | 22,790 | 22,551 | 22,220 | 21,961 | 23,408 | 24,715 | 26,941 | 28,222 |
| Total assets | 64,621 | 67,836 | 69,365 | 69,254 | 70,794 | 71,591 | 75,493 | 77,896 | 82,027 |
| Total Debt | 313 | 381 | 250 | 188 | 188 | 321 | 4,686 | 4,561 | 8,868 |
| Net Debt | -19,559 | -22,409 | -22,301 | -22,033 | -21,774 | -23,086 | -20,030 | -22,379 | -19,354 |
| Total liabilities | 19,821 | 20,612 | 21,349 | 20,756 | 21,659 | 21,949 | 26,685 | 27,154 | 31,207 |
| Total Shareholders’ Equity | 42,048 | 44,300 | 45,057 | 45,372 | 45,972 | 46,292 | 45,433 | 47,146 | 47,197 |
| (Profitability %) | |||||||||
| ROA | 8.80 | 9.04 | 8.34 | 8.43 | 8.27 | 6.99 | 7.04 | 7.20 | 7.06 |
| ROE | 13.57 | 13.85 | 12.87 | 12.95 | 12.73 | 10.75 | 11.27 | 11.46 | 11.58 |
| (Per-share) Unit: JPY | |||||||||
| EPS | 11.7 | 15.2 | 6.2 | 11.3 | 11.3 | 9.5 | 8.0 | 13.0 | 12.2 |
| BPS | 330.2 | 347.8 | 353.7 | 355.8 | 362.0 | 365.1 | 358.9 | 373.7 | 376.4 |
| Dividend per Share | 0.00 | 6.00 | 0.00 | 12.00 | 0.00 | 12.00 | 0.00 | 13.00 | 0.00 |
| Shares Outstanding (million shares) | 128.68 | 128.68 | 128.68 | 128.68 | 128.68 | 128.68 | 127.18 | 127.18 | 127.18 |
Source: Calculated by Omega Investment based on FactSet’s standard criteria, rounded to the nearest whole number.
Financial data (full-year basis)
| Unit: million yen | 2016 | 2017 | 2018 | 2019 | 2020 | 2021 | 2022 | 2023 | 2024 | 2025 |
| (Income Statement) | ||||||||||
| Sales | 27,328 | 29,478 | 33,119 | 37,196 | 42,378 | 40,618 | 46,744 | 54,563 | 58,739 | 63,720 |
| Year-on-year | 11.0% | 7.9% | 12.4% | 12.3% | 13.9% | -4.2% | 15.1% | 16.7% | 7.7% | 8.5% |
| Cost of Goods Sold | 20,818 | 22,389 | 25,477 | 28,837 | 33,392 | 31,422 | 35,441 | 41,264 | 44,981 | 49,682 |
| Gross Income | 6,510 | 7,089 | 7,642 | 8,359 | 8,985 | 9,195 | 11,303 | 13,299 | 13,757 | 14,038 |
| Gross Income Margin | 23.8% | 24.0% | 23.1% | 22.5% | 21.2% | 22.6% | 24.2% | 24.4% | 23.4% | 22.0% |
| SG&A Expense | 3,164 | 3,321 | 3,412 | 3,672 | 4,052 | 3,962 | 4,461 | 5,471 | 5,836 | 6,092 |
| EBIT (Operating Income) | 3,346 | 3,755 | 4,226 | 4,678 | 4,934 | 5,185 | 6,783 | 7,814 | 7,922 | 7,946 |
| Year-on-year | 13.3% | 12.2% | 12.5% | 10.7% | 5.5% | 5.1% | 30.8% | 15.2% | 1.4% | 0.3% |
| Operating Income Margin | 12.2% | 12.7% | 12.8% | 12.6% | 11.6% | 12.8% | 14.5% | 14.3% | 13.5% | 12.5% |
| EBITDA | 4,275 | 4,724 | 5,194 | 5,674 | 6,041 | 6,340 | 8,307 | 9,627 | 9,926 | 10,274 |
| Pretax Income | 3,747 | 4,154 | 4,594 | 4,839 | 5,345 | 5,343 | 7,118 | 8,375 | 9,093 | 8,405 |
| Consolidated Net Income | 2,698 | 2,883 | 3,146 | 3,416 | 3,497 | 3,305 | 4,707 | 5,775 | 6,379 | 5,515 |
| Minority Interest | 29 | 94 | 209 | 231 | 304 | 337 | 350 | 457 | 587 | 645 |
| Net Income ATOP | 2,669 | 2,789 | 2,937 | 3,185 | 3,193 | 2,969 | 4,357 | 5,319 | 5,791 | 4,870 |
| Year-on-year | 51.8% | 4.5% | 5.3% | 8.5% | 0.2% | -7.0% | 46.8% | 22.1% | 8.9% | -15.9% |
| Net Income Margin | 9.8% | 9.5% | 8.9% | 8.6% | 7.5% | 7.3% | 9.3% | 9.7% | 9.9% | 7.6% |
| (Balance Sheet) | ||||||||||
| Cash & Short-Term Investments | 8,757 | 11,751 | 14,184 | 15,015 | 17,089 | 16,310 | 18,238 | 21,671 | 22,790 | 23,408 |
| Total assets | 26,006 | 30,186 | 34,131 | 39,024 | 42,892 | 46,756 | 54,029 | 60,273 | 67,836 | 71,591 |
| Total Debt | 857 | 605 | 358 | 1,160 | 916 | 567 | 1,373 | 469 | 381 | 321 |
| Net Debt | -7,901 | -11,146 | -13,827 | -13,856 | -16,173 | -15,744 | -16,865 | -21,202 | -22,409 | -23,086 |
| Total liabilities | 8,164 | 8,100 | 9,052 | 11,284 | 12,990 | 13,867 | 17,463 | 18,455 | 20,612 | 21,949 |
| Total Shareholders’ Equity | 17,733 | 21,240 | 23,945 | 26,430 | 28,363 | 31,072 | 34,517 | 39,329 | 44,300 | 46,292 |
| (Cash Flow) | ||||||||||
| Net Operating Cash Flow | 3,644 | 3,032 | 4,324 | 3,571 | 5,934 | 4,631 | 6,610 | 7,888 | 5,884 | 7,841 |
| Capital Expenditure | 1,642 | 1,159 | 702 | 2,423 | 2,927 | 3,568 | 3,905 | 2,458 | 3,140 | 3,444 |
| Net Investing Cash Flow | -1,773 | -852 | -1,817 | -2,744 | -2,797 | -4,137 | -4,346 | -2,539 | -2,614 | -3,870 |
| Net Financing Cash Flow | -228 | 1,042 | -166 | -79 | -1,267 | -1,357 | -764 | -2,250 | -2,377 | -3,197 |
| Free Cash Flow | 2,002 | 1,873 | 3,621 | 1,148 | 3,007 | 1,063 | 2,706 | 5,430 | 2,744 | 4,397 |
| (Profitability ) | ||||||||||
| ROA (%) | 10.73 | 9.93 | 9.13 | 8.71 | 7.80 | 6.62 | 8.65 | 9.31 | 9.04 | 6.99 |
| ROE (%) | 16.10 | 14.31 | 13.00 | 12.65 | 11.66 | 9.99 | 13.29 | 14.40 | 13.85 | 10.75 |
| Net Margin (%) | 9.77 | 9.46 | 8.87 | 8.56 | 7.54 | 7.31 | 9.32 | 9.75 | 9.86 | 7.64 |
| Asset Turn | 1.10 | 1.05 | 1.03 | 1.02 | 1.03 | 0.91 | 0.93 | 0.95 | 0.92 | 0.91 |
| Assets/Equity | 1.50 | 1.44 | 1.42 | 1.45 | 1.50 | 1.51 | 1.54 | 1.55 | 1.53 | 1.54 |
| (Per-share) Unit: JPY | ||||||||||
| EPS | 21.3 | 22.0 | 23.0 | 24.9 | 25.0 | 23.2 | 34.0 | 41.6 | 45.3 | 38.3 |
| BPS | 141.0 | 167.0 | 187.5 | 206.6 | 221.5 | 242.5 | 270.5 | 307.3 | 347.8 | 365.1 |
| Dividend per Share | 3.50 | 4.50 | 6.00 | 6.50 | 7.00 | 7.00 | 8.50 | 11.00 | 12.00 | 24.00 |
| Shares Outstanding (million shares) | 125.45 | 126.75 | 127.66 | 127.88 | 128.02 | 128.06 | 128.19 | 128.45 | 128.68 | 128.68 |
Source: Calculated by Omega Investment based on FactSet’s standard criteria, rounded to the nearest whole number.