2026-07-27
Home
Japanese

Omega Investment Co., Ltd.
BlueMeme (Company note – 1Q update)

| Share price (9/27) | ¥1,080 | Dividend Yield (25/3 CE) | – % |
| 52weeks high/low | ¥855/1,917 | ROE(24/3 act) | 6.6 % |
| Avg Vol (3 month) | 3.9 thou shrs | Operating margin (24/3 act) | 10.1 % |
| Market Cap | ¥3.8 bn | Beta (5Y Monthly) | 0.2 |
| Enterprise Value | ¥1.6 bn | Shares Outstanding | 3.58 mn shrs |
| PER (25/3 CE) | 18.5 X | Listed market | TSE Growth |
| PBR (24/3 act) | 1.5 X |
| Click here for the PDF version of this page |
| PDF version |
Seemingly weak 1Q results but steady progress towards the medium-term management plan.
◇ FY3/2025 1Q financial highlights
BlueMeme (hereafter referred to as the Company) announced on 14 August 2024 its financial results for 1Q FY3/2025, with net sales of 510 million yen (-15% YoY), operating loss of 40 million yen, ordinary loss of 40 million yen and net loss attributable to owner of parent 40 million yen. Note that all of these profits were surpluses in the same period of the previous year. The order backlog at the end of the period, a KPI, was 490 million yen (-7% YoY), and pro forma EBITDA was 10 million yen (-86% YoY), both of which were severe figures.
The current financial year is a period of upfront investments and costs, including the development of Digital Labor , which is key to future growth, and in the quarter under review, personnel-related costs and business development-related costs were spent as planned. In addition to this, the decline in sales has resulted in lower profits.
The following are the reasons for the decline in sales. Firstly, there was a rush demand in the previous year following the revision (price increase) of the Outsystems’ license price, which has now been reversed. Secondly, the contribution to sales has been pushed back due to the longer lead time required to win orders due to more extensive business negotiations.
Despite these challenging figures, there seems to be little reason to believe that latent demand for the low-code agile methods by the Company is diminishing or that competition is becoming more challenging. The increase in the size of business negotiations mentioned earlier can be seen as a reflection of positive expectations for the Company’s services.
◇ Started implementing Digital Labor on actual projects
According to the Company’s release on 13 August 2024, Digital Labor has been implemented in an actual project and demonstrated a significant reduction in development time. Although details are unavailable, it indicates that a reasonable level of automatic generation is becoming possible commercially in low-code development, and the development of Digital Labor is progressing well.
◇ Full-year forecasts
The Company has not disclosed earnings forecasts for 2Q. Full-year forecasts remain unchanged, with net sales of 3.1 billion (+23% YoY), operating profit of 250 million yen (-1% YoY), ordinary profit of 250 million yen (-1% YoY) and net profit attributable to owners of parent of 200 million yen (+14% YoY). The Company has also maintained its forecast of no dividend for the full year.
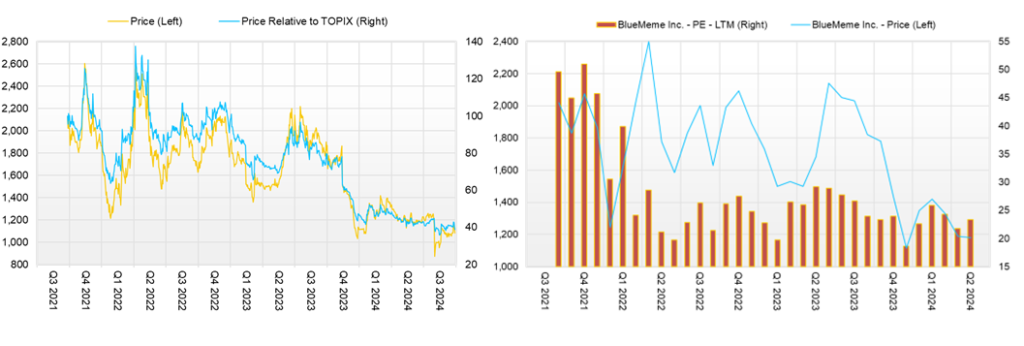
◇ Share price trends and future highlights
The Company’s share price had been flat at around 1,200 yen since May 2024, but in August, the share price fell to 855 yen as the overall stock market plummeted. The 1Q results announcement itself did not significantly impact the share price, as the Company’s share price subsequently recovered in line with the market recovery. However, the recent share price has yet to return to the 1,200 yen level, which it had been until July and is now hovering around the 1,000 yen level.
A share buyback of up to 100,000 shares, with a maximum value of 100 million yen, was also decided on 20 August 2024. However, the more essential points that will move the share price are as follows.
First, will the progress ratios against the full-year plan improve from 2Q onwards? Orders are of particular interest, and if more extensive business negotiations are concluded, this will lead to a significant increase in orders and order backlog, leading to an increase in pro forma EBITDA.
Second, progress in the development of Digital Labor. The current development phase is the stage of automating low-code engineer-led development, and the system’s effectiveness is expected to be verified in actual projects. Furthermore, the development of Digital Labor is scheduled to move on to business architects, who are further upstream in the system development process, and the progress and results of this development will be closely watched.
Company profile
BlueMeme Inc.(hereafter referred to as the Company) is a pioneer in Japan in the development of ‘low-code agile methods’ and was the first company in Japan to introduce OutSystems’ low-code technology after its establishment in 2006. It has been providing system development services based on this. The Company is actively investing in promoting its unique automation concept called ‘Digital Labor ’. This initiative is expected to overcome the issue of the shortage and uneven distribution of IT personnel in Japan and accelerate DX initiatives not only in large companies but also in small and medium-sized enterprises (SMEs) while at the same time improving the Company’s productivity. As a result, the Company expects its revenues to grow dramatically when the development of Digital Labor technology moves into the payback phase.
Key financial data
| Unit: million yen | 2019/3 | 2020/3 | 2021/3 | 2023/3 | 2024/3 | 2025/3 CE |
| Sales | 1,800 | 2,102 | 1,942 | 2,289 | 2,507 | 3,100 |
| EBIT (Operating Income) | 32 | 175 | 375 | 358 | 256 | 250 |
| Pretax Income | 31 | 174 | 355 | 343 | 252 | 250 |
| Net Profit Attributable to Owner of Parent | 11 | 130 | 259 | 260 | 175 | 200 |
| Cash & Short-Term Investments | 584 | 645 | 2,356 | 2,225 | 2,229 | |
| Total assets | 1,273 | 1,395 | 3,351 | 3,556 | 3,734 | |
| Total Debt | 5 | 5 | 5 | 5 | 5 | |
| Net Debt | -2,223 | -2,223 | -2,223 | -2,223 | -2,223 | |
| Total liabilities | 914 | 871 | 953 | 896 | 1,125 | |
| Total Shareholders’ Equity | 2,609 | 2,609 | 2,609 | 2,609 | 2,609 | |
| Net Operating Cash Flow | 175 | 183 | 338 | 95 | 252 | |
| Capital Expenditure | 69 | 69 | 69 | 69 | 69 | |
| Net Investing Cash Flow | -13 | -21 | -10 | -47 | -107 | |
| Net Financing Cash Flow | 60 | -100 | 1,382 | -179 | -142 | |
| Free Cash Flow | 184 | 184 | 184 | 184 | 184 | |
| ROA (%) | 0.92 | 9.76 | 10.92 | 7.52 | 4.80 | |
| ROE (%) | 2.99 | 29.51 | 17.73 | 10.27 | 6.64 | |
| EPS (Yen) | 3.3 | 40.7 | 80.3 | 74.0 | 50.5 | |
| BPS (Yen) | 112.1 | 163.7 | 701.4 | 750.5 | 762.9 | |
| Dividend per Share (Yen) | 0.00 | 0.00 | 0.00 | 0.00 | 0.00 | |
| Shares Outstanding (Million shares) | 3.20 | 3.20 | 3.41 | 3.52 | 3.56 |
Source: Omega Investment from company data, rounded to the nearest whole number.
Share price
Quarterly topics
The industry position the Company aims to achieve
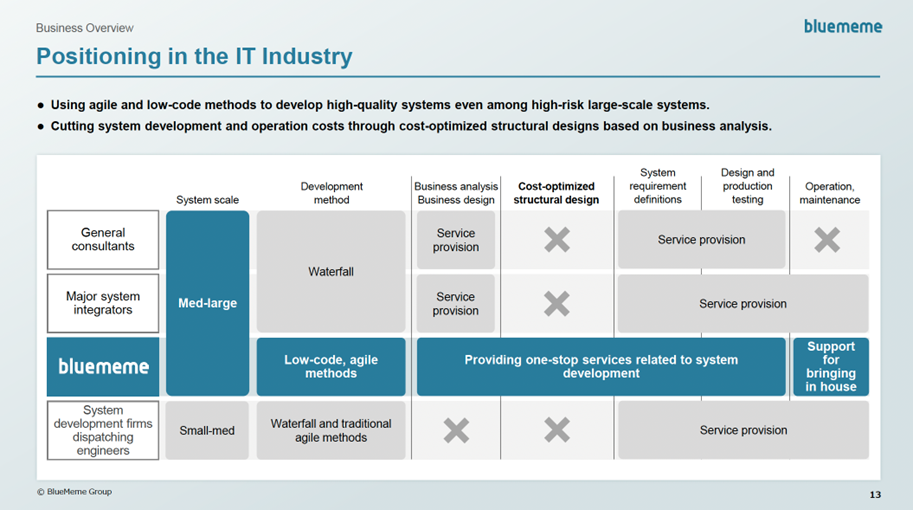
Source: Company materials
The value the Company provides to its customers: low-cost, agile system development and operation by customer in-house teams
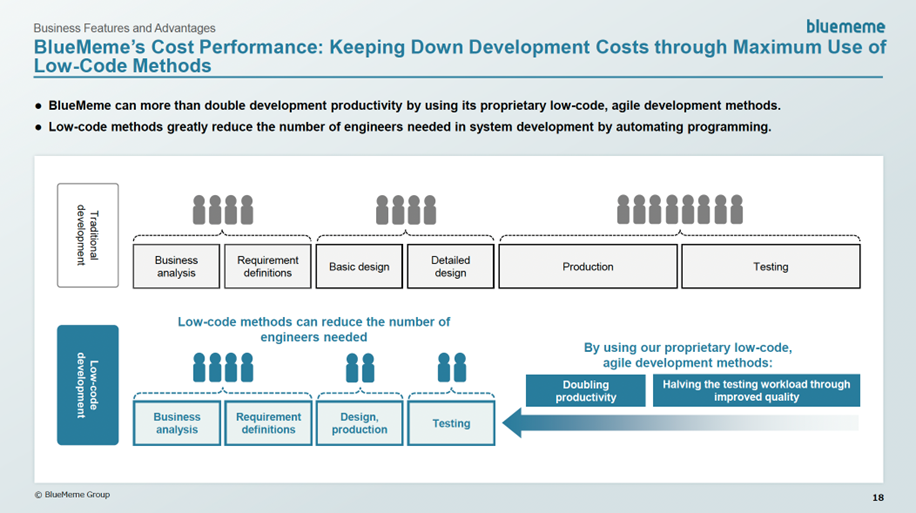
Source: Company materials
The value the Company provides to its customers: low-cost, agile system development and operation by customer in-house teams (contd.)
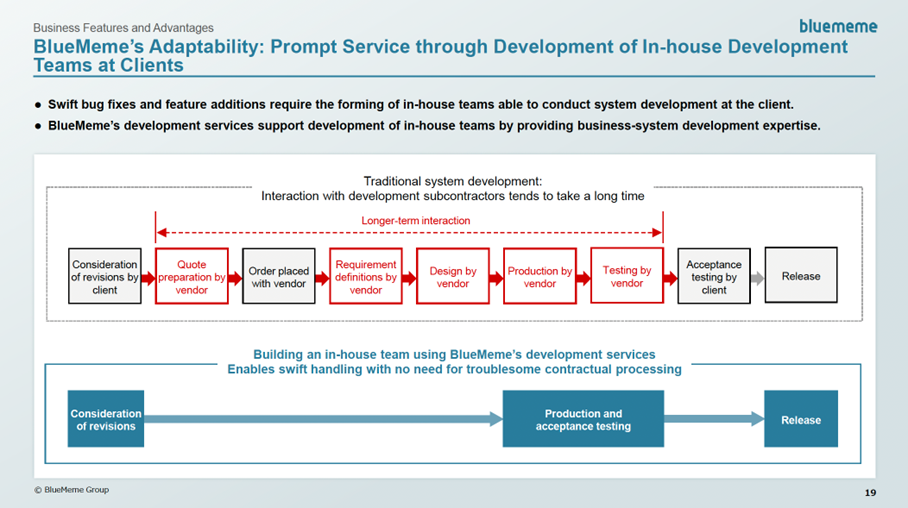
Source: Company materials
The Company’s competitive advantage
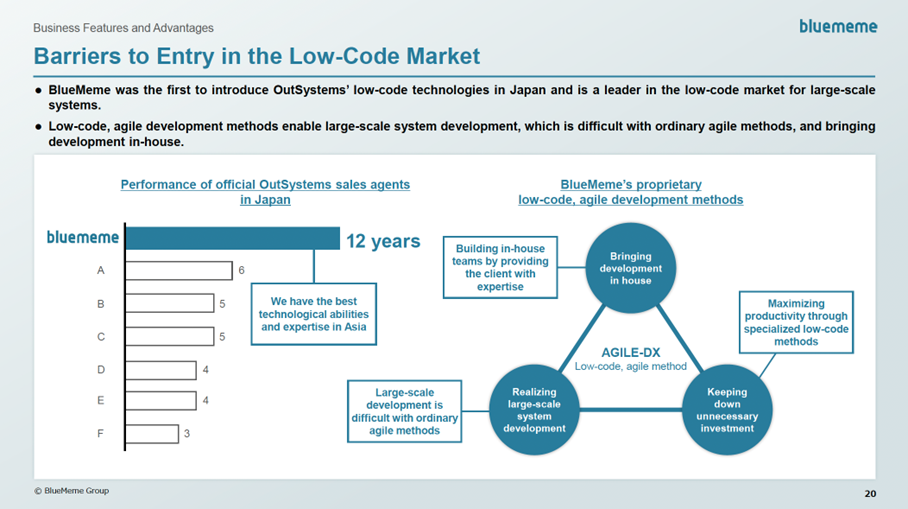
Source: Company materials
What is Digital Labor ?
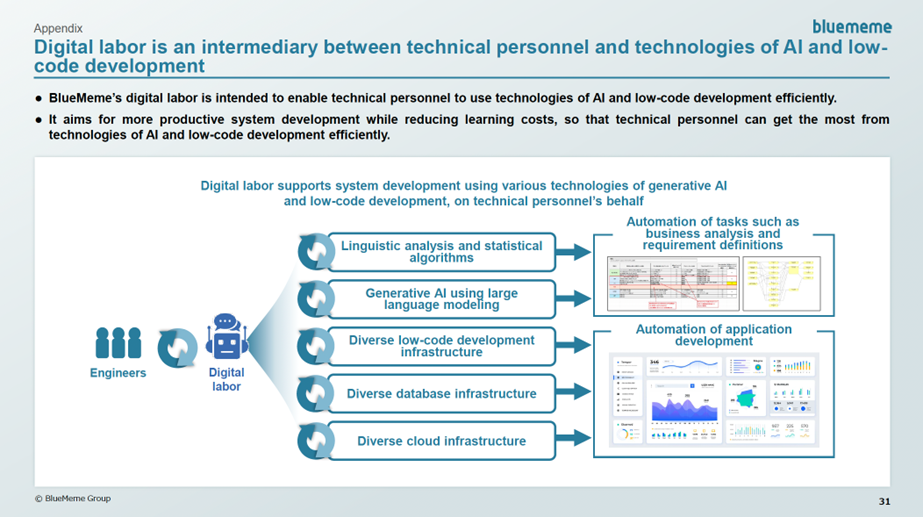
Source: Company materials
Stages in the development of Digital Labor
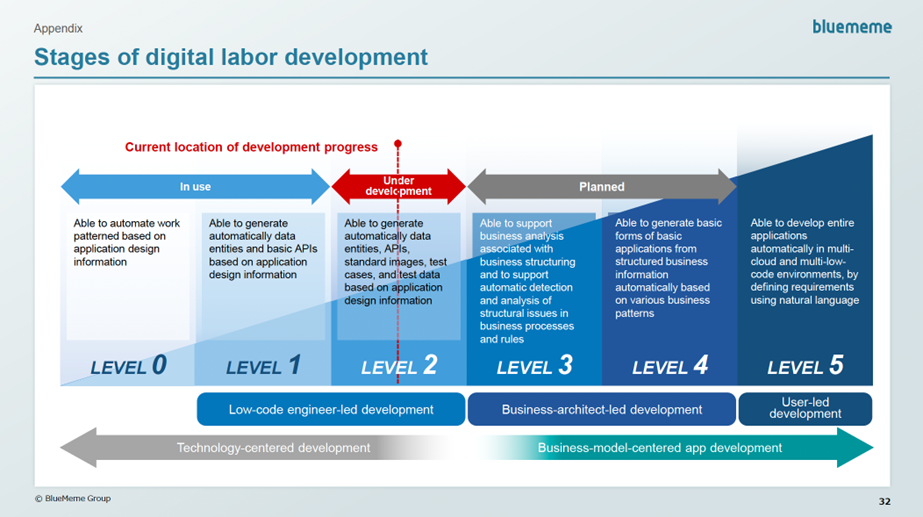
Source: Company materials
Digital Labor and the Company’s productivity improvement prospects
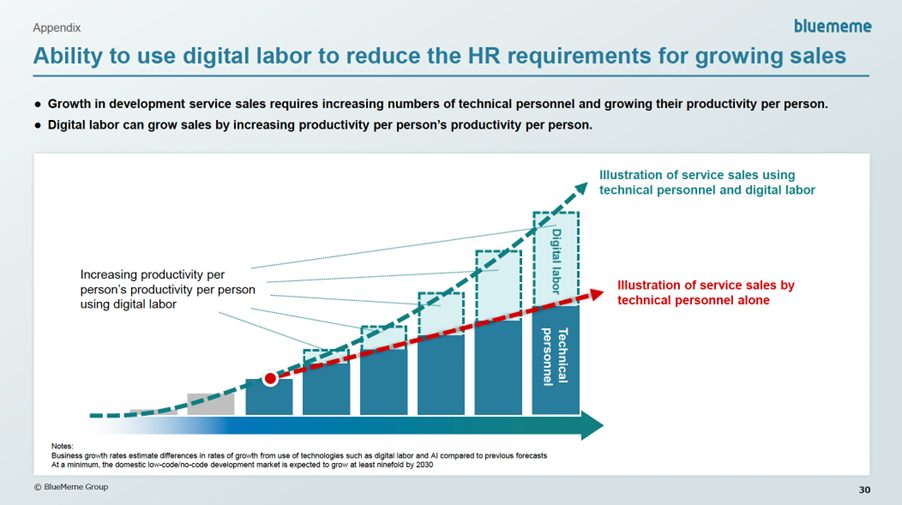
Source: Company materials
Digital Labor and the Company’s revenue structure outlook
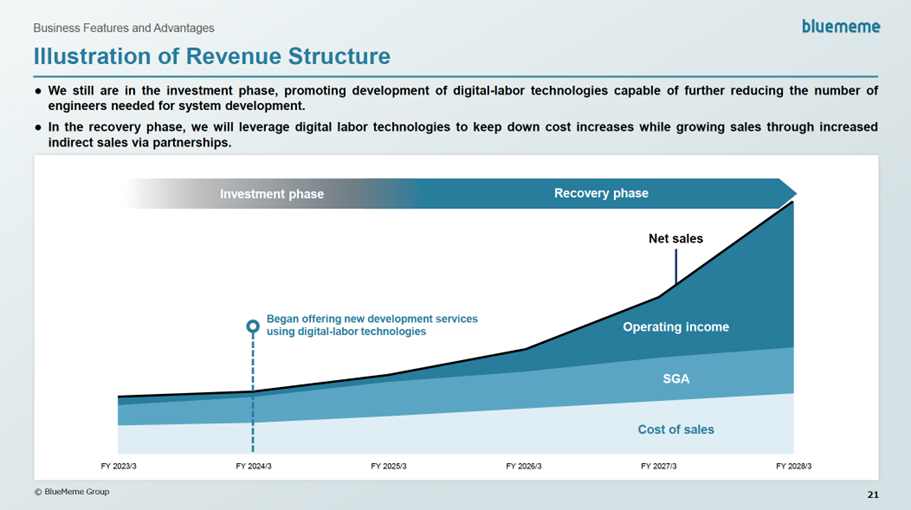
Source: Company materials
Financial data (quarterly basis)
| Unit: million yen | 2023/3 | 2024/3 | 2025/3 | ||||||
| 1Q | 2Q | 3Q | 4Q | 1Q | 2Q | 3Q | 4Q | 1Q | |
| (Income Statement) | |||||||||
| Sales | 517 | 586 | 551 | 634 | 614 | 595 | 593 | 705 | 517 |
| Year-on-year | 23.4% | 25.5% | 0.4% | 25.2% | 18.6% | 1.4% | 7.6% | 11.1% | -15.8% |
| Cost of Goods Sold (COGS) | 253 | 285 | 290 | 301 | 297 | 302 | 308 | 334 | 267 |
| Gross Income | 264 | 301 | 261 | 334 | 316 | 292 | 286 | 371 | 250 |
| Gross Income Margin | 51.1% | 51.4% | 47.4% | 52.6% | 51.5% | 49.2% | 48.1% | 52.7% | 48.4% |
| SG&A Expense | 203 | 194 | 206 | 198 | 236 | 256 | 252 | 266 | 292 |
| EBIT (Operating Income) | 61 | 107 | 55 | 135 | 80 | 37 | 33 | 105 | -42 |
| Year-on-year | -8.0% | 6.1% | -62.2% | 115.6% | 31.9% | -65.6% | -39.3% | -22.1% | -151.9% |
| Operating Income Margin | 11.8% | 18.3% | 10.0% | 21.4% | 13.1% | 6.2% | 5.6% | 15.0% | -8.1% |
| EBITDA | 66 | 112 | 60 | 141 | 84 | 41 | 38 | 112 | -36 |
| Pretax Income | 56 | 105 | 58 | 123 | 79 | 36 | 32 | 106 | -47 |
| Consolidated Net Income | 37 | 71 | 38 | 115 | 45 | 13 | 20 | 97 | -50 |
| Minority Interest | 0 | 0 | 0 | 0 | 0 | 0 | 0 | 0 | 0 |
| Net Income ATOP | 37 | 71 | 38 | 115 | 45 | 13 | 20 | 97 | -50 |
| Year-on-year | -1.6% | 5.1% | -62.0% | 106.2% | 23.9% | -81.7% | -47.2% | -15.8% | -209.5% |
| Net Income Margin | 7.1% | 12.0% | 6.8% | 18.1% | 7.4% | 2.2% | 3.4% | 13.7% | -9.6% |
| (Balance Sheet) | |||||||||
| Cash & Short-Term Investments | 2,267 | 2,392 | 2,377 | 2,225 | 2,194 | 2,191 | 2,070 | 2,229 | 2,047 |
| Total assets | 3,253 | 3,383 | 3,348 | 3,556 | 3,440 | 3,366 | 3,294 | 3,734 | 3,297 |
| Total Debt | 94 | 69 | 45 | 5 | 23 | 27 | 22 | 5 | NA |
| Net Debt | -2,173 | -2,323 | -2,332 | -2,220 | -2,171 | -2,164 | -2,048 | -2,223 | NA |
| Total liabilities | 809 | 866 | 792 | 896 | 847 | 825 | 735 | 1,125 | 734 |
| Total Shareholders’ Equity | 2,444 | 2,516 | 2,556 | 2,660 | 2,594 | 2,541 | 2,559 | 2,609 | 2,563 |
| (Profitability %) | |||||||||
| ROA | 8.83 | 8.19 | 6.06 | 7.52 | 8.02 | 6.25 | 5.81 | 4.80 | 2.37 |
| ROE | 12.09 | 11.02 | 8.19 | 10.27 | 10.66 | 8.33 | 7.55 | 6.64 | 3.10 |
| (Per-share) Unit: JPY | |||||||||
| EPS | 10.5 | 20.2 | 10.7 | 32.4 | 12.9 | 3.7 | 5.8 | 28.3 | -14.5 |
| BPS | 699.1 | 717.2 | 725.2 | 750.5 | 745.6 | 736.3 | 741.6 | 762.9 | 747.3 |
| Dividend per Share | 0.00 | 0.00 | 0.00 | 0.00 | 0.00 | 0.00 | 0.00 | 0.00 | 0.00 |
| Shares Outstanding(Million Shares) | 3.49 | 3.51 | 3.52 | 3.55 | 3.56 | 3.56 | 3.56 | 3.56 | 3.58 |
Source: Omega Investment from company materials
Financial data (full-year basis)
| Unit: million yen | 2020/3 | 2021/3 | 2022/3 | 2023/3 | 2024/3 |
| (Income Statement) | |||||
| Sales | 1,800 | 2,102 | 1,942 | 2,289 | 2,507 |
| Year-on-year | 20.3% | 16.8% | -7.6% | 17.9% | 9.5% |
| Cost of Goods Sold | 1,276 | 1,411 | 878 | 1,129 | 1,241 |
| Gross Income | 525 | 691 | 1,064 | 1,160 | 1,266 |
| Gross Income Margin | 29.1% | 32.9% | 54.8% | 50.7% | 50.5% |
| SG&A Expense | 493 | 516 | 689 | 802 | 1,010 |
| EBIT (Operating Income) | 32 | 175 | 375 | 358 | 256 |
| Year-on-year | -63.2% | 448.8% | 114.0% | -4.5% | -28.5% |
| Operating Income Margin | 1.8% | 8.3% | 19.3% | 15.6% | 10.2% |
| EBITDA | 47 | 193 | 395 | 378 | 274 |
| Pretax Income | 31 | 174 | 355 | 343 | 252 |
| Consolidated Net Income | 11 | 130 | 259 | 260 | 175 |
| Minority Interest | 0 | 0 | 0 | 0 | 0 |
| Net Income ATOP | 11 | 130 | 259 | 260 | 175 |
| Year-on-year | -82.7% | 1133.6% | 98.9% | 0.3% | -32.7% |
| Net Income Margin | 0.6% | 6.2% | 13.3% | 11.3% | 7.0% |
| (Balance Sheet) | |||||
| Cash & Short-Term Investments | 584 | 645 | 2,356 | 2,225 | 2,229 |
| Total assets | 1,273 | 1,395 | 3,351 | 3,556 | 3,734 |
| Total Debt | 347 | 212 | 101 | 5 | 5 |
| Net Debt | -237 | -433 | -2,256 | -2,220 | -2,223 |
| Total liabilities | 914 | 871 | 953 | 896 | 1,125 |
| Total Shareholders’ Equity | 359 | 524 | 2,398 | 2,660 | 2,609 |
| (Cash Flow) | |||||
| Net Operating Cash Flow | 175 | 183 | 338 | 95 | 252 |
| Capital Expenditure | 9 | 21 | 9 | 4 | 69 |
| Net Investing Cash Flow | -13 | -21 | -10 | -47 | -107 |
| Net Financing Cash Flow | 60 | -100 | 1,382 | -179 | -142 |
| Free Cash Flow | 173 | 180 | 330 | 91 | 184 |
| (Profitability %) | |||||
| ROA | 0.92 | 9.76 | 10.92 | 7.52 | 4.80 |
| ROE | 2.99 | 29.51 | 17.73 | 10.27 | 6.64 |
| Net Profit Margin | 0.59 | 6.20 | 13.34 | 11.34 | 6.98 |
| Asset Turnover | 1.57 | 1.58 | 0.82 | 0.66 | 0.69 |
| Financial Leverage | 3.24 | 3.02 | 1.62 | 1.37 | 1.38 |
| (Per-share) Unit: JPY | |||||
| EPS | 3.3 | 40.7 | 80.3 | 74.0 | 50.5 |
| BPS | 112.1 | 163.7 | 701.4 | 750.5 | 762.9 |
| Dividend per Share | 0.00 | 0.00 | 0.00 | 0.00 | 0.00 |
| Shares Outstanding (Million Shares) | 3.20 | 3.20 | 3.41 | 3.52 | 3.56 |
Source: Omega Investment from company materials