INNOVATION HOLDINGS (Company note – 2Q update)

Transition to a holdings company on October 1
Revised up full-term OP by +35% to record high on 1H results
| Click here for the PDF version of this page |
| PDF Version |
SUMMARY
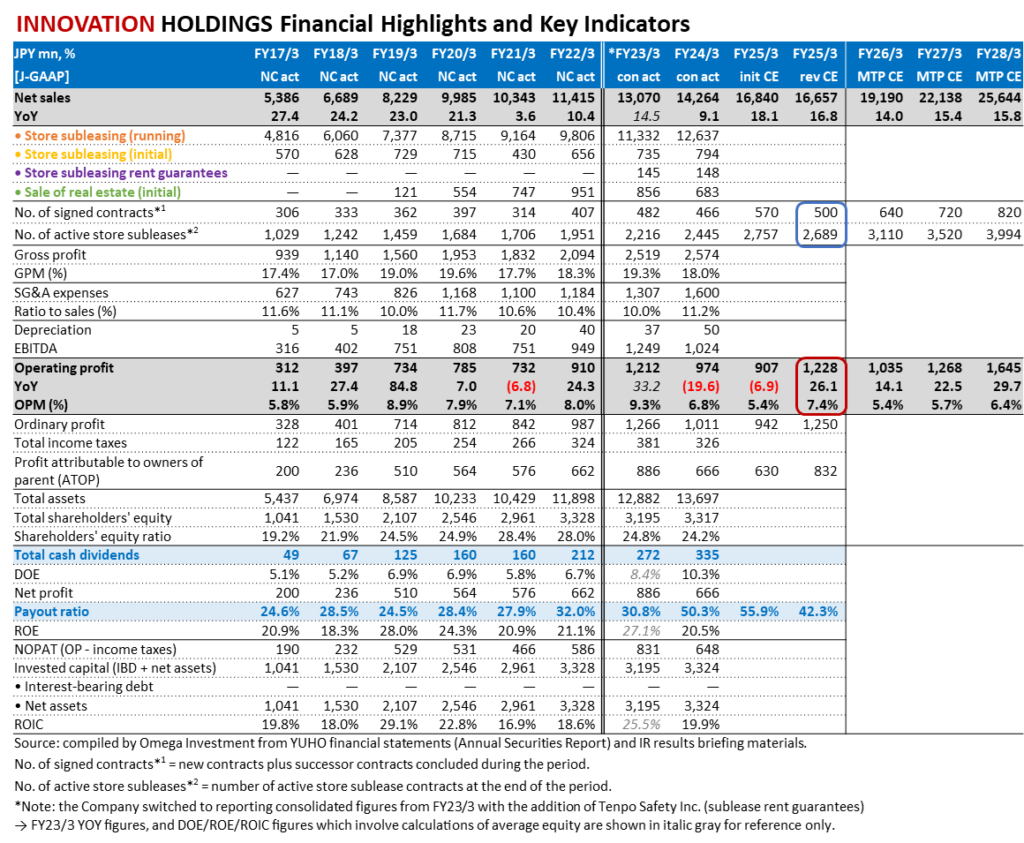
- By transitioning to a holding company structure, the holding company now oversees the management of the entire Group, while each subsidiary focuses on promoting its own business, thereby maximizing the corporate value of the Group. Relative to the initial forecasts for 1H OP -17.3%, the sharp improvement in GPM from 17.8% → 18.6% and control of SG&A absorbing increased personnel costs resulted in 1H consolidated OP rising +30.1% YoY, beating the initial forecast by 57%, and the Company accordingly revised up full-term forecasts, now forecasting record profit. Relative to the 1H OP overshoot of JPY 250mn, the new forecast assumes 2H OP was revised up by JPY 71mn.
- From FY24/3, the Company announced a change to its dividend policy, effectively raising the target payout ratio from the 30% level to the 40% level. Since listing, total cash dividends have grown at +31.5% CAGR, with DOE topping 10% in FY24/3. While making the necessary investments to accelerate growth going forward, the Company is also strengthening shareholder returns as a priority management issue. The current DY is trading 63% above its historical average, and P/E and EV/EBITDA are 27% and 33% below their respective historical averages. Omega Investment believes the disconnect between profit growth and current weak share price is unsustainable.
INNOVATION HOLDINGS Sustainable double-digit growth with high stability

Source: compiled by Omega Investment from IR results briefing materials. Red arrow indicates FY25/3 revised CE.
Financial Indicators
| Share price (12/20) | 922 | 25.3 P/E (CE) | 18.6x |
| YH (24/1/4) | 1,050 | 25.3 EV/EBITDA (CE) | 9.4x |
| YL (24/8/5) | 805 | 24.3 ROE (act) | 20.5% |
| 10YH (23/3/10) | 1,340 | 24.3 ROIC (act) | 19.9% |
| 10YL (20/4/6) | 477 | 24.9 P/B (act) | 4.48x |
| Shrs out. (mn shrs) | 17.674 | 25.3 DY (CE) | 2.28% |
| Mkt cap (¥ bn) | 16.295 | | |
| EV (¥ bn) | 12.007 | | |
| Equity ratio (9/30) | 24.4% | | |
Omega Investment’s case for INNOVATION HOLDINGS as an attractive opportunity
Over the last 7 fiscal years since listing in Oct-2017 through FY24/3, net sales have grown at +14.9% CAGR, OP has grown at +17.7% CAGR, and total cash dividends have grown at +31.5% CAGR, with DOE topping 10% in FY24/3, and the payout ratio topping 50%. As can be seen from the graph on the bottom of P1, double-digit growth in active store sublease contracts is both remarkably stable and sustainable, uncorrelated with the underlying restaurant market, and the Company revised up full-term FY25/3 profit forecasts along with 1H results. There is a disconnect with strong profit growth and the current share price.
INNOVATION HOLDINGS subleased store properties are uncorrelated with the market
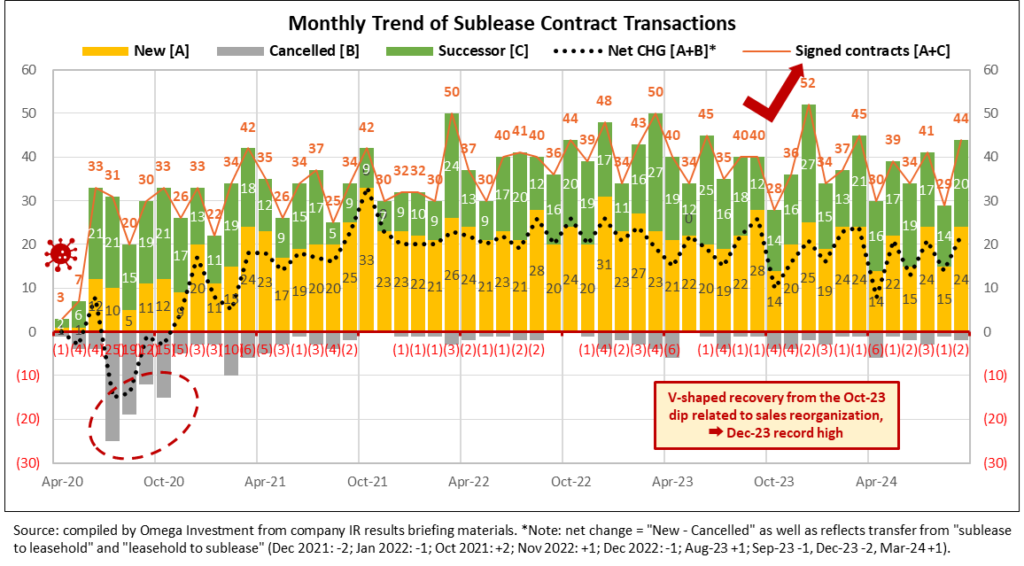
Even during the height of COVID-19 in 2020, active subleased stores only dipped slightly, closing up YOY for the fiscal year. The strength of the business model can be summarized as careful selection of store properties mainly in central Tokyo (①the store property is on the 1F facing a street (regardless of station proximity), ②monthly rent is affordable in absolute terms (averaging around ¥400k/mo.), and ③the property is a vacated-furnished store (lowers the initial investment cost)) are ALWAYS in high demand. Average turnover has been quite consistent over time, equivalent to roughly 10% every year, or 50% every 5 years. Relative to pre-pandemic level (Sep-2019) 1,584 stores, TI active subleased store properties increased +61% to 2,545 stores in Sep-2024, or +10% CAGR over 5 years.
Monthly trend of subleased store properties: stable and sustainable high growth

Source: compiled by Omega Investment from company IR results briefing materials.
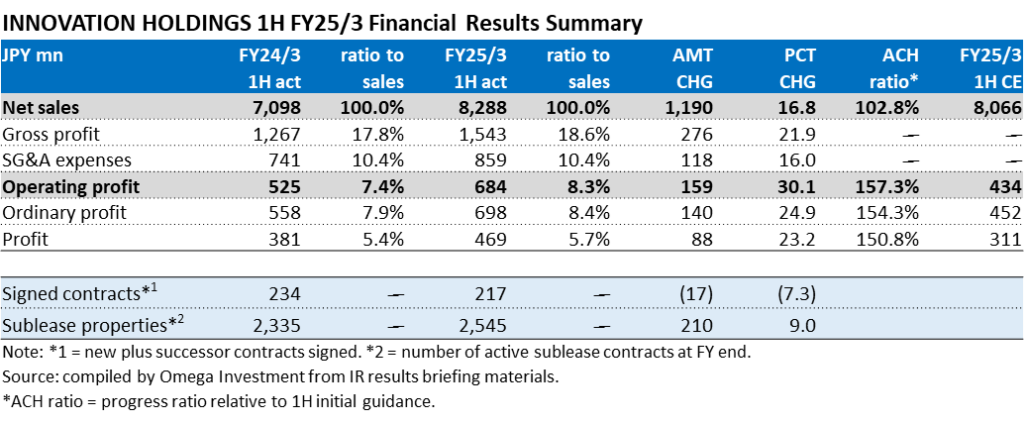
1H FY25/3 consolidated net sales +16.8% and OP +30.1%
In the restaurant industry, sales and the number of customers increased mainly in urban areas and tourist destinations, helped by the recovery in inbound visitors driven by the weak yen. For drinking establishments, the number of customers during late hours and the demand for large banquets gradually returned, but store operators continued to struggle with high raw materials and utilities costs, and the labor shortage. While the number of contracts signed (new + successor) decreased by 7.3% due to the ongoing reorganization of sales, the quarterly trend improved from 1Q 103 → 2Q 114), and store subleasing segment sales increased +10.9% on sublease properties up 210 to 2,545, +9.0%. Segment OP rose +34.1% due to GPM up sharply on reduced procurement costs (vacancy rent associated with aggressive procurement last term) and contract renewals, as well as control of SG&A expenses.
Real estate trading business posted a strong quarterly contribution in Q2 on the sale of one large property, with 1H segment sales increasing +8.0%, and segment OP increasing +13.7%. The new subsidiary Asset Innovation sold 3 properties and acquired 6 (Q2 sold 2 and acquired 5), bringing total inventory to 7 as of the end of September. As can be seen from the table below, relative to the initial forecasts for 1H OP -17.3%, the sharp improvement in GPM from 17.8% → 18.6% and control of SG&A absorbing increased personnel costs (see OP change factor analysis graph on P5) resulted in 1H consolidated OP rising +30.1% YoY, beating the initial forecast by 57%, and the Company accordingly revised up full-term forecasts shown on the bottom of P5.
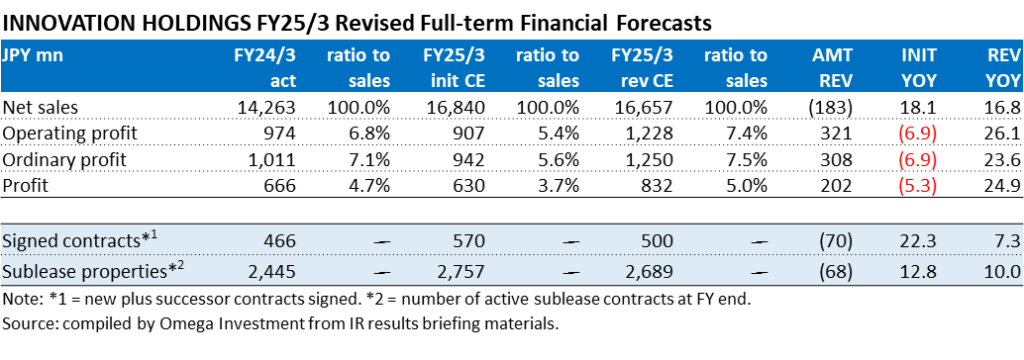
Revised 2H forecasts appear conservative Relative to the 1H OP overshoot of JPY 250mn, the revised full-term forecast only assumes 2H OP was revised up by JPY 71mn. This can be partially explained by the 1H net sales overshoot of JPY 222mn driven in part by the sale of one large property, while 2H net sales were revised down by JPY 405mn on revising down full-term targets for signed contracts and active subleased store properties by 70 and 68, respectively (see table on P5), GPM improvement and SG&A control are likely to continue, and the effect of sales reorganization should also begin to emerge, leaving a buffer in Omega’s view.

1H FY25/3 Increase/Decrease OP Change Factor Analysis (JPY mn)

INNOVATION HOLDINGS Annual Sales Breakdown by Revenue Category (JPY mn)

FY24/3 consolidated net sales +9.1% and OP -19.6%
As described in Part 1, restaurant industry sales in 2023 increased for the second consecutive year, driven by steady normalization of customer traffic with the downgrade of COVID to Class 5 and lifting of immigration restrictions around golden week, prompting a recovery of inbound tourists. However, while total sales for all formats increased +14.1% YoY, a large component was the 7.3% increase in average spend reflecting inflation. The environment for restaurant operators was extremely challenging with soaring utility and raw materials costs, exacerbated by the worsening labor shortage. By formats, the recovery of Izakaya (Japanese pubs) was delayed due to the -9.7% YoY decline in the number of stores (-33.6% versus 2019).
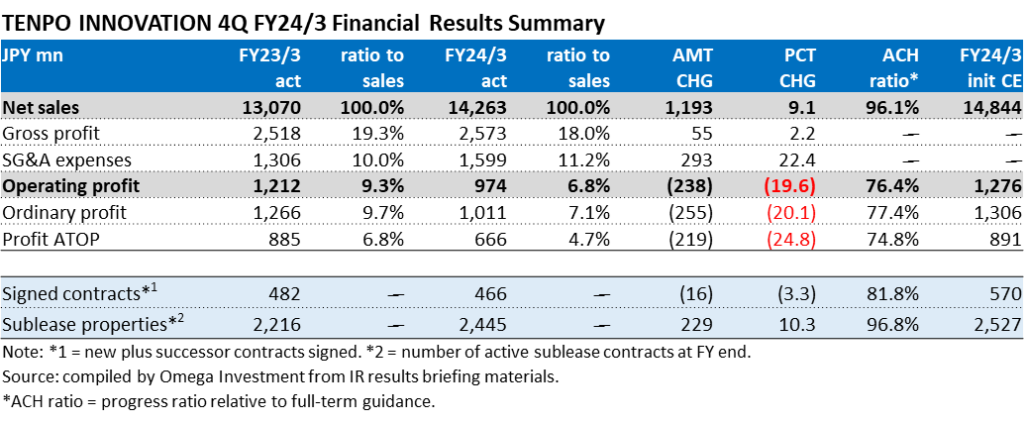
Against this backdrop, TENPO INNOVATION still achieved net sales growth of +9.1% YoY, driven by the +10.3% increase in active store sublease properties to 2,445. While the number of signed contracts (new + successor contracts) dipped slightly by -3.3% YoY, in part due to the reorganization of sales in Oct-2023 (see P2), the quarterly average of 116.5 contracts was still a high level. Ultimately, the strength of the business model of adhering to strict proven criteria when selecting store properties for subleasing ALWAYS results in being able to find demand in an industry known for constant turnover.
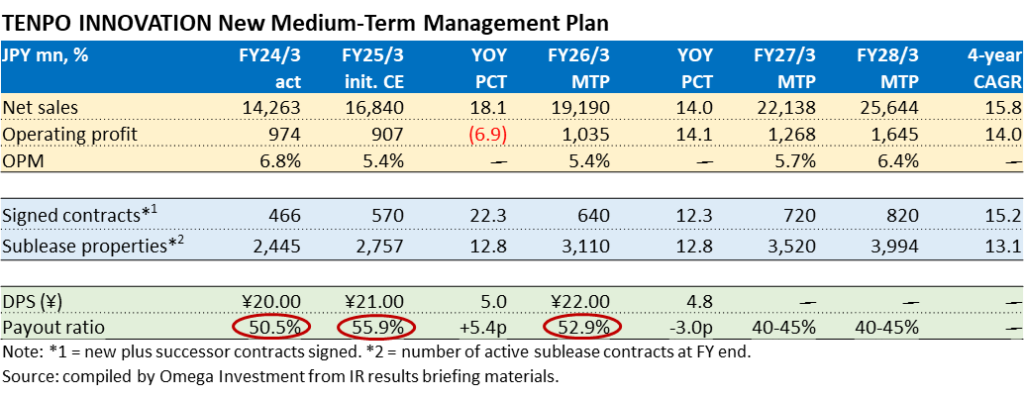
Despite the increase in net sales, GPM declined 1.3pp as costs increased due to aggressive purchasing of subleasing properties (vacancy rents, construction, commissions, etc.) and the disappearance of the sale of several large and highly profitable properties in the real estate trading business in the previous fiscal year. OP declined -19.6% YoY mainly due to a higher ratio of SG&A to sales from increased salary and recruiting expenses, executive compensation linked to the previous year’s strong performance, and DX system investments such as the move to electronic contracts, etc. Initial forecasts for FY25/3 are shown below. Net sales are forecast to increase +18.1% YoY (16th consecutive YoY gain), mainly driven by the resumption of double-digit growth in signed contracts following the reorganization of sales last term, and forecast +12.8% YoY increase in active store subleases. However OP is forecast to decline -6.9% YoY, a second consecutive YoY decline*, due to the impact of higher SG&A expenses accompanying the increase in headcount for aggressive expansion of each business under the new holdings company structure to take effect from October 1, 2024. As year one of the new MTP, FY25/3 is positioned as a transition phase toward accelerating growth going forward, and while profits will remain under pressure from upfront investments to strengthen the sales organization, the growth opportunity going forward is substantial.
From FY24/3, the Company announced a change to its dividend policy, effectively raising the target payout ratio from the 30% level to the 40% level. As can be seen from the left-hand graph, along with making proactive upfront investments to capture the significant growth opportunity, over the last 7 fiscal years since listing in Oct-2017 through FY24/3, total cash dividends have grown at +31.5% CAGR, with DOE topping 10% in FY24/3, and the payout ratio forecast to exceed 50% for the second consecutive year in FY25/3* (see table below).
Earnings Reference (pp5-8)
●4Q FY24/3
●2Q FY24/3
●4Q FY23/3

*Note: the full-term forecast for FY25/3 OP was subsequently revised up by +35% to a record JPY 1,228mn, +26.1% YoY, on 2024.11.13 along with strong 1H results, as described on P4. As a result, the initial expected payout ratio shown below declines to 42.3%.


1H FY24/3 consolidated net sales +16.3% and OP -5.3%
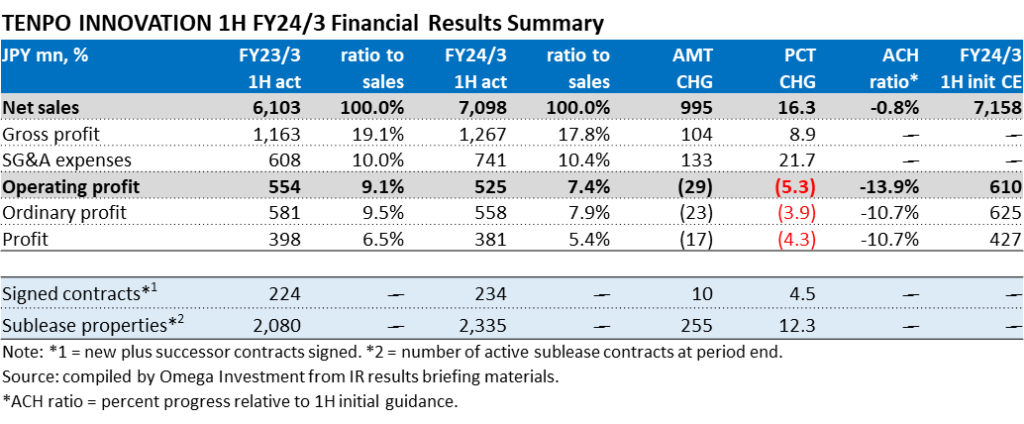
In the restaurant industry, sales and the number of customers increased due to the first summer holidays since the downgrade of COVID-19 to “category 5,” an increase in demand for eating out due to the extremely hot summer, and a recovery in inbound sales supported by the weak yen. For drinking establishments, the number of customers during late hours and the demand for large banquets gradually returned, but overall recovery was delayed due to the decrease in the number of establishments. Store subleasing sales increased +12.2% (sublease properties rose to 2,335, +12.3%). Although the number of contracts signed remained at a high level of 115 (2Q), the pace is expected to slow slightly in the near term due to reorganization of the sales organization. Store subleasing OP declined -17.3% due to GPM declining 1.3pp on the increase in costs (vacancy rent, construction, commissions, etc.) associated with aggressive sublease property purchases, while the ratio of SG&A to sales deteriorated 0.4pp on increased salary and recruiting expenses, executive compensation linked to the previous year’s strong performance, and DX system investments such as the move to electronic contracts, etc.
Real estate trading business sold 6 properties and acquired 6 as the wait-and-see trend in the market diminished with the normalization of economic and social activities (2Q-only 4 sold, 1 acquired), bringing total inventory to 6 as of the end of September. Net sales increased +39.1%, and OP increased +35.0%. Although the table below shows a slight shortfall to 1H profits, the key takeaway from 1H results is that margins were depressed due to aggressive procurement of new sublease stores and recruitment, which the Company expects to leverage in the 2H.
★1H hiring of sales staff achieved success
The biggest risk to achieving medium-term targets lies in successful execution of its sales force recruitment • training •assignment plan, particularly for sublease store property procurement. The number of procurement staff increased by 2 in 2Q, from 14 at the end of March to 16 at the end of September. The effect of the transfer of purchasing authority is expected to be realized from 2H into the next fiscal year.
The newly established “Sales Development Department” specializing in sales recruitment (headed by a sales executive) hired 15 new sales staff during the 1H.

FY23/3 consolidated net sales +14.5% and OP +33.2%
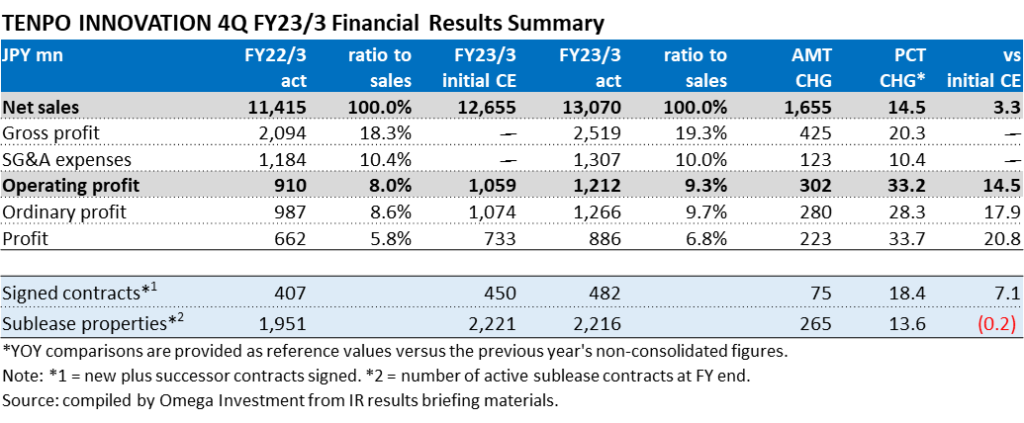
Since the Company began consolidating the accounts of newly established wholly-owned subsidiary Tenpo Safety Inc. from FY23/3, YoY figures are provided for reference versus non-consolidated results the previous term. Net sales increased +14.5% YoY, OP increased +33.2% YoY, GPM rose from 18.3% → 19.3%, and OPM rose from 8.0% → 9.3%. In addition to the contribution from new high-margin rent guarantee business, store subleasing business got a boost from the increase in new successor contracts from 135 → 197 (+45.9% YoY). Store subleasing sales increased +16.7% (sublease properties rose to 2,216, +13.6%), and store subleasing OP of ¥962mn increased +32.9%.
Real estate trading business got a boost from the sale of 5 properties which included several large-scale profitable properties (see graph below). In FY23/3, 5 properties were sold and 8 properties were acquired (Q4-only: 0 properties sold, 3 properties acquired), bringing the number of properties held by the Company to 6 at the end of FY23/3. Real estate trading sales declined -9.6%, however real estate trading OP of ¥251mn increased +34.7%. Although the primary objective of this business was to maintain a good relationship with RE brokers by paying meaningful commissions in return for good information on sublease candidates, the Company has recently also received interest from existing owner landlords to purchase properties, enhancing a stable supply pipeline without referrals, and this is now a full-fledged business.

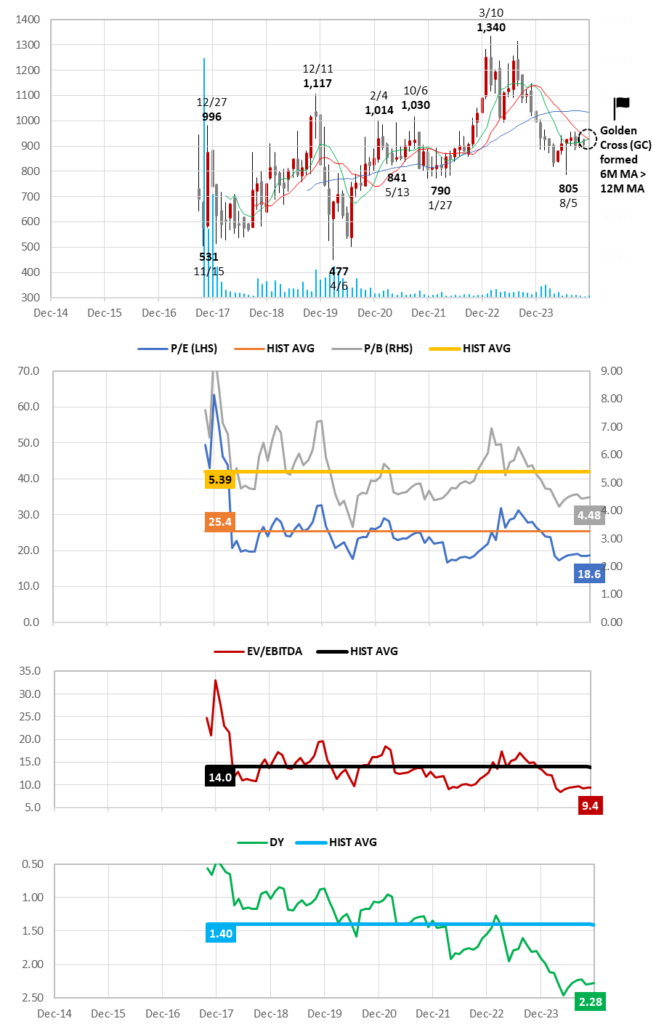
7-Year Monthly Share Price Chart, 6M/12M/24M MA, Volume and Valuation Trends
Source: compiled by Omega Investment from historical price data. Forecast values based on current Company estimates.
Key takeaways:
❶ The current P/E and P/B are trading on discounts of 27% and 17%, respectively, to their historical averages. EV/EBITDA is trading on an 33% discount. Importantly, DY is trading 63% above its historical average.
❷ The equity ratio on the surface may appear low at 24.4%, however this reflects the fact that the B/S is comprised of a large amount of deposits paid and received (see B/S on P12). The Company is debt-free, and the B/S is extremely healthy.
❸ Following the revised dividend policy from FY24/3 raising target payout effectively from the 30% level → to the 40% level, DOE topped 10% for FY24/3, and the payout ratio topped 50%.
10-Year Monthly Relative Share Price Performance and Trend of GPM/OPM
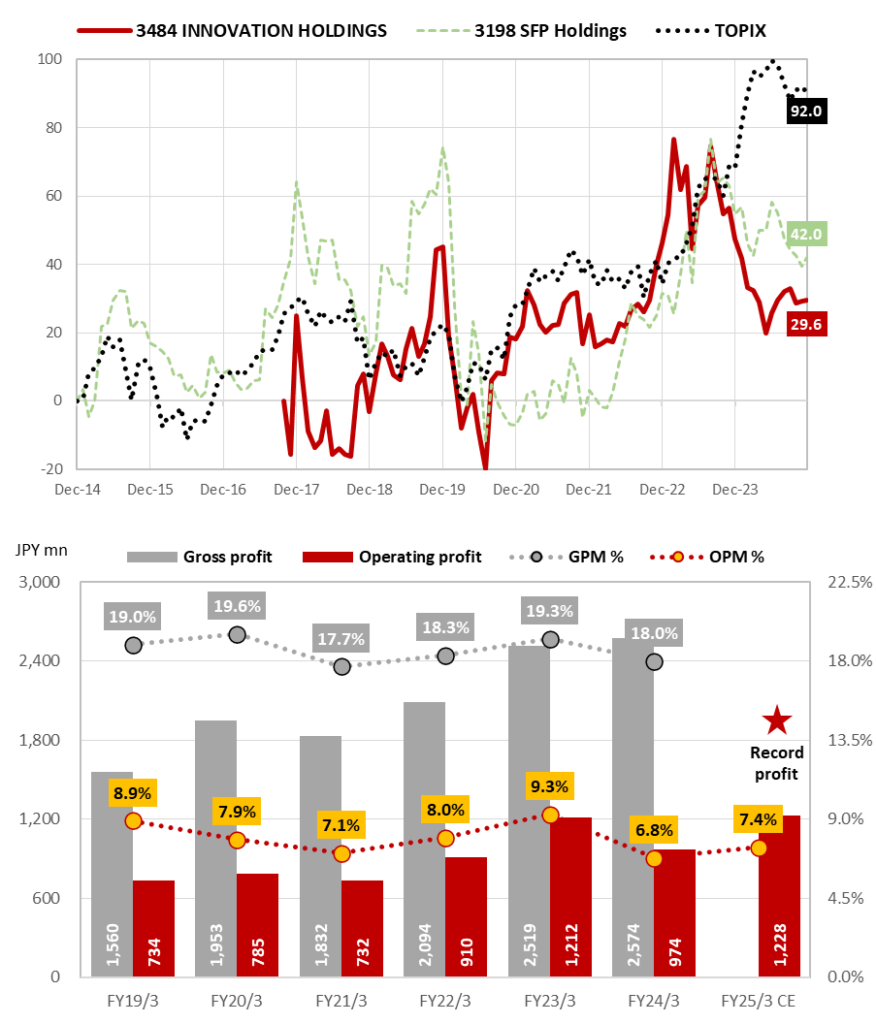
Sharp underperformance in FY24/3 can clearly be attributed to discounting margin deterioration in the short-term from leading upfront investments to capture the substantial growth opportunity going forward under the new holdings company structure.
Despite initial expectations for a second consecutive year of OP declining YoY, the current share price has yet to incorporate the revised outlook on the sharp improvement in GPM and control of SG&A absorbing increased personnel costs, now forecasting record profit. Omega Investment believes the disconnect between profit growth and current weak share price is unsustainable.
Consolidated Balance Sheets
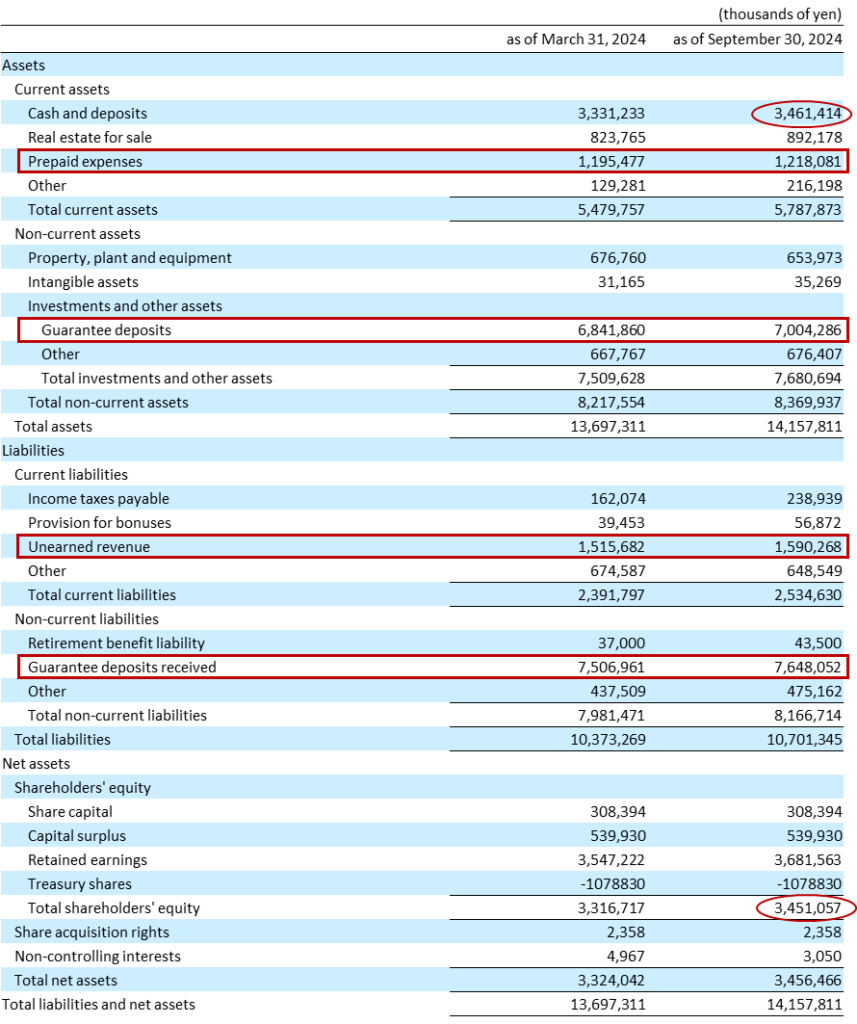
Source: excerpt from YUHO Semi-annual Securities Report.
Transition to a Holdings Company Structure
The Group decided to transition to a holding company structure in order to optimize the allocation of management resources, to promote the development of the next generation of management personnel, and to create a structure that will enable flexible decision-making and flexible responses to changes in business conditions in order to promote business expansion by focusing more on each of the Group’s businesses. By transitioning to a holding company structure, the holding company will oversee the management of the entire Group, while each subsidiary will focus on promoting its own business, thereby maximizing the corporate value of the Group.
The business divested was transferred to a wholly owned subsidiary (split preparation company) through a company split (absorption-type split) with the Company as the splitting company, and the split preparation company as the successor company. In addition, the Company will continue to be listed as a holding company on the TSE Prime market. The 18th Annual General Meeting of Shareholders held on June 17, 2024 approved the absorption-type split agreement and partial amendment to the Articles of Incorporation to change the trade name to Innovation Holdings CO.,LTD. (effective date of the absorption-type split: October 1, 2024). Details of the new holding company structure, new trade names/corporate logos, etc., are outlined in the exhibit below.
Schedule of the company split
1)Board of Directors’ meeting resolved to approve the establishment of the successor split preparation company: February 2, 2024
2)Establishment of the successor split preparation company, Tenpo Innovation Split Preparation Company: February 9, 2024
3)Board of Directors’ meeting resolved to approve the transition to a holding company structure: May 17, 2024
4)Board of Directors’ meeting resolved to approve the absorption-type split agreement: May 17, 2024
5)Conclusion of absorption-type split agreement: May 17, 2024
6)General Meeting of Shareholders approved the absorption-type split agreement and partial amendment to the Articles of Incorporation to change the trade name to Innovation Holdings CO.,LTD.: June 17, 2024
7)Effective date of the absorption-type split: October 1, 2024
New Group Holdings Company Structure from October 1, 2024

Source: compiled by Omega Investment from IR results briefing materials and related press releases regarding the transition to a holdings company structure.
FY25/3 Business expansion initiatives under the new holdings company structure
Numerical targets for the new Medium-term Management Plan under the new holdings company structure are shown in in the table on P2. During the first year of the new MTP in FY25/3, while net sales are forecast to increase, operating profit was initially forecast to decline another -6.9% YoY due to the impact of higher SG&A expenses accompanying the increase in headcount for aggressive expansion of each business. However, the sharp improvement in GPM from 17.8% → 18.6% and control of SG&A absorbing increased personnel costs resulted in 1H consolidated OP rising +30.1% YoY, beating the initial forecast by 57%, and the Company accordingly revised up full-term forecasts, now forecasting record profit for year 1. The effect of sales reorganization is expected to emerge going forward.
Tenpo Innovation CO., LTD. – Store subleasing business
Vision: Change business practices in the subleasing industry and create a new standard for store properties
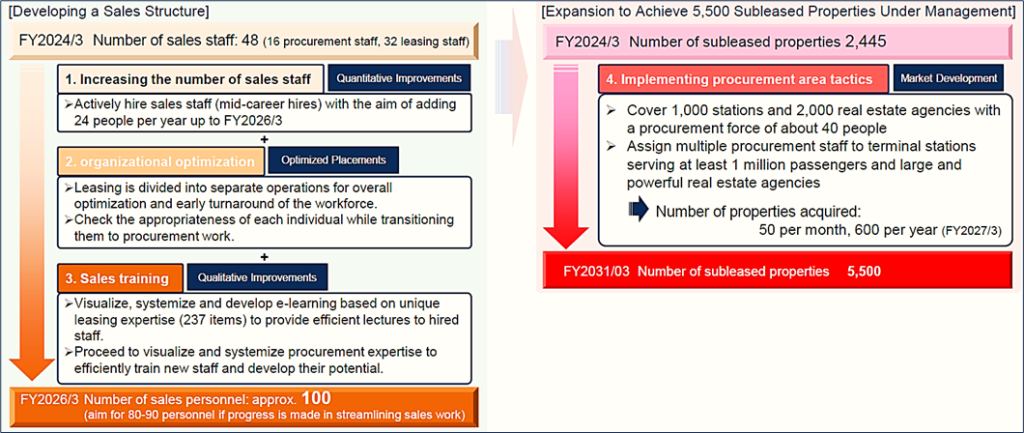
① Sales
- Measures to expand purchasing opportunities (Property Development Department) and division of labor and specialization of leasing operations (Sales Department)
- Along with increasing procurement, establish procurement channels centered on web-based purchasing and implement measures to build relationships with leading suppliers
- Shift from traditional all-in-one leasing to a division of labor by business, pursuing total optimization and specialization
② Training
- Training system to quickly turn inexperienced sales representatives into an effective force
- Efficient education through active use of e-learning tools such as videos
- Establish and disseminate mission, vision, and values for each department, and organize and manualize procurement know-how
③ Recruitment
- Continue to actively recruit based on the previous year’s results (23 sales hires)
- Established the “Recruitment Promotion Department” to succeed the Sales Development Department of the previous fiscal year, and plans to actively recruit property management staff in addition to sales staff
- Aiming to maximize the number of applicants, while increasing efficiency and reducing costs
④ In-house websites
- Improve the appeal and presence of our websites “INUKITENPO.com” (finding tenants for vacated-furnished stores) and “TENPOKAITORI.com” (purchase of vacated equipment)
- Expand the range of properties handled by “INUKITENPO.com” and improve convenience by using search engine optimization (SEO) measures and use of LINE, etc.; expand the range of properties handled by “TENPOKAITORI.com” and increase awareness through advertising, begin operations by a specialized team
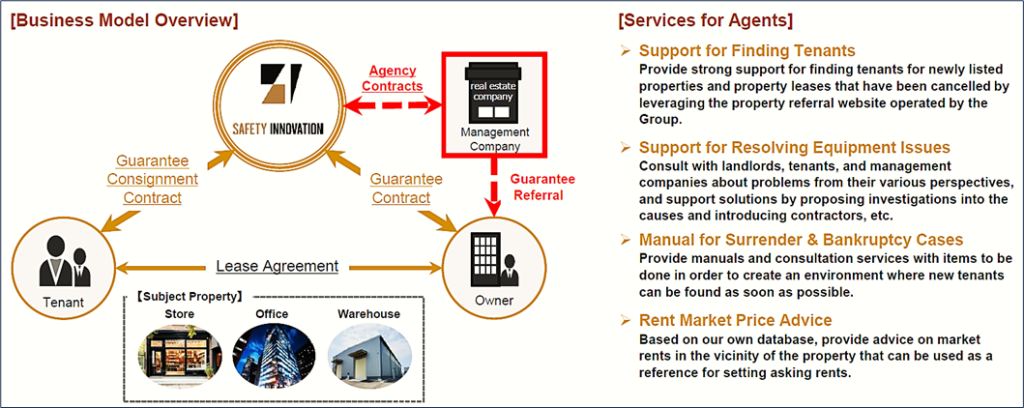
Safety Innovation CO., LTD. – Rent guarantee business
Vision: Become No. 1 in the rent guarantee industry in terms of the number of commercial real estate rent guarantee contracts
① Startup preparations
- Initially, place priority on approaching Group business partners, with full-scale recruiting activities beginning in the second half of the fiscal year
- Conduct sales activities to real estate companies (on the scale of 1,000 companies) that deal with subleasing business to increase awareness in the Tokyo metropolitan area
- Full-scale recruiting activities are scheduled to begin in the 2H of the current fiscal year (planning to hire approximately 15 employees), and planning to establish a branch in the Tokyo metropolitan area
② Business flow
- Proactively utilize IT while improving workflow and manuals, and establish a training / education system
- Proactive use of cloud services and OCR to develop workflows and manuals for making contracts, screening, and collection
- Improve convenience and reduce the burden on clients, while improving operational efficiency and training systems
Actively acquire projects outside the Group through rent guarantees specializing in commercial real estate properties. Expand business through synergies by leveraging store property know-how and providing added value to agents.
Asset Innovation CO., LTD. – Real estate trading business
Vision: Become a leading company in commercial real estate distribution
① Developing customers
- Taking the opportunity of the company’s establishment, strengthen organizational and sales capabilities, and actively collect information and cultivate customers
- Strengthen sales and marketing for purchasing to Yamanote Line and surrounding stations (plan to add 2 sales staff this fiscal year) and develop sales channels other than RE agents
- Strengthen purchasing capabilities through direct mailings to RE agents and property owners
② Training and collaboration
- Start compiling know-how and creating manuals, and hold study sessions for Group cooperation
- Through organizing know-how and creating manuals, aim to increase human resource short-term competitiveness
- Hold study sessions for Group companies twice a year to share information on purchases and sales
