2026-07-27
Home
Japanese

Omega Investment Co., Ltd.
Itoki (Company note – 4Q update)

| Share price (3/5) | ¥1,625 | Dividend Yield (25/12 CE) | 4.00 % |
| 52weeks high/low | ¥1,062/1,933 | ROE(24/12 act) | 13.79 % |
| Avg Vol (3 month) | 214 thou shrs | Operating margin (24/12 act) | 7.3 % |
| Market Cap | ¥86.7 bn | Beta (5Y Monthly) | 0.41 |
| Enterprise Value | ¥95.3 bn | Shares Outstanding | 53.38 mn shrs |
| PER (25/12 CE) | 9.99 X | Listed market | TSE Prime |
| PBR (24/12 act) | 1.62 X |
| Click here for the PDF version of this page |
| PDF Version |
Full-Year Earnings Registered Record Highs: Rising Expectations for Achieving the Medium-Term Management Plan Through Further Revenue and Profit Growth
◇ FY12/2024 full-year financial highlights: Record-high revenue and operating profit
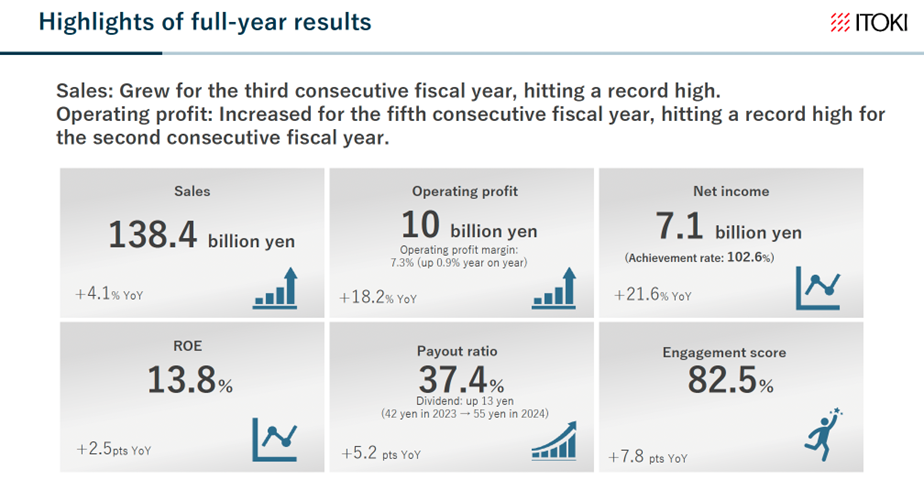
On February 13, 2025, Itoki announced its full-year earnings results for FY2024, with revenue, operating profit, ordinary profit, and net income attributable to owner of parent all reaching record highs. Revenue was 138.46 billion yen (+4% YoY), operating profit was 10.07 billion yen (+18% YoY), ordinary profit was 10.00 billion yen (+16% YoY), and net income attributable to owner of parent was 7.18 billion yen (+21% YoY), achieving the company’s earnings forecast. Revenue increased for the third consecutive year, and operating profit for the fifth consecutive year, with ROE at 13.8% (+2.5pt YoY), and an employee engagement score of 82.5% (+7.8pt YoY).
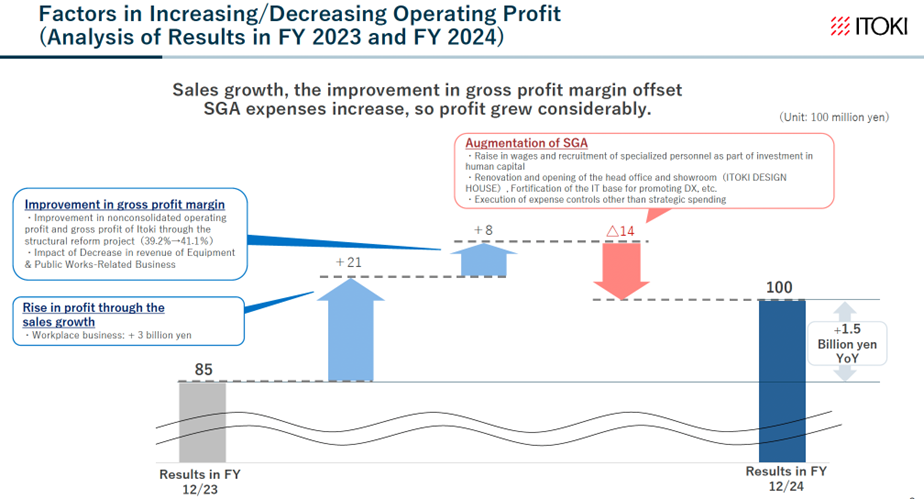
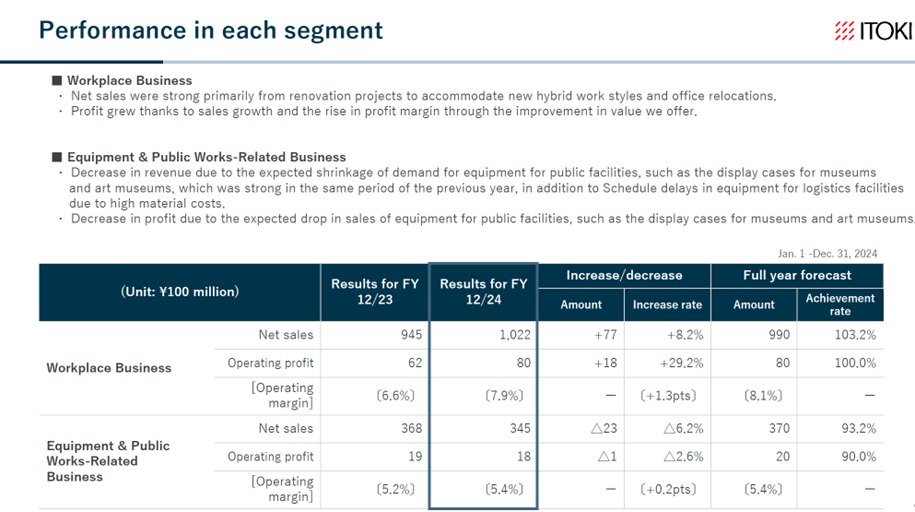
The primary growth driver was the Workplace Business. Amid rising demand for office space renewals as a pillar of investment in human capital by customers (such as recruitment, retention, and productivity improvement), Itoki expanded its comprehensive business strategy beyond the Tokyo metropolitan area by providing integrated services, including design, specification, and construction. As a result, profitability improved not only through product price revisions but also through multifaceted cost optimizations.
On the other hand, the Equipment & Public Works-Related Business saw a slight decline in revenue and operating profit. While demand for research facilities remained strong, public facility equipment revenue declined as expected. Additionally, due to rising material costs and labor shortages, the construction of logistics facilities was delayed, impacting the timing of revenue recognition. However, profitability was maintained, and the overall proportion of this segment in total earnings remained small.
Furthermore, investments were made in personnel expenses, DX promotion costs, and the showroom/head office renovation, resulting in a well-balanced earnings outcome rather than an excessive focus on profitability.
Orders for the Office 3.0 area that manages office space data to monitor and propose productivity improvements, reached 60 cases, significantly exceeding the target of 40 cases.
While operating cash flow turned negative at JPY -1.0 billion, this was mainly due to a temporary increase in payments following the abolition of promissory notes.
Additionally, in November 2024, the Japan Fair Trade Commission warned about potential violations of the Antimonopoly Act concerning payments to logistics contractors. However, financial adjustments for past transactions have been completed, and the major payments have already been settled. The company has also made progress in ensuring transaction fairness and compliance, reducing concerns related to this issue.
◇ Further strengthening of corporate structure
In addition to compliance improvements, four key topics were highlighted in the latest earnings announcement: 1.Credit rating acquisition: In January 2025, Itoki obtained a new issuer rating of “A- (Stable)” from the Rating and Investment Information, Inc. (R&I). This paves the way for flexible debt financing beyond bank reliance. 2.Abolition of anti-takeover measures: This move demonstrates management’s confidence while ensuring that potential acquirers who can enhance corporate value are not unnecessarily obstructed. This will attract more investors interested in holding the company’s stock. 3.SCM system implementation: The new SCM system is scheduled to go live in June 2025, seven months later than initially planned. Once operational, it is expected to significantly enhance overall labor productivity. 4.Board governance enhancement: The company plans to increase the number of external directors, with formal approval expected at the 75th Annual General Meeting of Shareholders on March 26, 2025. As a result, the board composition will shift from 5 internal and 3 external directors to an equal balance of 4 internal and 4 external directors. The two new external directors are expected to contribute to capital cost management, compliance reinforcement, and human resource development. Furthermore, Itoki promotes appointing external executive officers and younger leadership, indicating strong momentum for corporate transformation.
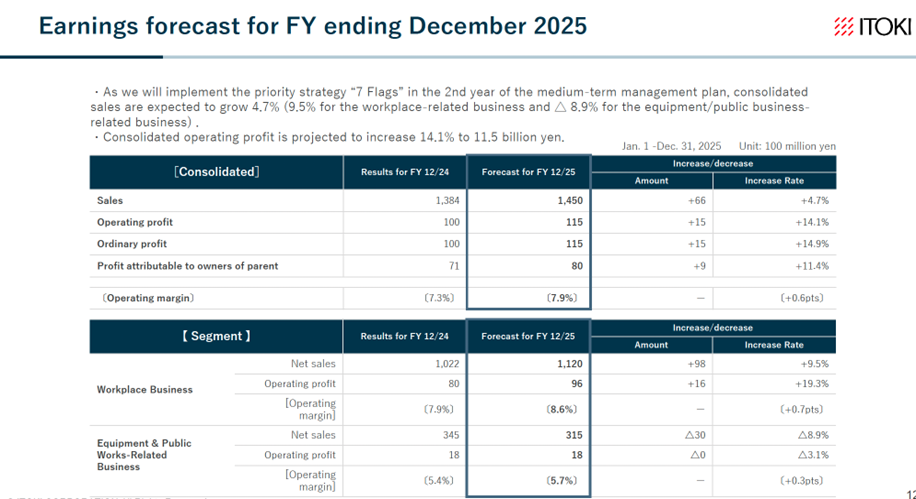
◇ FY12/2025 Full-Year earnings forecast: Continued revenue and profit growth expected
The company has announced its FY12/2025 earnings forecast, targeting revenue of 145.0 billion yen (+4% YoY), operating profit of 11.5 billion yen (+14% YoY), ordinary profit of 11.5 billion yen (+14% YoY), and net income attributable to owner of parent of 8.0 billion yen (+11% YoY), aiming for consecutive record-high earnings.
The Workplace Business is expected to continue driving growth, supported by a favorable business environment and the company’s optimal strategies, as we have seen. Based on the current sales pipeline, the earnings forecast appears reasonable.
Additionally, the annual dividend per share is expected to increase by 10 yen to 65 yen, with a projected payout ratio of 40%.
◇ Share price trends and future points of interest
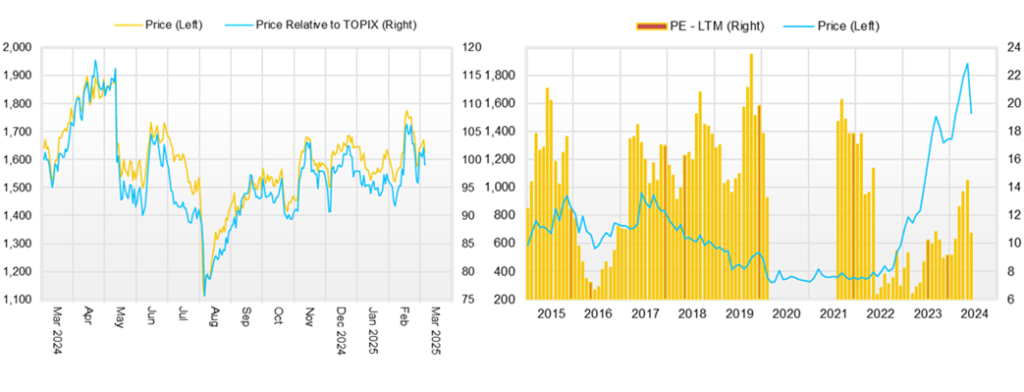
Since 2022, Itoki’s stock price has risen significantly until April 2024. However, it has since stabilized in the 1,500–1,600 yen range, which is in line with earnings progress.
Following the latest full-year earnings announcement, the stock price briefly rose to 1,812 yen, suggesting a potential new upward phase, but it is currently hovering around 1,650 yen.
This stock movement reflects the continued revenue and profit growth and improving ROE, which support the stock price. However, the profit growth has slowed compared to previous years, making it harder to identify the next catalyst for a stock price rise.
For the stock to resume a steady upward trend, several factors will be crucial: 1.Progress in FY12/2025 earnings performance. 2.Higher confidence in revenue and profit growth for FY12/2026, the final year of the medium-term management plan, particularly with expectations of a 2.5 billion yen operating profit increase driven by operational efficiency improvements. 3.The emergence of new growth drivers beyond the current medium-term management plan, including the Office 3.0 area, the specialized facilities area, and overseas expansion. 4.Strengthened recurring revenue and stable earnings growth. 5.A long-term outlook on financial targets and the company’s M&A strategy remains a key investor interest.
As with last year, these key points may be addressed if an IR Day is held around mid-year. Investors should closely monitor earnings progress and management’s responses to these factors.
Company profile
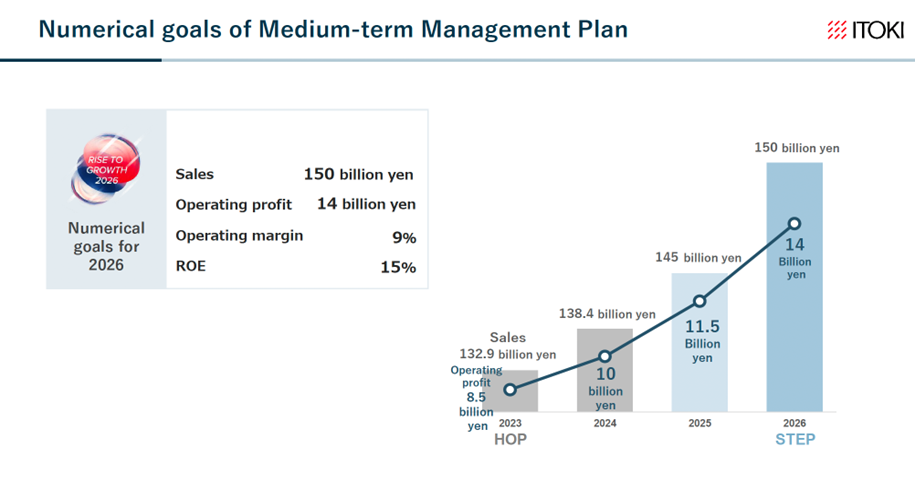
Itoki Corporation (Itoki) is an office furniture manufacturer that designs tomorrow’s “workstyles”. It was founded in 1890. In addition to office furniture manufacturing, the company is also involved in construction and interior decoration. In 2022, Koji Minato was appointed president, and the company’s corporate structure has been transformed under his leadership. The company has advocated Office DX and Office 3.0 and is working to add high value. Under its three-year medium-term management plan, RISE TO GROWTH 2026, which ends in FY2026, the company is promoting the priority strategy ‘7 Flags’ and ESG strategies under the theme of ‘enhancing sustainable growth’. The plan aims to achieve sales of 150 billion yen, operating profit of 14 billion yen and ROE of 15% in FY2026.
Key financial data
| Unit: million yen | 2020/12 | 2021/12 | 2022/12 | 2023/12 | 2024/12 | 2025/12 CE |
| Sales | 116,210 | 115,905 | 123,324 | 132,985 | 138,460 | 145,000 |
| EBIT (Operating Income) | 1,585 | 2,561 | 4,582 | 8,524 | 10,078 | 11,500 |
| Pretax Income | 1,277 | 1,523 | 8,372 | 8,378 | 10,071 | 11,500 |
| Net Profit Attributable to Owner of Parent | -235 | 1,166 | 5,294 | 5,905 | 7,183 | 8,000 |
| Cash & Short-Term Investments | 18,246 | 17,451 | 26,976 | 24,795 | 22,482 | |
| Total assets | 105,096 | 103,898 | 115,288 | 117,437 | 120,521 | |
| Total Debt | 17,308 | 17,308 | 17,308 | 17,308 | 37,533 | |
| Net Debt | -7,487 | -7,487 | -7,487 | -7,487 | 15,051 | |
| Total liabilities | 60,901 | 58,818 | 65,374 | 62,434 | 71,174 | |
| Total Shareholders’ Equity | 54,960 | 54,960 | 54,960 | 54,960 | 49,260 | |
| Net Operating Cash Flow | 4,561 | 2,774 | 5,804 | 6,321 | -1,000 | |
| Capital Expenditure | 3,316 | 3,316 | 3,316 | 3,316 | 6,036 | |
| Net Investing Cash Flow | -1,152 | -1,170 | 4,923 | -4,012 | -7,107 | |
| Net Financing Cash Flow | -2,267 | -2,658 | -1,426 | -4,148 | 5,905 | |
| Free Cash Flow | 3,005 | 3,005 | 3,005 | 3,005 | -4,146 | |
| ROA (%) | -0.22 | 1.12 | 4.83 | 5.08 | 6.04 | |
| ROE (%) | -0.53 | 2.63 | 11.17 | 11.27 | 13.79 | |
| EPS (Yen) | -5.2 | 25.8 | 117.0 | 130.3 | 147.0 | 162.6 |
| BPS (Yen) | 970.4 | 993.9 | 1,101.3 | 1,212.0 | 1,001.1 | |
| Dividend per Share (Yen) | 13.00 | 15.00 | 37.00 | 42.00 | 55.00 | 65.00 |
| Shares Outstanding (Milion shrs) | 45.66 | 45.66 | 45.66 | 45.66 | 53.38 |
Source: Omega Investment from company data, rounded to the nearest whole number.
Share price
Quarterly topics
【Highlights of full-year results】
Source: Company materials
【Analysis of changes in operating profits】
Source: Company materials
【Performance in each segment】
Source: Company materials
【Earnings forecast for FY ending December 2025】
Source: Company materials
【Earnings forecast for FY2025 in the Medium-term Management Plan 】
Source: Company material
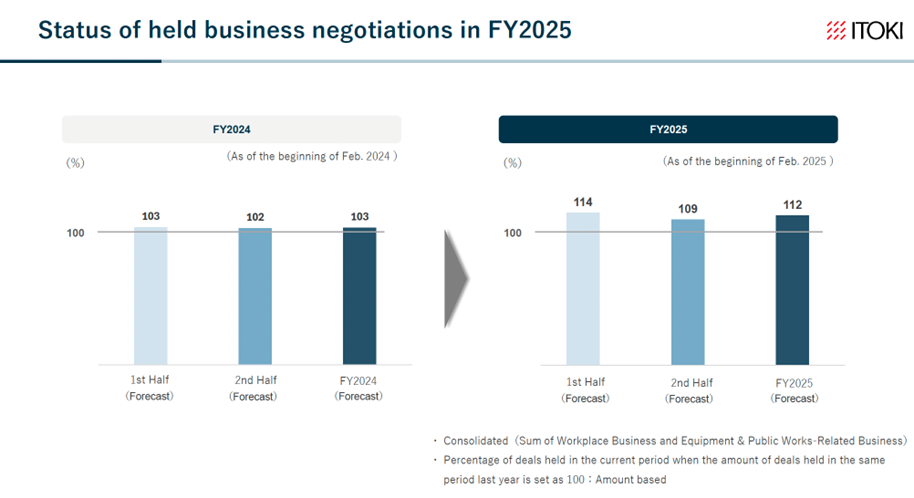
【Status of held business negotiations in FY2025】
Source: Company material
Financial data (quarterly basis)
| Unit: million yen | 2022/12 | 2023/12 | 2024/12 | ||||||
| 4Q | 1Q | 2Q | 3Q | 4Q | 1Q | 2Q | 3Q | 4Q | |
| (Income Statement) | |||||||||
| Sales | 33,363 | 36,965 | 31,225 | 28,667 | 36,128 | 40,918 | 31,592 | 29,613 | 36,337 |
| Year-on-year | 4.7% | 4.6% | 9.9% | 9.4% | 8.3% | 10.7% | 1.2% | 3.3% | 0.6% |
| Cost of Goods Sold (COGS) | 21,384 | 22,216 | 18,955 | 17,483 | 22,090 | 24,545 | 19,888 | 17,644 | 21,182 |
| Gross Income | 11,979 | 14,749 | 12,270 | 11,184 | 14,038 | 16,373 | 11,704 | 11,969 | 15,155 |
| Gross Income Margin | 35.9% | 39.9% | 39.3% | 39.0% | 38.9% | 40.0% | 37.0% | 40.4% | 41.7% |
| SG&A Expense | 11,484 | 9,970 | 10,047 | 11,006 | 12,694 | 10,333 | 10,878 | 11,029 | 12,883 |
| EBIT (Operating Income) | 495 | 4,779 | 2,223 | 178 | 1,344 | 6,040 | 826 | 940 | 2,279 |
| Year-on-year | -40.3% | 20.5% | 444.9% | -162.2% | 171.5% | 26.4% | -62.8% | 428.1% | 69.6% |
| Operating Income Margin | 1.5% | 12.9% | 7.1% | 0.6% | 3.7% | 14.8% | 2.6% | 3.2% | 6.3% |
| EBITDA | 1,342 | 5,522 | 2,906 | 910 | 2,079 | 6,753 | 1,582 | 1,684 | 3,173 |
| Pretax Income | 3,351 | 4,804 | 2,275 | 363 | 936 | 6,006 | 1,328 | 1,035 | 1,702 |
| Consolidated Net Income | 1,767 | 3,297 | 1,411 | 202 | 997 | 4,104 | 985 | 725 | 1,409 |
| Minority Interest | -10 | 1 | 0 | 0 | 0 | 2 | 1 | 11 | 25 |
| Net Income ATOP | 1,777 | 3,296 | 1,411 | 202 | 996 | 4,101 | 985 | 714 | 1,383 |
| Year-on-year | 462.3% | -2.7% | 389.9% | -227.0% | -44.0% | 24.4% | -30.2% | 253.5% | 38.9% |
| Net Income Margin | 5.3% | 8.9% | 4.5% | 0.7% | 2.8% | 10.0% | 3.1% | 2.4% | 3.8% |
| (Balance Sheet) | |||||||||
| Cash & Short-Term Investments | 26,976 | 20,908 | 24,788 | 23,292 | 24,795 | 24,751 | 28,513 | 30,536 | 22,482 |
| Total assets | 115,288 | 115,841 | 111,693 | 111,573 | 117,437 | 127,459 | 120,701 | 120,935 | 120,521 |
| Total Debt | 19,487 | 18,387 | 17,361 | 17,342 | 17,308 | 38,662 | 41,566 | 42,881 | 37,533 |
| Net Debt | -7,489 | -2,521 | -7,427 | -5,950 | -7,487 | 13,911 | 13,053 | 12,345 | 15,051 |
| Total liabilities | 65,374 | 64,090 | 58,270 | 57,730 | 62,434 | 81,595 | 73,584 | 73,305 | 71,174 |
| Total Shareholders’ Equity | 49,871 | 51,709 | 53,379 | 53,800 | 54,960 | 45,818 | 47,068 | 47,571 | 49,260 |
| (Profitability %) | |||||||||
| ROA | 4.83 | 4.49 | 5.67 | 6.09 | 5.08 | 5.52 | 5.41 | 5.85 | 6.04 |
| ROE | 11.17 | 10.45 | 12.45 | 13.12 | 11.27 | 13.76 | 12.51 | 13.41 | 13.79 |
| (Per-share) Unit: JPY | |||||||||
| EPS | 39.2 | 72.8 | 31.1 | 4.5 | 22.0 | 85.7 | 19.1 | 14.5 | 28.0 |
| BPS | 1,101.3 | 1,141.9 | 1,177.1 | 1,186.4 | 1,212.0 | 933.1 | 956.6 | 966.8 | 1,001.1 |
| Dividend per Share | 37.00 | 37.00 | 37.00 | 37.00 | 42.00 | 42.00 | 42.00 | 0.00 | 55.00 |
| Shares Outstanding(milion shrs) | 45.66 | 45.66 | 45.66 | 45.66 | 45.66 | 53.38 | 53.38 | 53.38 | 53.38 |
Source: Omega Investment from company materials
Financial data (full-year basis)
| Unit: million yen | 2014/12 | 2015/12 | 2016/12 | 2017/12 | 2018/12 | 2019/12 | 2020/12 | 2021/12 | 2022/12 | 2023/12 | 2024/12 |
| (Income Statement) | |||||||||||
| Sales | 102,993 | 106,516 | 101,684 | 108,684 | 118,700 | 122,174 | 116,210 | 115,905 | 123,324 | 132,985 | 138,460 |
| Year-on-year | -0.5% | 3.4% | -4.5% | 6.9% | 9.2% | 2.9% | -4.9% | -0.3% | 6.4% | 7.8% | 4.1% |
| Cost of Goods Sold | 66,858 | 68,424 | 65,071 | 70,012 | 77,479 | 80,712 | 74,536 | 74,186 | 77,575 | 80,744 | 83,259 |
| Gross Income | 36,135 | 38,092 | 36,613 | 38,672 | 41,221 | 41,462 | 41,674 | 41,719 | 45,749 | 52,241 | 55,201 |
| Gross Income Margin | 35.1% | 35.8% | 36.0% | 35.6% | 34.7% | 33.9% | 35.9% | 36.0% | 37.1% | 39.3% | 39.9% |
| SG&A Expense | 33,711 | 33,949 | 33,862 | 35,761 | 39,336 | 40,776 | 40,089 | 39,158 | 41,167 | 43,717 | 45,123 |
| EBIT (Operating Income) | 2,424 | 4,143 | 2,751 | 2,911 | 1,885 | 686 | 1,585 | 2,561 | 4,582 | 8,524 | 10,078 |
| Year-on-year | -40.5% | 70.9% | -33.6% | 5.8% | -35.2% | -63.6% | 131.0% | 61.6% | 78.9% | 86.0% | 18.2% |
| Operating Income Margin | 2.4% | 3.9% | 2.7% | 2.7% | 1.6% | 0.6% | 1.4% | 2.2% | 3.7% | 6.4% | 7.3% |
| EBITDA | 5,055 | 6,551 | 5,316 | 5,551 | 4,615 | 4,436 | 5,603 | 6,148 | 7,821 | 11,417 | 13,185 |
| Pretax Income | 3,171 | 4,246 | 2,918 | 3,401 | 3,083 | 938 | 1,277 | 1,523 | 8,372 | 8,378 | 10,071 |
| Consolidated Net Income | 2,355 | 4,631 | 1,850 | 2,442 | 1,744 | -579 | -355 | 933 | 5,181 | 5,907 | 7,223 |
| Minority Interest | 195 | 101 | -56 | 40 | 19 | -28 | -119 | -233 | -113 | 1 | 39 |
| Net Income ATOP | 2,160 | 4,530 | 1,907 | 2,402 | 1,725 | -550 | -235 | 1,166 | 5,294 | 5,905 | 7,183 |
| Year-on-year | -44.8% | 109.7% | -57.9% | 26.0% | -28.2% | -131.9% | -57.3% | -596.2% | 354.0% | 11.5% | 21.6% |
| Net Income Margin | 2.1% | 4.3% | 1.9% | 2.2% | 1.5% | -0.5% | -0.2% | 1.0% | 4.3% | 4.4% | 5.2% |
| (Balance Sheet) | |||||||||||
| Cash & Short-Term Investments | 22,132 | 21,533 | 19,839 | 19,977 | 16,529 | 17,030 | 18,246 | 17,451 | 26,976 | 24,795 | 22,482 |
| Total assets | 96,721 | 98,175 | 95,681 | 102,451 | 108,710 | 108,778 | 105,096 | 103,898 | 115,288 | 117,437 | 120,521 |
| Total Debt | 18,916 | 18,927 | 19,931 | 17,892 | 16,834 | 22,166 | 21,742 | 20,091 | 19,487 | 17,308 | 37,533 |
| Net Debt | -3,216 | -2,606 | 92 | -2,085 | 305 | 5,136 | 3,496 | 2,640 | -7,489 | -7,487 | 15,051 |
| Total liabilities | 53,532 | 50,864 | 50,275 | 54,997 | 61,200 | 62,940 | 60,901 | 58,818 | 65,374 | 62,434 | 71,174 |
| Total Shareholders’ Equity | 41,632 | 45,677 | 44,949 | 46,863 | 46,857 | 45,370 | 43,812 | 44,931 | 49,871 | 54,960 | 49,260 |
| (Cash Flow) | |||||||||||
| Net Operating Cash Flow | 5,715 | 4,522 | 5,073 | 3,565 | 1,384 | 3,586 | 4,561 | 2,774 | 5,804 | 6,321 | -1,000 |
| Capital Expenditure | 1,400 | 1,114 | 1,641 | 1,333 | 3,477 | 3,226 | 1,729 | 2,110 | 4,145 | 3,316 | 6,036 |
| Net Investing Cash Flow | -1,742 | -803 | -4,044 | -2,971 | -3,094 | -3,221 | -1,152 | -1,170 | 4,923 | -4,012 | -7,107 |
| Net Financing Cash Flow | -2,179 | -3,807 | -2,571 | -706 | -2,463 | 0 | -2,267 | -2,658 | -1,426 | -4,148 | 5,905 |
| Free Cash Flow | 4,315 | 3,408 | 3,664 | 2,342 | -1,924 | 635 | 2,832 | 664 | 1,659 | 3,005 | -4,146 |
| (Profitability %) | |||||||||||
| ROA | 2.25 | 4.65 | 1.97 | 2.42 | 1.63 | -0.51 | -0.22 | 1.12 | 4.83 | 5.08 | 6.04 |
| ROE | 5.22 | 10.38 | 4.21 | 5.23 | 3.68 | -1.19 | -0.53 | 2.63 | 11.17 | 11.27 | 13.79 |
| (Per-share) Unit: JPY | |||||||||||
| EPS | 42.8 | 91.6 | 40.1 | 52.7 | 37.8 | -12.1 | -5.2 | 25.8 | 117.0 | 130.3 | 147.0 |
| BPS | 825.8 | 953.5 | 986.8 | 1,028.9 | 1,027.4 | 995.8 | 970.4 | 993.9 | 1,101.3 | 1,212.0 | 1,001.1 |
| Dividend per Share | 13.00 | 13.00 | 13.00 | 13.00 | 13.00 | 13.00 | 13.00 | 15.00 | 37.00 | 42.00 | 55.00 |
| Shares Outstanding (milion shrs) | 52.14 | 52.14 | 52.14 | 52.14 | 45.61 | 45.66 | 45.66 | 45.66 | 45.66 | 45.66 | 53.38 |
Source: Omega Investment from company materials