2026-07-09
Home
Japanese

Omega Investment Co., Ltd.
CNS (Company note – 3Q update)

9M FY25/5 results broadly in-line
Annual dividend hiked +53% to commemorate 40TH anniversary
| Click here for the PDF version of this page |
| PDF version |
SUMMARY
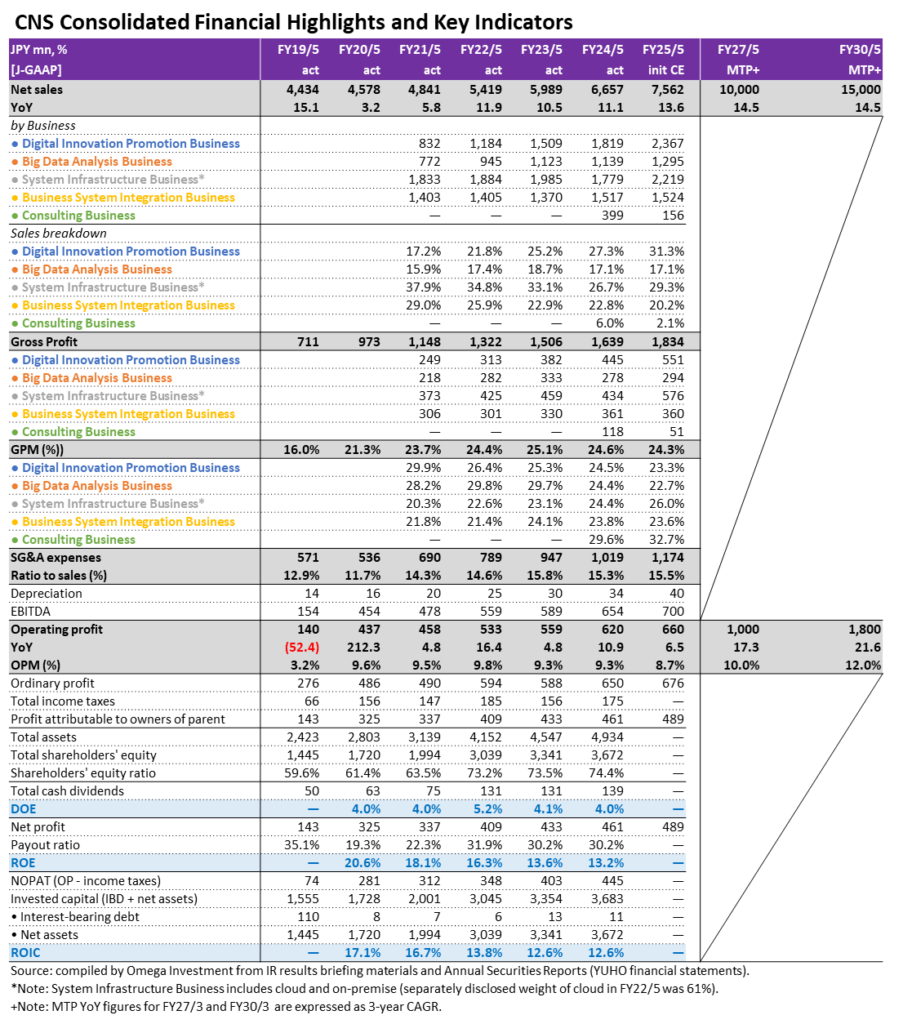
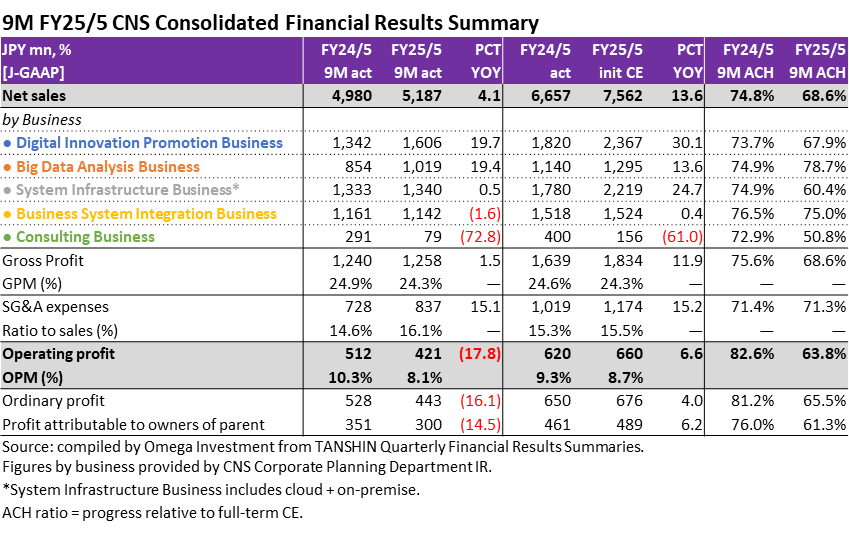
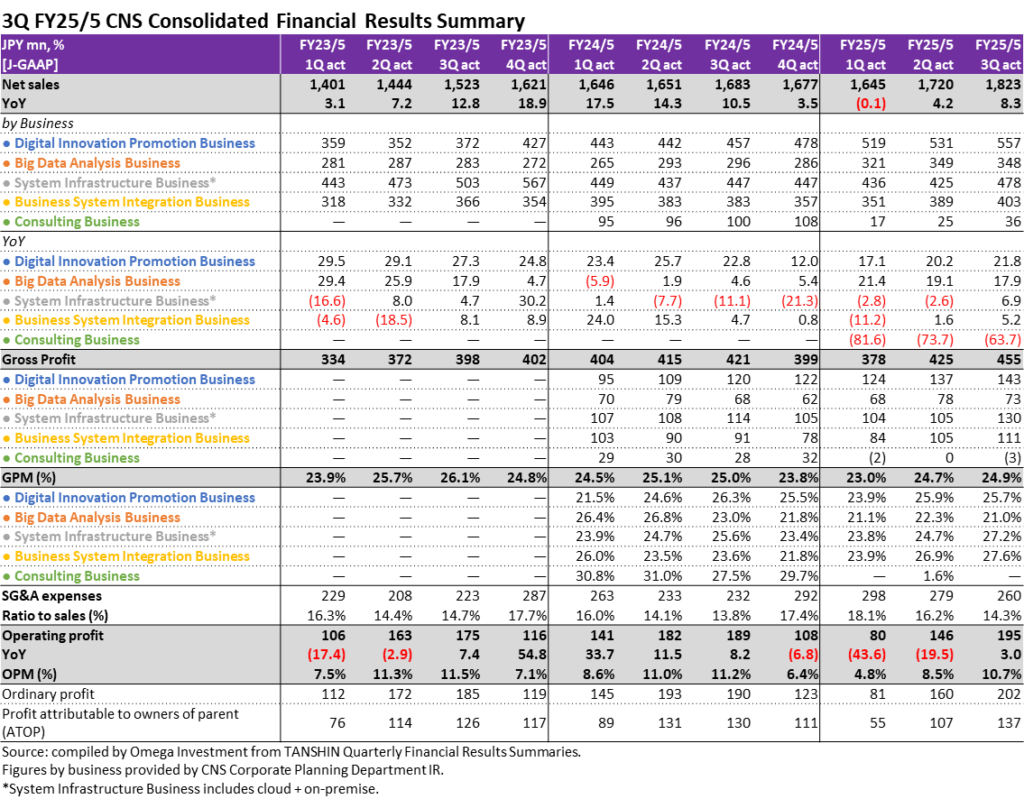
nCNS announced 9-months cumulative 3Q FY25/5 (Jun-Feb) results at 15:00 on April 11. Headline numbers were net sales +4.1% YoY, operating profit -17.9%, and profit attributable to owners of parent -14.5%. As we have noted in previous quarterly follow-up reports, while topline net sales continue to grow at double digits, profits this term have slowed mainly due to 1) the strategic increase in salaries aimed at securing and retaining the necessary professionals to capture the growth opportunity going forward, with the implementation of a planned 10.8% increase in base and regular salaries from the beginning of the FY, depressing 1Q GPM from the impact of wage increases and increased managerial staff, increased training and recruitment expenses, and increased compensation paid for back-office outsourcing expenses, and 2) the impact of restructuring the new Consulting business through downsizing with a view toward reconfiguration during the current FY. Therefore, the initial budget has profits weighted toward the 2H, and 9-months cumulative results are broadly in-line, despite progress ratios shown below appearing to be slightly behind. There is no change to FY forecasts. n The key takeaway from 3Q results is the sequential improvement from depressed 1Q results to the 2Q and 3Q shown in the big table on P2. Quarterly trends are as follows. Net sales YoY: 1Q -0.1% → 2Q +4.2% → 3Q +8.3%, GPM: 1Q 23.0% → 2Q 24.7%→3Q 24.9%, ratio of SG&A to net sales: 1Q 18.1% → 2Q 16.2% → 3Q 14.3%, OPM: 1Q 4.8% → 2Q 8.5% → 3Q 10.7%, and operating profit YoY: 1Q -43.6% → 2Q -19.5% → 3Q +3.0%. This is a clear and continuous recovery of profits underway.
Financial Indicators
| Share price (5/7) | 1,603 | 25.5 P/E (CE) | 9.5x |
| YH (25/5/1) | 1,629 | 25.5 EV/EBITDA (CE) | 1.9x |
| YL (25/4/10) | 1,294 | 24.5 ROE (act) | 13.2% |
| 10YH (21/8/20) | 3,035 | 24.5 ROIC (act) | 12.6% |
| 10YL (23/1/17) | 1,270 | 25.2 P/B (act) | 1.22x |
| Shrs out. (mn shrs) | 2.906 | 25.5 DY (CE) | 4.68% |
| Mkt cap (¥ bn) | 4.658 | | |
| EV (¥ bn) | 1.312 | | |
| Equity ratio (3/31) | 77.5% | | |
- Digital Innovation Promotion Business: In addition to the expansion of the scope of services for cashless payment service projects, where CNS was recognized for its track record, expansion of the structure for existing projects such as ServiceNow implementation support and generative AI-related projects, etc. supported high growth.
- Big Data Analysis Business: High double-digit growth was driven by steady expansion in existing projects as well as new customer projects launched in the 1Q.
- System Infrastructure Business: Demand for CNS original service “U-Way” continued to rise, winning orders from three new end users. In addition, the impact of project freezes and delays due to customer circumstances, such as the start of government cloud projects in local governments, was offset, resulting in growth turning positive in the 3Q.
- Business System Integration Business: Steady expansion in capabilities for projects related to economic security and system construction for securities companies, and beginning work on ERP-related projects aimed at building a track record, started to offset the impact of a significant reduction in the scope of operation and maintenance projects for some existing customers.
Quarterly Trend of Net Sales by Business (JPY million)
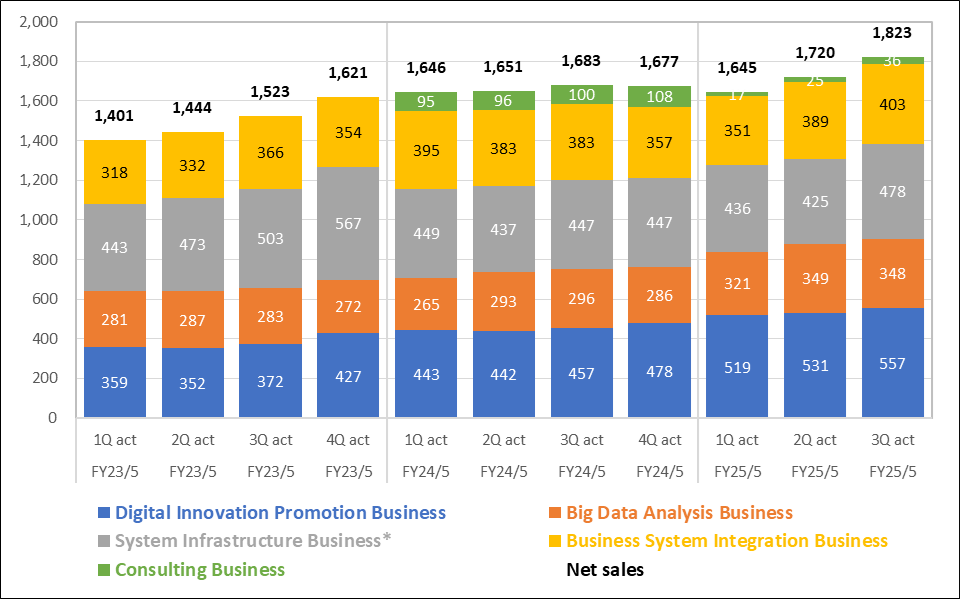
Source: compiled by Omega Investment from figures provided by CNS Corporate Planning Department IR.
*System Infrastructure Business includes cloud + on-premise.
- Consulting Business: CNS is significantly downsizing the organization with the aim of restructuring the business during the current fiscal year. At the same time, it is increasing staff for existing projects and promoting proposals to newly acquired customers. A GP loss was incurred due to the hiring of new consulting personnel and further efforts to expand the customer base.
- Commemorative Dividend to Celebrate the Company’s 40th Anniversary: On April 17, CNS announced a revision of its annual dividend forecast from 49.0 yen → 75.0 yen (+53%) to include a commemorative dividend of 26.0 yen (see graph on the bottom of P6 for details and trend of recent hikes).
- Relocation of Head Office: On February 14, CNS announced its Board of Directors resolved to relocate its head office to Shinagawa-ku, Tokyo, targeting October 2025 – November 2025. CNS plans to submit a proposal for approval to amend the Articles of Incorporation to the 40th Annual General Meeting of Shareholders to be held in August 2025. Regarding reasons for the move, since the onset of the COVID-19 pandemic, the Company has swiftly and efficiently transitioned to an online environment and restructured operations accordingly. While this shift has provided a convenient working environment, challenges associated with the online environment are increasing. At the same time, there is a growing need to enhance the convenience and productivity of remote work. The aims of relocation of the head office include: addressing the aforementioned challenges, optimizing the work environment for employees, improving business outcomes, fostering active innovation, providing a work environment that inspires a desire to come to the office, and further enhancing corporate value by introducing a hybrid work model that combines online and offline elements.
- Launch of new comprehensive DX consulting services: On February 21, CNS announced launch of new DX consulting services that provide comprehensive support from DX diagnosis and strategy formulation to human resource development through an accompanying-type approach. The background is efforts to enhance corporate value through DX are reported to be only halfway there, with many Japanese companies not yet seeing sufficient results. According to the IPA DX Trends 2024 report, in industries such as manufacturing, construction, distribution, ITC and services, 40% or less of companies responded that they are implementing DX across the entire company based on a company-wide strategy, indicating there are many challenges in DX initiatives.
- Launch of “ServiceNow ITSM Quick Starter Package”: On April 15, CNS announced the launch of “ServiceNow ITSM Quick Starter Package” for mid-sized companies, which can help implement ServiceNow in as short as just one month. This solution focuses on incident management and problem management, two core functions of ServiceNow’s IT Service Management (ITSM) capabilities, addressing the issue that many mid-sized companies have been reluctant to adopt global standard ServiceNow due to hurdles such as the time required for implementation and high initial costs.
SHARE PRICE AND VALUATIONS
3-Year Weekly Share Price Chart, 13W/26W/52W MA, Volume and Valuation Trends
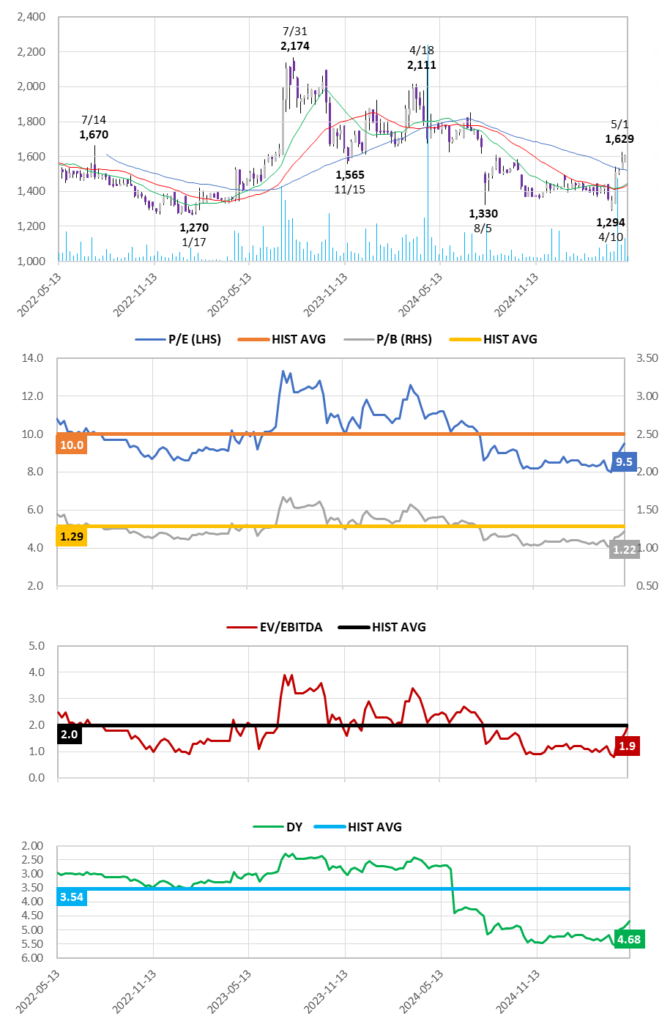
Key takeaways:
❶ The P/E and P/B ratios are trading 5.0% and 5.5% below their respective historical averages.
❷ EV/EBITDA on 1.9x is one of the lowest in the industry by far, and it is trading 4.0% below its historical average.
❸ The DY at 4.68% is one of the highest among peers, and some have yet to pay a dividend, trading 32% above its historical average.
➡Even adjusting for the lower liquidity of the TSE Growth Market shown on the following page using the TSE Mothers index, CNS valuations are all trading at the bottom of their listing ranges, presenting a contradiction with the underlying strong earnings, and prospects for double-digit growth to continue for the next 4-5 years.
3-Year Relative Share Price Performance versus Major Customers and Partners
Shareholder return policy
Expanding business by quickly identifying changes in the ICT industry and being proactive in taking on challenges in new fields, based on the trust and track record with major system integrators and ongoing relationships with them → these business characteristics enable CNS to secure stable revenues. In order to achieve sustainable growth together with share-holders, continuation of the progressive dividend policy to increase dividends in line with profit growth, with a target payout ratio of 30% or more.
Omega Investment’s case for CNS as an attractive opportunity
Omega Investment believes that CNS is one of those rare hidden gems among small cap growth companies waiting to be discovered. First, as an investor, it is reassuring that the Chairman and President are major shareholders, so their financial interests are directly aligned with shareholders. More importantly, management is taking steps to ensure a steady transition from the current DX-driven high market growth to sustainable growth regardless of underlying market conditions, including transforming the profit structure to higher margins not dependent on unpredictable contract-based orders.