2026-07-27
Home
Japanese

Omega Investment Co., Ltd.
KYODO PUBLIC RELATIONS (Investment report – 3Q update)
| Share price (12/2) | ¥900 | Dividend Yield (25/12 CE) | 1.6 % |
| 52weeks high/low | ¥610/974 | ROE(24/12) | 16.5 % |
| Avg Vol (3 month) | 10.2 thou shrs | Operating margin (24/12) | 14.7 % |
| Market Cap | ¥7.93 bn | Beta (5Y Monthly) | -0.38 |
| Enterprise Value | ¥4.60 bn | Shares Outstanding | 8.809 mn shrs |
| PER (25/12 CE) | 10.8 X | Listed market | TSE Standard |
| PBR (24/12 act) | 2.1 X |
| Click here for the PDF version of this page |
| PDF version |
Growth in both sales and profits continues, driven by PR, influencers, and AI. Investment stance remains neutral.
◇ Investment conclusion: maintain neutral, take a cautious incremental buying stance until “upside in quality” is confirmed
We believe that, as in the previous report, the investment stance toward KYODO PUBLIC RELATIONS (the “Company”) is at a phase of maintaining a neutral stance while considering incremental purchases in stages, confirming upside in qualitative KPIs at each earnings release. For the cumulative total for the third quarter of FY12/2025, net sales were 6,010 million yen (YoY +13.8%), operating profit was 957 million yen (YoY +15.9%), and quarterly net income attributable to owners of the parent was 538 million yen (YoY +39.8%), further strengthening the trend of growth in both sales and profits. We consider that the assessment made at the time of the first half results, that “there is substantial medium- to long-term re-rating potential,” remains appropriate in light of the progress in the third quarter.
In the previous report, we assumed a structure in which growth in the influencer business and the AI & Big Data solutions business is added on top of the stable PR business, and in which profit visibility increases through higher unit prices and recurring fees (MRR). In the current earnings results, in addition to PR, both of these areas also showed growth exceeding the previous year, driving double-digit operating profit growth, and this progress is broadly in line with expectations. The number of projects leveraging expertise in the healthcare domain and collaboration with KOLs is increasing, stemming from making Total Communications (TCI) a subsidiary, suggesting room for unit price improvement from the next fiscal year onward.
As in the previous report, we viewed the increase in SG&A expenses and non-operating expenses accompanying upfront investments, such as personnel hiring and the implementation of generative AI, as absorbable through the accumulation of high-value-added projects and recurring revenues. At this point, SG&A expenses and personnel expenses are still increasing, but growth in operating profit is exceeding these increases and remains within the range initially assumed. However, these investments are an ongoing theme and continue to warrant attention as a factor that can cause short-term volatility in profit margins. Although disclosure of qualitative KPIs (unit price, retention rate, MRR, etc.) has been expanded and progress is being made in project trends after TCI consolidation and implementation of AI products, quantitative disclosure remains limited, and the market has not yet reached the stage of moving in earnest to close the valuation gap.
Taking the above into account, we believe that while the Company’s shares still have room for re-rating over the medium to long term, in the short term, the burden of upfront investments and the cautious stance toward disclosure caps the upside in the share price. Accordingly, in this report we again basically adopt a neutral stance and conclude that it is appropriate to gradually raise the weighting at phases where any of the following are confirmed: (i) continued growth in the three pillars of PR, influencers, and AI; (ii) concrete examples of unit price improvement in specialized domains including TCI; and (iii) further visualization of qualitative KPIs.
◇ FY12/2025 third-quarter earnings highlights: maintaining double-digit growth in sales and profits, accelerating profit growth while absorbing the burden of growth investments
For the FY12/2025 3Q, the Company delivered earnings that maintained double-digit growth in both sales and profits while absorbing non-operating headwinds, including foreign exchange losses and equity-method investment losses. Consolidated net sales were 6,010 million yen (YoY +13.8%), operating profit was 957 million yen (YoY +15.9%), ordinary profit was 954 million yen (YoY +15.5%), and quarterly net income attributable to owners of the parent was 538 million yen (YoY +39.8%), with growth in net income standing out.
Progress toward the full-year forecasts (net sales of 8,500 million yen, operating profit of 1,280 million yen, ordinary profit of 1,280 million yen, and net income of 730 million yen) is at high levels: 70.7% for net sales, 74.8% for operating profit, and 73.7% for net income. This aligns with the scenario in the medium-term plan, which calls for three consecutive fiscal years of growth in both sales and profits, and we judge there has been no change in the trend of earnings growth.
On the profit side, while gross profit steadily increased to 2,718 million yen (YoY +12.3%), SG&A expense were held to 1,760 million yen (YoY +10.5%), and the operating profit margin improved slightly to 15.9% from 15.6% in the same period of the previous fiscal year. While continuing growth investments such as personnel expenses and AI-related investments, the Company is in a structure in which its ability to absorb costs is increasing through unit price improvement in existing projects and a higher ratio of retainer contracts.
Non-operating expenses increased to 15.24 million yen (9.34 million yen at the same period previous fiscal year). The main factors were foreign exchange losses of 4.98 million yen and equity-method investment losses of 1.64 million yen, and factors such as financial market conditions and losses at investees offset part of the profit growth. However, there was also a reaction to the recognition in the previous fiscal year of valuation losses on investment securities of 48.32 million yen, and with special losses falling to zero, profit before income taxes expanded to 954 million yen.
The financial position has been further strengthened. While total assets were flat at 5,875 million yen (5,810 million yen at the end of previous fiscal year), net assets increased to 4,317 million yen (3,889 million yen at the end of the previous fiscal year), and the equity ratio rose to 65.1%. Long-term borrowings have declined from 307 million yen to 181 million yen, and dependence on interest-bearing debt is on a downward trend. We evaluate the high equity ratio and net cash position as a financial base that enables continued investment for future growth, such as M&A and the development of AI products.
On the business side, DBPR Inc. (DBPR), which was consolidated in August, and TCI, which was consolidated in August, have begun contributing as factors boosting sales and profits in the PR domain. On a standalone third-quarter basis, net sales grew 19.6% YoY, and operating profit rose 24.8% YoY. Full contribution from consolidated subsidiaries and deepening of specialized domains are increasing the growth rate.
For the FY12/2025 3Q, earnings made even clearer the picture of “multi-faceted growth” in which growth in influencers and AI & Big data overlaps with the core PR business. Although non-operating noise and the burden of investments continue, the fact that double-digit growth in sales and profits and improvement in financial soundness are progressing in parallel is, we believe, a factor that enhances the credibility of the Company’s medium-term growth story going forward.
With operating profit progress around 75% in the third quarter and financial leverage decreasing, the Company left its full-year forecasts unchanged. Short-term expectations for an upward revision have receded. Still, we consider it appropriate to view the current earnings results as a “run-up period” for the growth story, as there is substantial room for AI-related investments to raise profitability from the next fiscal year onward.
◇ Segment analysis: three pillars of PR, influencers, and AI all delivering higher sales and profits, with a healthy business portfolio
For the FY12/2025 3Q, each of the three businesses—PR, influencer marketing, and AI & Big data solutions—secured higher sales and was profitable, with both core and growth areas generating profits in a well-balanced manner. To briefly organize the Company’s business activities:
・PR business:
Provides corporate and government public relations consulting, press conference operations, crisis management support, etc., mainly through retainer contracts.
・Influencer marketing business:
Centered on subsidiary VAZ, develops tie-up videos on YouTube and social media, hosts events, and operates a proprietary media platform.
・AI & Big data solutions business:
Provides SaaS-type data analysis services using a proprietary crawling and analysis platform, with monthly subscription revenues as the core.
In the PR business, the Company is streamlining routine work by introducing tools for drafting materials and analyzing coverage using generative AI, while increasing the consulting element. In addition, through Total Communications, composed solely of registered dietitians, and DBPR, which is strong in regional projects, the Company is capturing highly specialized projects in areas such as healthcare and local government. With the accumulation of these high-unit-price projects, the PR business alone has become a highly profitable segment, generating 837 million yen in profit.
The influencer marketing business posted net sales of 922 million yen and profit of 96 million yen, showing the highest growth rate among the three businesses. In addition to continuing to receive orders for large-scale PR initiatives for major foreign cosmetics brands, event-type promotions that combine the worldview of popular creators with brands have been successful, expanding the business model beyond dependence on advertising and social-media revenues. Because the business can leverage the viewer base of its proprietary media targeting Generation Z, there is substantial upside potential going forward, both in project unit prices and continuity.
The AI & Big data solutions business steadily expanded net sales to 778 million yen, while profit remained high at 131 million yen, but declined YoY due to investment-related costs, such as increased personnel. On the other hand, SaaS services such as “CERVN” and “Shtock Data” are growing steadily, and the high recurring revenue ratio is a positive factor. Positioned to capture the advanced data analysis needs of the PR business, this segment is expected, over the medium term, to play a role in raising the Group’s overall profit levels.
The structure in which stable earnings from PR are overlapped by growth drivers in influencers and AI has become clear. Looking ahead, whether the Company can maintain the high profit margin of the PR business while further expanding sales in influencers and AI, and raising the profit scale of all three pillars by another step, will be the key factor determining medium-term business performance and share price valuation.
◇ Earnings outlook: the company’s plan is somewhat conservative, with the medium-term plan line well within reach
For the full-year FY12/2025, we see a high likelihood that the Company will achieve its plan and also discern room for upside, but at this stage, we are not yet confident enough to expect an upward revision. Therefore, it is reasonable to base valuation on the Company’s forecasts, viewing earnings upside as a scenario.
In FY12/2024, results were net sales of 7,324 million yen, operating profit of 1,075 million yen, and net income of 526 million yen (YoY +7.9%), landing ahead of the medium-term plan in terms of profits. Against this, the Company’s FY12/2025 forecasts call for net sales of 8,500 million yen (YoY +16.1%), operating profit of 1,280 million yen (YoY +19.1%), ordinary profit of 1,280 million yen (YoY +18.3%), and net income of 730 million yen (YoY +38.7%), projecting growth in both sales and profits for the third consecutive fiscal year. As of the cumulative third quarter, net sales have progressed to around 70% of the full-year plan, and operating profit and net income to around three-quarters, and as long as we assume the current order situation continues, downside risk appears extremely limited. That said, given the Company’s tendency to estimate fourth-quarter expenses conservatively each year, we think it prudent at this point not to factor in excessive expectations for an upward revision to full-year earnings.
The medium-term management plan (FY2024–FY2026) targets net sales of 10.0 billion yen, operating profit of 1,600 million yen, and net income of 900 million yen in FY12/2026. Within this, the FY12/2025 full-year forecasts of net sales of 8,500 million yen and operating profit of 1,280 million yen remain somewhat conservative relative to the growth path depicted in the plan. Given that operating profit in 2024 has already slightly exceeded the medium-term plan line, we see the current plan as a cautious scenario that emphasizes “achievability,” and we also consider it possible that actual results will exceed the plan in the period from 2025 to 2026.
Growth drivers will continue to center on three points: (i) further shift of the PR business toward consulting and a higher ratio of retainer contracts; (ii) increases in both unit prices and number of projects in influencer deals with VAZ at the core; and (iii) accumulation of SaaS revenues in the AI & Big Data solutions business. In practice, under its “full AI shift declaration,” the Company is implementing generative AI functions in the in-house tool “SAKAE” and the SaaS-type services “PR-FORCE” and “AI-Press,” thereby accelerating PR-DX through features such as AI-generated PPTs from search results and tone analysis. These investments simultaneously achieve greater efficiency and higher added value at PR frontlines, and, over the medium term, are expected to lead to higher project unit prices and growth in recurring revenues.
Negative factors and risks are also clear. First, there is a high likelihood that upfront costs related to generative AI, SaaS development, and personnel hiring will persist. In the short term, these may weigh on growth in operating profit margins. Second, if a wave of economic slowdown and reductions in advertising and promotion expenses spreads to the public relations and PR market, there could be downside risk to the medium-term plan scenario, which is premised on high growth.
FY12/2025 is an interim year toward achieving the medium-term management plan and a phase in which, even based on the Company’s strategy, significant growth in both sales and profits can be expected. At present, we do not go so far as to assume that numerical targets will be significantly exceeded, and position this as a phase to assess to what extent the results of growth investments in PR-DX, influencers, and AI become visible in further improvement in the operating profit margin.
We consider the full-year forecasts somewhat conservative relative to the medium-term plan and, given progress through the third quarter, see a high probability of achieving them. On the other hand, because upfront costs associated with generative AI and post-M&A integration work will continue, we wish to avoid valuing the shares on the assumption of short-term profit upside. From an investor’s perspective, we would like to make the following checkpoints for the medium-term growth scenario: (i) achievement of full-year growth in operating profit; (ii) updated messages regarding the FY2026 targets; and (iii) expanded disclosure of KPIs for AI-related services (such as MRR and number of contracted companies).
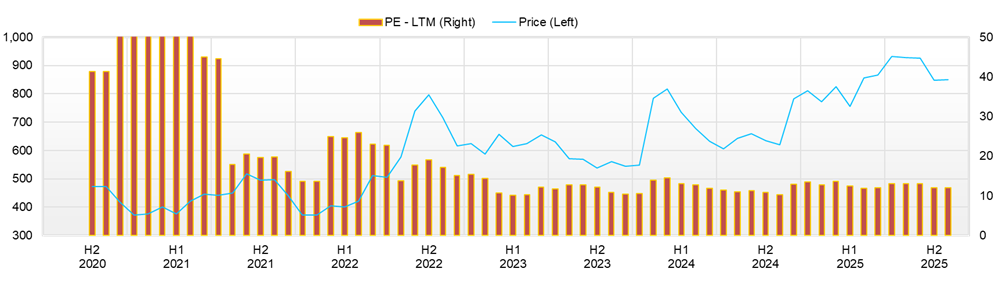
◇ Share price trends and points of focus going forward: pause after hitting highs, “waiting in a trading range” as AI shift and earnings are priced in
After a correction of around 10% from its year-to-date high, the share price has settled into a trading range centered on the mid-800-yen level. Although there is a rich news flow related to the AI shift, at present, this has not become a decisive factor in lifting the valuation of the Company’s shares, and we are at a phase in which the following earnings results and confirmation of progress in the medium-term plan will be key to a trend reversal.
The share price hit its year-to-date high of 974 yen on August 7, 2025, and, as of the November 18 closing price of 859 yen, was about 12% below that high. Daily, for the late October to mid-November period, for which we can check data over the past three months, closing prices mostly stayed within 840–880 yen, with the share price continuing to move without a clear direction. Meanwhile, given its quantitative profile—market capitalization of roughly 7,500 million yen, forecast PER of 10.36x, PBR of 1.96x, ROE of 15.84%, ROIC of 17.18%, net cash of 2,906 million yen, and beta of 0.71, we can position the current level as “fair to slightly undervalued for a mid-cap growth stock with defensive characteristics.”
Looking at the relationship between news flow and share price reactions, we can observe a certain degree of impact from the third-quarter earnings report (November 13). The closing price on the trading day immediately before the results was 859 yen (November 12), and the closing price on the announcement day was 881 yen (+2.6%), with trading volume rising from 4,100 shares to 16,400 shares. On the next trading day, November 14, the share price returned to around the pre-announcement level at 858 yen (-2.6%), reflecting a move in which “the results were initially received positively and triggered buying once, but the price then converged back within the range.”
AI-related news is an essential medium-term theme for the share price. On October 1, with the implementation of Claude Sonnet 4.5, the latest LLM was incorporated into SAKAE, PR-FORCE, and AI-Press; on August 20, the Company announced its “full AI shift declaration”; on August 22, it added AI analysis functions for consumer purchase reviews to SAKAE; and on September 4, it added a function to automatically generate PPTs from AI search results in PR-FORCE and AI-Press, among other releases related to PR-DX. However, even after these AI-related disclosures, the share price has remained in the 800–900 yen range without setting new year-to-date highs, and we interpret this as indicating that the market currently views these as “positive future themes whose earnings impact is still in the process of being evaluated.”
From a technical perspective, the fact that price movements in late October to mid-November stayed within a narrow range of 840–880 yen, with daily price fluctuations of only about 20–30 yen, indicates a clearly trendless market in the short term. Although the post-earnings rise on November 13–14 temporarily tested the upper end of the range (the high at 880 yen), it did not lead to a breakout, and trading volume did not reach a level that could be called a surge. The low volatility and beta of 0.71 confirm the stock’s characteristic of not being strongly index-driven, reacting to stock-specific factors, and being relatively resistant to large swings.
Conditions under which an overweight position could be considered include, first, upside in operating profit at the time of full-year results (or numerical upgrades in progress relative to the medium-term plan); second, disclosure and expansion of qualitative KPIs such as MRR, number of contracts, and unit prices and retention rates in each of the AI, influencer, and healthcare domains; and third, clarification of the shareholder return policy (messages on payout ratio and leeway for flexible share buybacks) in light of the AI shift and subsidiary integrations. Conversely, if headwinds in the advertising and PR market or prolonged burdens from upfront investments make it difficult to see improvement in the operating profit margin, taking profits in phases when the share price approaches the 900-yen level would also be an option. Rather than short-term trading, we consider a practical investment timing to be buying on dips within the range, using earnings results and IR events as starting points.
We see the current share price range as a middle ground that, given the Company’s financial soundness and ROE level, is neither excessively expensive nor yet fully pricing in the future value of the AI shift and PR-DX. It therefore appears realistic to adjust the weighting on dips at the low- to mid-800-yen level while confirming, at the following full-year results and medium-term plan update, how far the link between KPIs for AI-related services and profit growth becomes visible.
Company profile
◇ Evolution from a long-established pure-play PR firm to an “integrated communications company.”
KYODO PUBLIC RELATIONS is advancing its transformation into an integrated communications company built on three inextricably linked pillars—PR, influencer marketing, and AI/Big data solutions—while retaining its foundation as a long-established independent PR firm. The core of its business model is long-term retainer contracts, and a distinctive feature is its stock-type revenue structure, in which it maintains ongoing public relations and PR support contracts with many companies.
The Company was founded on November 14, 1964, and had 361 consolidated employees as of June 2025. The Group includes PR subsidiary DBPR and Total Communications, which has strengths in medical communications, and in March 2025, it invested in AI model Inc. This company generates fashion models and talents using proprietary AI technologies. In the medium-term management plan announced in February 2024, the Company has set its mission as becoming a “New’s design company” that creates the most valuable content and has laid out a growth strategy based on a complete AI shift.
Key financial data
| Unit: million yen | 2020/12 | 2021/12 | 2022/12 | 2023/12 | 2024/12 | 2025/12 CE |
| Sales | 4,990 | 5,610 | 5,265 | 6,896 | 7,324 | 8,500 |
| EBIT (Operating Income) | 157 | 381 | 720 | 841 | 1,075 | 1,280 |
| Pretax Income | 70 | 288 | 768 | 862 | 1,034 | |
| Net Profit Attributable to Owner of Parent | 13 | 132 | 520 | 488 | 526 | 730 |
| Cash & Short-Term Investments | 1,531 | 1,943 | 2,318 | 2,691 | 3,260 | |
| Total assets | 3,068 | 3,572 | 5,044 | 5,428 | 5,810 | |
| Total Debt | 531 | 591 | 967 | 767 | 539 | |
| Net Debt | -1,000 | -1,352 | -1,351 | -1,925 | -2,721 | |
| Total liabilities | 1,254 | 1,630 | 2,267 | 2,097 | 1,921 | |
| Total Shareholders’ Equity | 1,814 | 1,942 | 2,595 | 3,090 | 3,553 | |
| Net Operating Cash Flow | 384 | 442 | 546 | 771 | 911 | |
| Capital Expenditure | 30 | 155 | 67 | 54 | 33 | |
| Net Investing Cash Flow | -102 | -26 | -397 | -35 | -37 | |
| Net Financing Cash Flow | 242 | 16 | 220 | -375 | -311 | |
| Free Cash Flow | 355 | 286 | 479 | 717 | 878 | |
| ROA (%) | 0.43 | 3.97 | 12.08 | 9.31 | 9.36 | |
| ROE (%) | 0.68 | 7.03 | 22.94 | 17.15 | 15.84 | |
| EPS (Yen) | 1.6 | 16.3 | 61.2 | 56.6 | 60.6 | 84.1 |
| BPS (Yen) | 229.8 | 236.1 | 299.5 | 356.7 | 408.2 | |
| Dividend per Share (Yen) | 6.00 | 7.00 | 8.00 | 10.00 | 12.00 | 14.00 |
| Shares Outstanding (Million shrs) | 8.18 | 8.64 | 8.74 | 8.78 | 8.79 |
Source: Omega Investment from company data, rounded to the nearest whole number.
Share price
Key stock price data
Financial data (quarterly basis)
| Unit: million yen | 2023/12 | 2024/12 | 2025/12 | ||||||
| 3Q | 4Q | 1Q | 2Q | 3Q | 4Q | 1Q | 2Q | 3Q | |
| (Income Statement) | |||||||||
| Sales | 1,689 | 1,943 | 1,788 | 1,779 | 1,716 | 2,041 | 2,037 | 1,922 | 2,052 |
| Year-on-year | 21.3% | 16.8% | 8.4% | 10.2% | 1.6% | 5.0% | 13.9% | 8.0% | 19.6% |
| Cost of Goods Sold (COGS) | 956 | 1,128 | 972 | 966 | 925 | 1,147 | 1,108 | 1,077 | 1,107 |
| Gross Income | 734 | 815 | 816 | 814 | 791 | 894 | 929 | 845 | 945 |
| Gross Income Margin | 43.4% | 42.0% | 45.6% | 45.7% | 46.1% | 43.8% | 45.6% | 44.0% | 46.1% |
| SG&A Expense | 540 | 616 | 519 | 545 | 530 | 646 | 560 | 581 | 620 |
| EBIT (Operating Income) | 194 | 200 | 297 | 269 | 261 | 248 | 369 | 264 | 325 |
| Year-on-year | 26.6% | 45.6% | 11.2% | 49.2% | 34.4% | 24.4% | 24.1% | -1.7% | 24.8% |
| Operating Income Margin | 11.5% | 10.3% | 16.6% | 15.1% | 15.2% | 12.2% | 18.1% | 13.7% | 15.9% |
| EBITDA | 251 | 254 | 349 | 319 | 312 | 298 | 414 | 311 | 375 |
| Pretax Income | 202 | 206 | 277 | 271 | 230 | 256 | 366 | 260 | 328 |
| Consolidated Net Income | 126 | 152 | 147 | 177 | 147 | 150 | 244 | 167 | 218 |
| Minority Interest | 19 | 15 | 31 | 28 | 26 | 10 | 28 | 27 | 34 |
| Net Income ATOP | 106 | 137 | 116 | 148 | 121 | 141 | 215 | 140 | 184 |
| Year-on-year | 24.1% | 39.3% | -19.5% | 49.1% | 13.6% | 2.5% | 85.1% | -5.6% | 51.9% |
| Net Income Margin | 6.3% | 7.1% | 6.5% | 8.3% | 7.0% | 6.9% | 10.6% | 7.3% | 9.0% |
| (Balance Sheet) | |||||||||
| Cash & Short-Term Investments | 2,327 | 2,691 | 2,657 | 2,980 | 2,946 | 3,260 | 3,115 | 3,422 | 3,305 |
| Total assets | 4,905 | 5,428 | 5,286 | 5,448 | 5,342 | 5,810 | 5,598 | 5,871 | 5,876 |
| Total Debt | 826 | 767 | 707 | 647 | 586 | 539 | 490 | 445 | 400 |
| Net Debt | -1,500 | -1,925 | -1,950 | -2,333 | -2,360 | -2,721 | -2,625 | -2,977 | -2,906 |
| Total liabilities | 1,771 | 2,097 | 1,885 | 1,855 | 1,615 | 1,921 | 1,704 | 1,782 | 1,558 |
| Total Shareholders’ Equity | 2,908 | 3,090 | 3,129 | 3,293 | 3,401 | 3,553 | 3,617 | 3,786 | 3,979 |
| (Profitability %) | |||||||||
| ROA | 9.03 | 9.31 | 9.12 | 9.79 | 10.20 | 9.36 | 11.49 | 10.90 | 12.12 |
| ROE | 16.52 | 17.15 | 15.92 | 16.72 | 16.57 | 15.84 | 18.54 | 17.43 | 18.42 |
| (Per-share) Unit: JPY | |||||||||
| EPS | 12.3 | 15.9 | 13.4 | 17.1 | 13.9 | 16.2 | 24.7 | 16.0 | 21.0 |
| BPS | 337.0 | 356.7 | 361.1 | 379.0 | 391.4 | 408.2 | 415.5 | 433.6 | 455.8 |
| Dividend per Share | 0.00 | 10.00 | 0.00 | 0.00 | 0.00 | 12.00 | 0.00 | 0.00 | 0.00 |
| Shares Outstanding(million shrs) | 8.75 | 8.78 | 8.79 | 8.79 | 8.79 | 8.79 | 8.81 | 8.81 | 8.81 |
Source: Omega Investment from company materials
Financial data (full-year basis)
| Unit: million yen | 2014 | 2015 | 2016 | 2017 | 2018 | 2019 | 2020 | 2021 | 2022 | 2023 | 2024 |
| (Income Statement) | |||||||||||
| Sales | 4,063 | 3,705 | 4,100 | 4,379 | 5,318 | 5,758 | 4,990 | 5,610 | 5,265 | 6,896 | 7,324 |
| Year-on-year | 1.1% | -8.8% | 10.7% | 6.8% | 21.4% | 8.3% | -13.3% | 12.4% | -6.1% | 31.0% | 6.2% |
| Cost of Goods Sold | 2,223 | 1,385 | 1,703 | 1,822 | 2,546 | 2,879 | 2,367 | 2,614 | 2,843 | 3,894 | 4,010 |
| Gross Income | 1,840 | 2,320 | 2,396 | 2,558 | 2,772 | 2,879 | 2,623 | 2,996 | 2,422 | 3,002 | 3,314 |
| Gross Income Margin | 45.3% | 62.6% | 58.5% | 58.4% | 52.1% | 50.0% | 52.6% | 53.4% | 46.0% | 43.5% | 45.3% |
| SG&A Expense | 569 | 597 | 2,216 | 2,293 | 2,324 | 2,374 | 2,456 | 2,597 | 1,685 | 2,147 | 2,225 |
| EBIT (Operating Income) | 1,271 | 1,723 | 180 | 265 | 444 | 502 | 157 | 381 | 720 | 841 | 1,075 |
| Year-on-year | -34.0% | 35.5% | -89.5% | 46.7% | 68.0% | 12.9% | -68.8% | 143.8% | 88.7% | 16.8% | 27.8% |
| Operating Income Margin | 31.3% | 46.5% | 4.4% | 6.0% | 8.4% | 8.7% | 3.1% | 6.8% | 13.7% | 12.2% | 14.7% |
| EBITDA | 1,282 | 1,733 | 195 | 284 | 468 | 534 | 202 | 447 | 857 | 1,059 | 1,279 |
| Pretax Income | -386 | 132 | 181 | 257 | 432 | 502 | 70 | 288 | 768 | 862 | 1,034 |
| Consolidated Net Income | -515 | 108 | 163 | 221 | 366 | 372 | 13 | 132 | 539 | 546 | 621 |
| Minority Interest | 0 | 0 | 0 | 0 | 0 | 0 | 0 | 0 | 18 | 58 | 95 |
| Net Income ATOP | -515 | 108 | 163 | 221 | 366 | 372 | 13 | 132 | 520 | 488 | 526 |
| Year-on-year | 803.1% | -121.0% | 51.2% | 35.3% | 65.8% | 1.5% | -96.6% | 943.0% | 294.4% | -6.3% | 7.9% |
| Net Income Margin | -12.7% | 2.9% | 4.0% | 5.0% | 6.9% | 6.5% | 0.3% | 2.4% | 9.9% | 7.1% | 7.2% |
| (Balance Sheet) | |||||||||||
| Cash & Short-Term Investments | 851 | 473 | 611 | 659 | 1,012 | 1,032 | 1,531 | 1,943 | 2,318 | 2,691 | 3,260 |
| Total assets | 2,408 | 2,247 | 1,784 | 2,113 | 2,637 | 2,831 | 3,068 | 3,572 | 5,044 | 5,428 | 5,810 |
| Total Debt | 478 | 402 | 462 | 390 | 280 | 163 | 531 | 591 | 967 | 767 | 539 |
| Net Debt | -373 | -71 | -149 | -269 | -732 | -869 | -1,000 | -1,352 | -1,351 | -1,925 | -2,721 |
| Total liabilities | 1,910 | 1,622 | 1,003 | 1,105 | 1,109 | 930 | 1,254 | 1,630 | 2,267 | 2,097 | 1,921 |
| Total Sharehjolders’ Equity | 498 | 625 | 782 | 1,008 | 1,528 | 1,901 | 1,814 | 1,942 | 2,595 | 3,090 | 3,553 |
| (Cash Flow) | |||||||||||
| Net Operating Cash Flow | 76 | -260 | 125 | 152 | 437 | 274 | 384 | 442 | 546 | 771 | 911 |
| Capital Expenditure | 9 | 8 | 13 | 9 | 15 | 36 | 30 | 155 | 67 | 54 | 33 |
| Net Investing Cash Flow | 8 | -68 | -16 | -15 | -131 | -123 | -102 | -26 | -397 | -35 | -37 |
| Net Financing Cash Flow | 68 | -79 | 31 | -89 | 47 | -132 | 242 | 16 | 220 | -375 | -311 |
| Free Cash Flow | 67 | -264 | 112 | 144 | 422 | 238 | 355 | 286 | 479 | 717 | 878 |
| (Profitability %) | |||||||||||
| ROA | -22.91 | 4.64 | 8.11 | 11.34 | 15.43 | 13.60 | 0.43 | 3.97 | 12.08 | 9.31 | 9.36 |
| ROE | -69.43 | 19.25 | 23.24 | 24.69 | 28.89 | 21.69 | 0.68 | 7.03 | 22.94 | 17.15 | 15.84 |
| Net Margin | -12.68 | 2.92 | 3.99 | 5.05 | 6.89 | 6.46 | 0.25 | 2.35 | 9.89 | 7.07 | 7.18 |
| Asset Turn | 1.81 | 1.59 | 2.03 | 2.25 | 2.24 | 2.11 | 1.69 | 1.69 | 1.22 | 1.32 | 1.30 |
| Assets/Equity | 3.03 | 4.15 | 2.87 | 2.18 | 1.87 | 1.59 | 1.59 | 1.77 | 1.90 | 1.84 | 1.69 |
| (Per-share) Unit: JPY | |||||||||||
| EPS | -69.9 | 14.7 | 22.2 | 30.0 | 46.6 | 46.6 | 1.6 | 16.3 | 61.2 | 56.6 | 60.6 |
| BPS | 67.5 | 84.7 | 106.0 | 136.7 | 191.9 | 237.9 | 229.8 | 236.1 | 299.5 | 356.7 | 408.2 |
| Dividend per Share | 0.00 | 0.00 | 0.00 | 0.00 | 2.50 | 5.00 | 6.00 | 7.00 | 8.00 | 10.00 | 12.00 |
| Shares Outstanding(million shrs) | 7.56 | 7.56 | 7.56 | 7.56 | 8.15 | 8.17 | 8.18 | 8.64 | 8.74 | 8.78 | 8.79 |
Source: Omega Investment from company materials