2026-05-19
Home
Japanese

Omega Investment Co., Ltd.
Chiome Bioscience (Investment report – 3Q update)
| Share price (12/2) | ¥113 | Dividend Yield (25/12 CE) | – % |
| 52weeks high/low | ¥111/294 | ROE(24/12 act) | -66.9 % |
| Avg Vol (3 month) | 547.4 thou shrs | Operating margin (TTM) | -132.0 % |
| Market Cap | ¥7.6 bn | Beta (5Y Monthly) | 0.3 |
| Enterprise Value | ¥6.6 bn | Shares Outstanding | 68.053 mn shrs |
| PER (25/12 CE) | – X | Listed market | TSE Growth |
| PBR (24/12 act) | 6.2 X |
| Click here for the PDF version of this page |
| PDF version |
Pipeline taking on pediatric cancer and a wave of partnerships; awaiting the next revenue event.
Investment conclusion
Chiome Bioscience Inc. (the “Company”) maintains the same basic stance on its shares as in the previous report, namely “neutral to slightly bullish,” and we judge that there are entry opportunities for investors with a high risk tolerance on pullbacks before and after revenue events. Although the phase of high PBR with losses continues, with a market capitalization of 8.7 billion yen, a PBR of 6.96x, ROE of −66.33%, and net cash of about 926 million yen, net sales for the Q3 FY12/2025 (cumulative) were 369 million yen and the operating loss was 805 million yen, with the loss narrowing by 115 million yen from the same period of the previous year. Taking into account progress in the pipeline and the Company’s IDD- and biosimilar-related alliances, we believe the Company still retains medium- to long-term growth potential and upside for the share price.
On the earnings front, although net sales in the drug discovery support business declined to 369 million yen, a year-on-year decrease, the Company reduced R&D expenses from 743 million yen to 586 million yen, shrinking the operating loss from 921 million yen to 805 million yen. The trend toward narrowing losses through cost optimization, noted in the previous report, has generally progressed as expected. The growth driver CBA-1205, in addition to a PR case in hepatocellular carcinoma and a long-term SD case in melanoma, is at the execution stage of adding a pediatric cancer cohort, and CBA-1535 is also continuing dose escalation in the Phase 1 monotherapy study without any significant safety concerns, reinforcing the hypothesis of accumulating signals in early clinical stages.
Furthermore, in a short period, the Company has successively entered into external alliances that span drug discovery support, IDD, and new modalities, including a new jointly developed biosimilar with Alfresa HD and Kidswell, a joint venture concept among four companies, including Mycenax for domestic manufacturing facilities, an IDD collaboration with Axcelead DDP (a platform-type business related to antibody drug discovery), and a joint research project with NANO MRNA on mRNA-encoded antibodies. It is also positive that external validation of the platform has progressed following the PFKR license.
On the other hand, with respect to the hypothesis in the previous investment conclusion that “if clinical signals and visibility on additional out-licensing and IDD deal formation emerge, a reassessment of valuation will progress,” we cannot at this point confirm an upward shift in the share price range. At the time of the previous report, the market capitalization was 9.1 billion yen, PBR was 6.08x, and the share price was around 140 yen; currently, the market capitalization is 8.7 billion yen, and PBR is 6.96x. However, PBR has edged up; the share price has remained in a roughly 120–150 yen range over the past three months. We believe that the fact that it is not yet at a stage where a concrete contribution to earnings and profit can be foreseen is capping the upside in the valuation.
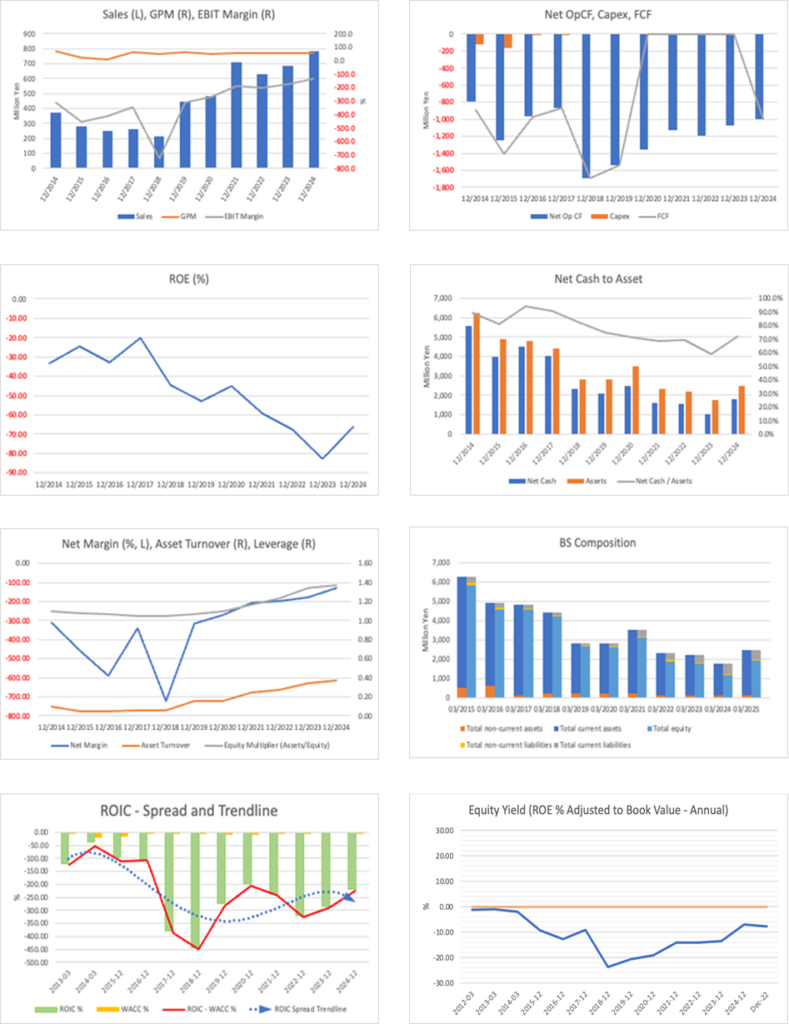
The source of the Company’s strength lies in its upstream drug discovery platforms represented by ADLib®, Tribody®, and DoppeLib™, and its dual-track business model that deploys these platforms into its in-house pipeline, drug discovery support, IDD, and biosimilars, with intellectual property arranged across multiple jurisdictions, including Japan, the U.S., Europe, and China. ROE and ROIC are both profoundly negative before monetization. Still, the balance sheet remains robust, with an equity ratio of 80.7% and cash and deposits of 1.01 billion yen, and whether the Company can leverage the cushion of net cash of about 926 million yen to see through the “growth investment phase until a chain of out-licensing begins” will be the dividing line for whether it can move from the dawn phase to the growth and expansion phase. For the time being, we see it as realistic to maintain a generally neutral stance and adopt an “event-driven” approach, increasing or decreasing positions at phases when out-licensing of CBA-1205/1535 and mRNA-encoded antibodies, and the contribution of IDD and biosimilar deals to earnings, become concrete.
◇ Highlights of results for the third quarter of FY12/2025: loss narrowed despite lower sales due to compression of R&D expenses; qualitatively positive with progress in pipeline and IDD
For the Q3 FY12/2025 (cumulative), although net sales declined year on year, the Company narrowed its losses at the operating income level and below by cutting R&D expenses, delivering results that maintained financial resilience while advancing the pipeline and IDD. While there remain challenges in topline momentum, the business structure, and the quality of the development portfolio, the results can be described as having room for positive evaluation.
In quantitative terms, net sales for the Q3 FY12/2025 (cumulative) were limited to 369 million yen (- 12.5% YoY), all of which came from the drug discovery support business. Gross profit shrank to 204 million yen (down 7.1% YoY), but the gross income margin remained high at around 55%. SG&A expenses, on the other hand, were 1.009 billion yen (- 11.5% YoY), led by a 157 million yen decrease in R&D expenses to 586 million yen from the same period of the previous year, which drove overall cost reductions. As a result, the operating loss improved by 115 million yen year on year to 805 million yen, and the ordinary loss and quarterly net loss were 807 million yen and 800 million yen, respectively, narrowing at all levels.
Although the drug discovery support business recorded year-on-year declines in both net sales and profit, it maintained a high level of profitability. Net sales for the Q3 FY12/2025 (cumulative) were 369 million yen (-49 million yen YoY), segment profit was 204 million yen (- 12 million yen YoY), and the segment profit margin was 55.2%, exceeding the Company’s target of 50%. While the decline in net sales reflects fewer projects from existing customers, initiatives to broaden the base of both new and existing customers have progressed, including the conclusion of new basic outsourcing agreements with Nitto Boseki and Mochida Pharmaceutical, and the expansion of the scope of the business alliance agreement with Merck.
In the drug discovery business, Phase 1 clinical studies of CBA-1205 and CBA-1535 are ongoing. For CBA-1205, in addition to hepatocellular carcinoma and melanoma, a cohort targeting pediatric cancer, which has high unmet medical needs, was added in August 2025, and dosing of eligible patients has already started. For CBA-1535, the Company is continuing stepwise dose escalation in solid tumor patients to confirm safety and pharmacodynamic signals, and no serious safety concerns have been observed to date. In addition, for multiple preclinical projects, discussions are ongoing with potential out-licensing partners.
On the new modality and business front, the Company entered into a joint research agreement with NANO MRNA for mRNA-encoded antibodies. It launched a next-generation therapeutics development project combining the Tribody® format and mRNA drug discovery platform technologies. In the IDD business, after executing a business alliance with SRD in March 2025, the Company concluded a basic agreement in October with Axcelead DDP to collaborate, aiming to strengthen its project acquisition capabilities through partnerships with drug discovery solution providers. In addition, it concluded a basic agreement and a basic contract with Alfresa HD and Kidswell Bio for the joint development of biosimilars, thereby advancing the framework for building Japan’s first fully integrated domestic biosimilar supply chain, another key topic since the third quarter.
Looking at the financial position, total assets decreased by about 919 million yen from the end of the previous fiscal year to 1.55 billion yen, mainly due to the decrease in cash and deposits. The balance of cash and deposits, at 1.01 billion yen, remains ample, but cash consumption continues due to R&D expenses and the repayment of borrowings. Interest-bearing debt has been reduced to 299 million yen, mainly through the repayment of short-term borrowings, while net assets are 1.25 billion yen, and the equity ratio remains high at 80.7%. There is no note regarding going concern, and we judge that the Company has secured financial safety margins.
In summary, although the third-quarter results include negative factors such as lower net sales and a decrease in cash and deposits, it is encouraging that the Company controlled R&D expenses, maintained highly profitable drug discovery support, and rapidly built multiple alliances in areas such as mRNA, biosimilars, and IDD. While the short-term earnings impact is limited, whether investors evaluate this as a “seeding period” for future milestones and royalties will be a key point of divergence.
◇ Segment analysis: net sales fully supported by drug discovery support; drug discovery and IDD are “future cash sources” in the investment phase
The Company has two segments, the “drug discovery business” and the “drug discovery support business.” In the Q3 FY12/2025 (cumulative), all net sales of 369 million yen came from the drug discovery support business, while the drug discovery business remains in an investment phase centered on R&D expenses. The IDD and biosimilar businesses currently run across these two segments, and are positioned as “candidates for a third revenue pillar” in the medium term.
The segments are structured as follows.
- Drug discovery business: responsible for the research, development, and out-licensing of in-house generated monoclonal antibodies and multispecific antibodies. It has a pipeline that includes CBA-1205, a DLK-1-targeting antibody, and CBA-1535, a T cell engager, and internally handles everything from design and execution of early clinical studies.
- Drug discovery support business: a stable revenue business that provides contract services such as antibody generation, affinity maturation, and protein purification using platforms including the ADLib® system to major domestic pharmaceutical companies and academia.
At present, the drug discovery business does not record any net sales and is strongly characterized as a “cost center” that records R&D costs. In the Q3 FY12/2025 (cumulative), it recorded R&D expenses of 586 million yen, which directly translated into a segment loss of the same amount. For CBA-1205, in addition to the hepatocellular carcinoma and melanoma cohorts, the Company has begun a pediatric cancer cohort, and CBA-1535 is also continuing safety confirmation through stepwise dose escalation. However, these will only be monetized when out-licensing and the receipt of milestones are realized in the future. Accordingly, while this segment weighs on earnings in the short term, it functions as the source of medium- to long-term value creation.
The drug discovery support business is the Company’s core segment, supporting its net sales and cash flow. Net sales for the Q3 FY12/2025 (cumulative)were 369 million yen, accounting for 100% of consolidated net sales. Segment profit was 204 million yen, with a segment margin of around 55% on net sales, and it can be described as a “source of gross profit” that supports R&D investment. The customer base is centered on major domestic companies such as Ono Pharmaceutical, Chugai Pharmaceutical, and Nitto Boseki, and the Company is also acquiring new customers, securing a stable flow of projects while raising unit prices and adding value.
The IDD business and biosimilar-related initiatives are currently being run within the existing drug discovery and drug discovery support businesses in accounting terms. In the IDD business, the Company is promoting joint research-type collaborations with drug discovery startups and pharmaceutical companies, with the stated aims of addressing social issues, such as domestic biosimilar manufacturing, and contributing to Japan’s drug discovery ecosystem. Initiatives such as the total value chain concept for biosimilar development and manufacturing, and IDD collaborations are concrete project clusters under this umbrella. These have the potential to generate revenue on both the drug discovery and drug discovery support sides in the form of license fees and joint research income in the future.
From the above, the current earnings structure can be summarized as follows: “the drug discovery support business generates current net sales and profits at a high margin, while the drug discovery business and IDD/biosimilars are in an investment phase aimed at securing future milestones and royalties.” The clear complementary relationship between the segments is an essential factor for investors in terms of the business sustainability of a biotech venture.
◇ Forecast for FY12/2025: 500 million yen in drug discovery support sales is within reach, but expectations for company-wide profitability will have to wait for ‘loss reduction + events’
For FY12/2025, while the forecast of 500 million yen in net sales for the drug discovery support business is within reach, the timing of company-wide profitability remains difficult to foresee, and the situation can be summarized as “a phase of continuing to narrow losses while waiting for out-licensing and the occurrence of milestones.”
The Company does not disclose full-company earnings forecasts, citing the difficulty of forecasting in the drug discovery business. It only discloses a forecast of 500 million yen in net sales for the drug discovery support business. This policy is unchanged from the previous quarterly results, and it continues to maintain a medium-term stance of “stable revenue from drug discovery support plus option value from in-house drug discovery, IDD, and biosimilars.”
Net sales for the Q3 FY12/2025 (cumulative) were 369 million yen, all of which came from the drug discovery support business. The progress rate toward the full-year plan is about 74%, and the Company will meet its plan if it adds about 130 million yen in the fourth quarter. While net sales are down from 423 million yen in the same period of the previous year, the broadening of the customer base has been steadily progressing, including the expansion of the alliance with Merck and the signing of new basic agreements with Nitto Boseki and Mochida Pharmaceutical. The segment margin for the drug discovery support business was 55.2% for the Q3 FY12/2025 (cumulative), exceeding the target of 50%, and it is positive that the business has maintained a highly profitable structure.
Meanwhile, R&D expenses for the Q3 FY12/2025 (cumulative) decreased to 586 million yen from 743 million yen in the same period of the previous year, but still significantly exceeded net sales. Even if 500 million yen in net sales from drug discovery support is achieved, operating and bottom-line losses will likely continue unless upfront payments or milestone income arise from the drug discovery business. On the balance sheet side, the financial cushion is secured to some extent, with cash and deposits of 1.005 billion yen and an equity ratio of 80.7%, but the structure of ongoing cash consumption as development progresses remains unchanged. Attention should be paid to the fact that the timing of additional equity and new licenses is inseparable from the medium-term story.
The two axes of medium-term management are: (1) increasing the volume of early clinical data for CBA-1205 and CBA-1535 to maximize their out-licensing value, and (2) building a system in which stable revenue from the drug discovery support and IDD-type businesses autonomously finances R&D investment. For CBA-1205, in addition to a PR case in hepatocellular carcinoma and a long-term SD case in melanoma, the pediatric cancer cohort is progressing, and for CBA-1535, the Company is continuing to examine safety and T cell activation signals in the monotherapy part. These are positioned as investments that sacrifice short-term profits to increase the potential for large upfront payments from future out-licensing.
The biosimilar development and supply chain construction with Alfresa HD, Kidswell, and Mycenax, the IDD collaboration with Axcelead DDP, and the joint research on mRNA-encoded antibodies with NANO MRNA will have only a minor impact on current-year earnings, but they are initiatives that raise the option value for medium-term earnings. As a baseline, we see it as realistic to assume that the Company will maintain around 500 million yen in drug discovery support net sales and continue to narrow losses through cost optimization, while gradually adding revenue from these new businesses and lowering the breakeven point.
Risk factors include difficulties in out-licensing if efficacy signals in the clinical trials of CBA-1205 and CBA-1535 are weaker than expected, delays in biosimilar development and in projects to establish joint ventures, and a decline in projects from existing large customers in the drug discovery support business. Overall, the Company is still in the “dawn to early growth” phase, and FY12/2025 should not be regarded as a year of achieving profitability, but rather as a “seeding year” for securing future revenue options through CBA-1205/1535, IDD, and biosimilars, alongside firmly achieving 500 million yen in drug discovery support net sales. Investors need to monitor the level of drug discovery support, net sales, and margins, signs of upfront and milestone income from the pipeline and new alliances, and changes in the cash position and financing policy, and identify the timing of events that could lead to a medium-term redefinition of valuation.
From the standpoint of earnings forecasts, this is a phase in which the question should be “what scale and quality of revenue portfolio the Company can build,” rather than relying on identifying “the year of turning profitable.” If the achievement of 500 million yen in drug discovery support net sales and further loss reduction can be confirmed, financial risk will ease, but profit events such as pipeline out-licensing and milestones from biosimilars and IDD will be indispensable for a full-fledged re-rating of the share price. We believe that how much investors are willing to tolerate the long-term horizon and future dilution risk will be a practical axis for determining position size and entry points.
◇ Share price trend and points of focus going forward: events produce bursts of momentum, but the trading range continues; the “quality” and “profit contribution” of newsflow are conditions for the next re-rating
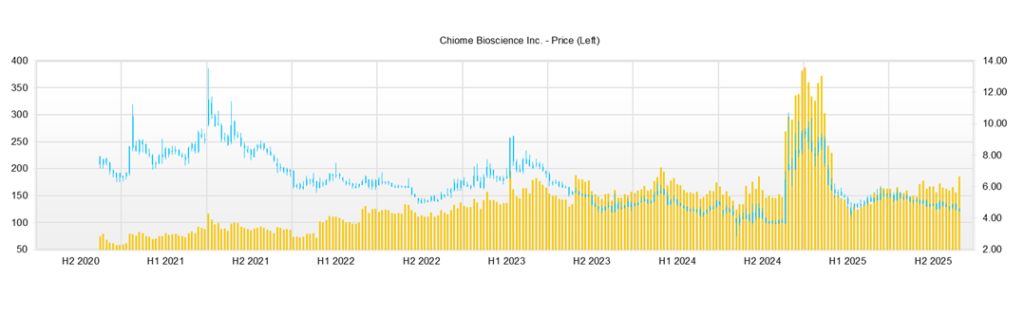
Over the past three months, the Company’s share price has traded in a box range between the high of 120 yen and the low of 140 yen. Although trading volume has increased on the announcements of alliances in areas such as NANO MRNA, biosimilars, and IDD, including the impact of results and special income, the market remains in a phase of “expectations are ahead of fundamentals, but the share price has yet to enter a full-fledged upward trend.” Reference indicators at present are a market capitalization of around 8.7 billion yen, actual PBR of 6.96x, ROE of −66.33%, beta of 1.23, and net cash of about 926 million yen, a profile typical of a biotech venture, with high PBR, significant losses, and relatively high volatility.
Looking at the specific share price level, the closing price as of November 11, 2025, was 135 yen, up only 2 yen (+1.5%) from the previous day, following the release on the same day of the third quarter financial results summary and the notice of recognition of special income. The closing price range over the past three months has been 123–142 yen, with the share price around 140 yen in early August, 128 yen at the end of October, and recently at 130 yen, indicating a continuing back-and-forth within the range. On a year-to-date basis, the high was 294 yen (January 15) and the low was 111 yen (April 7), and the current level is slightly below the midpoint of this range.
When we match the share price movements with events during this period, we can confirm that sensitivity to news is high. Around the disclosure on August 27 of the joint research agreement with NANO MRNA for the creation of mRNA-encoded antibody drugs, trading volume surged to over 1 million shares in the high 130 yen to low 140 yen range, suggesting inflows of short-term funds. At the timing of the October 6 disclosure of the basic agreement on joint development of biosimilars and the establishment of a joint venture company with Alfresa HD, Kidswell, and Mycenax, and the October 7 disclosure of the business alliance agreement for the IDD business with Axcelead DDP, the share price experienced sharp volatility accompanied by significant trading, with a high of 142 yen, a low of 128 yen, and trading volume of about 3.26 million shares, confirming a supply–demand structure that tends to overshoot in response to newsflow.
By contrast, the third quarter financial results summary released on November 11 and the recognition of special income (reversal of stock options of 9,588 thousand yen) resulted in only a small positive share price reaction, reflecting the fact that, in addition to lower net sales and narrower losses, the scale of the special income was limited. The structure is such that the market’s attention tends to focus more on “future potential,” such as mRNA, IDD, and biosimilars, than on “actual contributions,” such as results and special income.
On the supply–demand side, as of November 12, 2025, the combined holdings of insiders and major investors amount to only 9.05% of the total number of shares issued, with individual shareholders, mainly management and related parties, holding dispersed stakes, including 2.04% by the largest shareholder Mr. Yasuhiro Ogawa, 1.62% by Mr. Kenji Watanabe, and 1.41% by Mr. Kunifumi Ota. Among institutional investors, Simplex Asset Management holds 0.30%, giving it only a limited presence, and, as noted in the previous report, the structure in which the significant free float results in high price elasticity to events persists. The beta of around 1.2 is also higher than the market average, and this stock tends to fluctuate more than the index in the short term, depending on newsflow.
From a technical perspective, the area around 140 yen in early August and near 142 yen in early October is recognized as an upper resistance band, while the 128 yen level at the end of October is acting as a temporary support. Currently, the share price is consolidating in the low 130 yen range, and the pattern can also be interpreted as a converging triangle. To break out of the range to the upside, “profit events” will likely be required, such as updates to the clinical data for CBA-1205 and CBA-1535, or concrete realization of upfront or milestone income from mRNA-encoded antibodies, IDD, or biosimilars. Conversely, suppose development delays or additional equity financings materialize. In that case, investors should also envisage a risk scenario in which the share price tests the year-to-date low zone (the low 100 yen level).
Points of focus going forward include: (1) the progress of the Phase 1 studies of CBA-1205 and CBA-1535 and their out-licensing potential; (2) additional IR and concretization of monetization schemes from IDD and biosimilar projects including those with NANO MRNA, Axcelead, and the Alfresa group; (3) confirmation of the trend toward loss reduction through achieving 500 million yen in drug discovery support net sales and maintaining margins; and (4) movements in capital policy (the exercise status of stock options and any new equity financings). If these factors align positively, the share price could break significantly higher out of the range in an event-driven manner, supported by the wide free float and high beta.
From a share price perspective, it is reasonable to summarize the current situation as “a range-bound market that has already priced in high PBR, while waiting for decisive profit events.” The range is not being broken by earnings announcements alone, and the current pattern is one in which short-term money reacts to highly thematic news topics such as mRNA, IDD, and biosimilars. Accordingly, in terms of investment stance, a practical approach will be to build positions in an “event-driven” manner, monitoring (1) the steady operation of drug discovery support and confirmation of loss reduction, (2) concrete profit contributions from pipeline out-licensing, milestones, and joint ventures, and (3) the presence and scale of equity financings, and aiming for a breakout above the upper end of the range when events occur.
Company profile
◇ A “dual-track” biotech venture that combines upstream antibody drug discovery capabilities with drug discovery support and IDD
Chiome Bioscience Inc. is a biotech venture building a revenue model focused on upstream R&D processes, combining antibody drug discovery at its core with drug discovery support and IDD (Integrated Drug Discovery) businesses. Its mission is “Shedding light on unmet medical needs through drug discovery,” and it mainly targets disease areas with limited treatment options, such as refractory cancers.
As for its technological base, the Company’s strengths lie in its ability to generate human antibodies quickly using the ADLib® system and in its Tribody® technology, which can design multispecific antibodies with three distinct antigen-binding sites in a single molecule. It is also characterized by its ability, with a small team, to handle an integrated process extending from protein preparation and antibody engineering through nonclinical studies, CMC, and clinical operations. In addition, it is advancing the development of DoppeLib™, a high-throughput screening technology for bispecific antibodies, to expand its responsiveness to next-generation modalities.
Key financial data
| Unit: million yen | 2020/12 | 2021/12 | 2022/12 | 2023/12 | 2024/12 | 2025/12CE |
| Sales | 481 | 713 | 631 | 682 | 781 | NA |
| EBIT (Operating Income) | -1,284 | -1,334 | -1,259 | -1,205 | -1,031 | NA |
| Pretax Income | -1,291 | -1,466 | -1,238 | -1,215 | -1,018 | NA |
| Net Profit Attributable to Owner of Parent | -1,294 | -1,480 | -1,243 | -1,220 | -1,021 | NA |
| Cash & Short-Term Investments | 2,686 | 1,791 | 1,727 | 1,326 | 2,063 | |
| Total assets | 3,495 | 2,339 | 2,215 | 1,751 | 2,469 | |
| Total Debt | 291 | 291 | 291 | 291 | 282 | |
| Net Debt | -1,035 | -1,035 | -1,035 | -1,035 | -1,782 | |
| Total liabilities | 385 | 446 | 425 | 594 | 549 | |
| Total Shareholders’ Equity | 1,158 | 1,158 | 1,158 | 1,158 | 1,920 | |
| Net Operating Cash Flow | -1,360 | -1,131 | -1,191 | -1,069 | -1,001 | |
| Capital Expenditure | 0 | 0 | 0 | 0 | 0 | |
| Net Investing Cash Flow | -4 | -35 | 0 | 0 | 0 | |
| Net Financing Cash Flow | 1,944 | 271 | 1,127 | 667 | 1,738 | |
| ROA (%) | -41.06 | -50.73 | -54.57 | -61.51 | -48.37 | |
| ROE (%) | -45.15 | -59.16 | -67.48 | -82.76 | -66.33 | |
| EPS (Yen) | -36.1 | -36.7 | -28.3 | -24.6 | -17.5 | |
| BPS (Yen) | 78.7 | 46.4 | 37.0 | 22.0 | 28.7 | |
| Dividend per Share (Yen) | 0.00 | 0.00 | 0.00 | 0.00 | 0.00 | |
| Shares Outstanding (Million shares) | 58.28 | 58.28 | 58.28 | 58.28 | 66.97 |
Source: Omega Investment from company data, rounded to the nearest whole number.
Share price
Key stock price data
Financial data (quarterly basis)
| Unit: million yen | 2023/12 | 2024/12 | 2025/12 | ||||||
| 3Q | 4Q | 1Q | 2Q | 3Q | 4Q | 1Q | 2Q | 3Q | |
| (Income Statement) | |||||||||
| Sales | 165 | 158 | 130 | 134 | 159 | 358 | 139 | 113 | 118 |
| Year-on-year | 6.2% | -19.6% | -23.5% | -29.2% | -3.8% | 126.1% | 7.0% | -15.7% | -25.7% |
| Cost of Goods Sold (COGS) | 67 | 67 | 73 | 56 | 74 | 145 | 58 | 55 | 53 |
| Gross Income | 98 | 92 | 57 | 78 | 85 | 213 | 81 | 58 | 65 |
| Gross Income Margin | 59.6% | 57.8% | 44.0% | 58.0% | 53.4% | 59.5% | 58.1% | 51.5% | 55.3% |
| SG&A Expense | 344 | 391 | 379 | 337 | 425 | 323 | 345 | 330 | 334 |
| EBIT (Operating Income) | -246 | -300 | -322 | -259 | -340 | -110 | -265 | -272 | -269 |
| Year-on-year | -5.4% | 36.7% | 42.6% | -40.2% | 38.1% | -63.3% | -17.9% | 5.1% | -21.0% |
| Operating Income Margin | -149.0% | -189.3% | -248.5% | -193.1% | -213.9% | -30.7% | -190.7% | -240.7% | -227.5% |
| EBITDA | -246 | -300 | -322 | -259 | -340 | -110 | -265 | -272 | -267 |
| Pretax Income | -254 | -300 | -303 | -259 | -351 | -105 | -265 | -273 | -259 |
| Consolidated Net Income | -255 | -302 | -304 | -260 | -352 | -105 | -266 | -274 | -260 |
| Minority Interest | 0 | 0 | 0 | 0 | 0 | 0 | 0 | 0 | 0 |
| Net Income ATOP | -255 | -302 | -304 | -260 | -352 | -105 | -266 | -274 | -260 |
| Year-on-year | -0.7% | 40.1% | 33.5% | -40.4% | 38.0% | -65.1% | -12.5% | 5.5% | -26.1% |
| Net Income Margin | -154.3% | -190.3% | -234.5% | -193.9% | -221.2% | -29.4% | -191.8% | -242.5% | -220.3% |
| (Balance Sheet) | |||||||||
| Cash & Short-Term Investments | 1,342 | 1,326 | 1,325 | 1,104 | 1,241 | 2,063 | 1,819 | 1,475 | 1,006 |
| Total assets | 1,753 | 1,751 | 1,754 | 1,557 | 1,694 | 2,469 | 2,205 | 1,963 | 1,549 |
| Total Debt | 316 | 291 | 314 | 292 | 303 | 282 | 282 | 261 | 79 |
| Net Debt | -1,026 | -1,035 | -1,012 | -812 | -938 | -1,782 | -1,537 | -1,214 | -926 |
| Total liabilities | 542 | 594 | 506 | 487 | 478 | 549 | 443 | 443 | 299 |
| Total Shareholders’ Equity | 1,211 | 1,158 | 1,248 | 1,071 | 1,216 | 1,920 | 1,761 | 1,519 | 1,250 |
| (Profitability %) | |||||||||
| ROA | -59.13 | -61.51 | -67.53 | -69.09 | -70.61 | -48.37 | -49.66 | -56.65 | -55.84 |
| ROE | -79.25 | -82.76 | -92.28 | -101.15 | -100.30 | -66.33 | -65.33 | -77.00 | -73.45 |
| (Per-share) Unit: JPY | |||||||||
| EPS | -5.2 | -5.8 | -5.6 | -4.6 | -6.1 | -1.7 | -3.9 | -4.0 | -3.8 |
| BPS | 23.9 | 22.0 | 22.4 | 19.0 | 19.9 | 28.7 | 26.0 | 22.3 | 18.4 |
| Dividend per Share | 0.00 | 0.00 | 0.00 | 0.00 | 0.00 | 0.00 | 0.00 | 0.00 | #N/A |
| Shares Outstanding(million shares) | 50.01 | 52.19 | 55.40 | 56.39 | 61.24 | 66.97 | 67.77 | 68.05 | 68.05 |
Source: Omega Investment from company materials
Financial data (full-year basis)
| Unit: million yen | 2015/12 | 2016/12 | 2017/12 | 2018/12 | 2019/12 | 2020/12 | 2021/12 | 2022/12 | 2023/12 | 2024/12 |
| (Income Statement) | ||||||||||
| Sales | 280 | 252 | 260 | 213 | 448 | 481 | 713 | 631 | 682 | 781 |
| Year-on-year | -24.4% | -10.0% | 3.0% | -18.1% | 110.3% | 7.4% | 48.3% | -11.5% | 8.2% | 14.4% |
| Cost of Goods Sold | 225 | 228 | 94 | 107 | 167 | 238 | 292 | 283 | 285 | 348 |
| Gross Income | 55 | 25 | 166 | 106 | 281 | 243 | 421 | 348 | 398 | 433 |
| Gross Income Margin | 19.8% | 9.7% | 64.0% | 49.6% | 62.7% | 50.5% | 59.0% | 55.1% | 58.3% | 55.4% |
| SG&A Expense | 1,325 | 1,067 | 1,054 | 1,645 | 1,683 | 1,526 | 1,755 | 1,606 | 1,603 | 1,464 |
| EBIT (Operating Income) | -1,270 | -1,042 | -888 | -1,539 | -1,402 | -1,284 | -1,334 | -1,259 | -1,205 | -1,031 |
| Year-on-year | 10.0% | -17.9% | -14.8% | 73.4% | -8.9% | -8.4% | 3.9% | -5.7% | -4.2% | -14.5% |
| Operating Income Margin | -453.4% | -413.3% | -341.6% | -723.1% | -313.2% | -266.9% | -187.2% | -199.5% | -176.6% | -132.0% |
| EBITDA | -1,168 | -929 | -877 | -1,532 | -1,397 | -1,280 | -1,331 | -1,257 | -1,204 | -1,030 |
| Pretax Income | -1,281 | -1,501 | -880 | -1,531 | -1,401 | -1,291 | -1,466 | -1,238 | -1,215 | -1,018 |
| Consolidated Net Income | -1,283 | -1,491 | -883 | -1,534 | -1,404 | -1,294 | -1,480 | -1,243 | -1,220 | -1,021 |
| Minority Interest | 0 | 0 | 0 | 0 | 0 | 0 | 0 | 0 | 0 | 0 |
| Net Income ATOP | -1,283 | -1,491 | -883 | -1,534 | -1,404 | -1,294 | -1,480 | -1,243 | -1,220 | -1,021 |
| Year-on-year | 11.5% | 16.3% | -40.8% | 73.8% | -8.5% | -7.8% | 14.4% | -16.0% | -1.8% | -16.3% |
| Net Income Margin | -457.9% | -591.2% | -339.6% | -720.5% | -313.6% | -269.1% | -207.6% | -197.0% | -178.8% | -130.7% |
| (Balance Sheet) | ||||||||||
| Cash & Short-Term Investments | 4,100 | 4,553 | 4,027 | 2,329 | 2,106 | 2,686 | 1,791 | 1,727 | 1,326 | 2,063 |
| Total assets | 4,919 | 4,789 | 4,419 | 2,831 | 2,808 | 3,495 | 2,339 | 2,215 | 1,751 | 2,469 |
| Total Debt | 100 | 54 | 4 | 0 | 0 | 180 | 183 | 184 | 291 | 282 |
| Net Debt | -4,000 | -4,499 | -4,023 | -2,329 | -2,106 | -2,506 | -1,608 | -1,543 | -1,035 | -1,782 |
| Total liabilities | 355 | 224 | 202 | 154 | 187 | 385 | 446 | 425 | 594 | 549 |
| Total Shareholders’ Equity | 4,564 | 4,565 | 4,218 | 2,677 | 2,622 | 3,110 | 1,893 | 1,791 | 1,158 | 1,920 |
| (Cash Flow) | ||||||||||
| Net Operating Cash Flow | -1,245 | -970 | -867 | -1,689 | -1,537 | -1,360 | -1,131 | -1,191 | -1,069 | -1,001 |
| Capital Expenditure | 168 | 11 | 5 | 0 | 0 | 0 | 0 | 0 | 0 | 0 |
| Net Investing Cash Flow | -1,780 | 1,989 | -137 | 0 | -26 | -4 | -35 | 0 | 0 | 0 |
| Net Financing Cash Flow | 124 | 1,434 | 479 | -10 | 1,341 | 1,944 | 271 | 1,127 | 667 | 1,738 |
| (Profitability %) | ||||||||||
| ROA | -22.95 | -30.72 | -19.17 | -42.30 | -49.79 | -41.06 | -50.73 | -54.57 | -61.51 | -48.37 |
| ROE | -24.69 | -32.67 | -20.10 | -44.49 | -52.99 | -45.15 | -59.16 | -67.48 | -82.76 | -66.33 |
| (Per-share) Unit: JPY | ||||||||||
| EPS | -58.3 | -65.9 | -33.5 | -57.3 | -44.6 | -36.1 | -36.7 | -28.3 | -24.6 | -17.5 |
| BPS | 207.0 | 179.3 | 157.5 | 99.9 | 78.8 | 78.7 | 46.4 | 37.0 | 22.0 | 28.7 |
| Dividend per Share | 0.00 | 0.00 | 0.00 | 0.00 | 0.00 | 0.00 | 0.00 | 0.00 | 0.00 | 0.00 |
| Shares Outstanding (million shares) | 22.05 | 25.31 | 26.78 | 26.78 | 33.28 | 39.51 | 40.31 | 48.42 | 52.19 | 66.97 |
Source: Omega Investment from company materials