2026-06-26
Home
Japanese

Omega Investment Co., Ltd.
Cosmo Bio (Company note – 3Q update)

| Share price (12/2) | ¥1,390 | Dividend Yield (25/12 CE) | 3.6 % |
| 52weeks high/low | ¥1,486/971 | ROE(24/12) | 3.0 % |
| Avg Vol (3 month) | 40.5 thou shrs | Operating margin (24/12) | 3.2 % |
| Market Cap | ¥8.41 bn | Beta (5Y Monthly) | 0.1 |
| Enterprise Value | ¥4.72 bn | Shares Outstanding | 6.048 mn shrs |
| PER (25/12 CE) | 18.4 X | Listed market | TSE Standard |
| PBR (24/12 act) | 0.9 X |
| Click here for the PDF version of this page |
| PDF version |
3Q cumulative results showed an increase in revenue but higher expenses. The potential for commercial deployment of the chicken egg bioreactor was demonstrated, and this is a phase in which expectations for medium-term growth are being fostered.
◇ 3Q FY12/2025 financial results highlights
Cosmo Bio’s 3Q FY12/2025 financial results, announced on November 7, 2025, showed a year-on-year increase in cumulative net sales, but operating profit, ordinary profit, and quarterly net income attributable to owners of the parent decreased slightly.
Specifically, net sales were 7.88 billion yen (up 6% YoY), operating profit was 0.27 billion yen (down 25% YoY), ordinary profit was 0.36 billion yen (down 4% YoY), and quarterly net income attributable to owners of the parent was 0.27 billion yen (down 6% YoY). The exchange rate was 148 yen/USD, representing a 2-yen appreciation of the yen YoY.
Net sales were strong across the core Research reagents (6.36 billion yen, up 8% YoY) and Equipment (1.51 billion yen, slightly up YoY). Furthermore, the gross profit margin was 34.7% (up 1.3 percentage points YoY), and gross profit (2.73 billion yen, up 10% YoY) increased steadily. This is positive.
On the other hand, increases in personnel expenses for strategic purposes and office expansion costs associated with higher headcount constrained the growth of operating profit and ordinary profit.
◇ Full-year earnings forecasts for FY12/2025
The company left its full-year earnings forecasts unchanged from the initial figures. For the second half, it assumes a USD/JPY exchange rate of 152 yen/USD and forecasts net sales of 10.7 billion yen (up 6% YoY), operating profit of 0.49 billion yen (up 53% YoY), ordinary profit of 0.58 billion yen (up 59% YoY), and net income attributable to owners of the parent of 0.43 billion yen (up 64% YoY). The full-year dividend per share of 50 yen was also left unchanged.
Progress through the third quarter is within the expected range. However, to achieve full-year earnings targets, it is necessary to post solid profits in the fourth quarter.
◇ Successful development and manufacturing of the sweet protein “brazzein” using the chicken egg bioreactor
On November 13, 2025, the company announced that it had successfully developed and manufactured the sweet protein “brazzein” using the chicken egg bioreactor. Brazzein is said to be in the process of accelerated commercialization as a next-generation natural sweetener that fits with health consciousness, and its global market is expected to expand from 120 million U.S. dollars in 2024 to 350 million U.S. dollars in 2033.
In contrast, the company’s “chicken egg bioreactor” technology is expected to enable low-cost, mass production, and this announcement is an important step forward toward commercial production. It is attracting attention as a case that demonstrates the potential of the company’s value-added businesses.
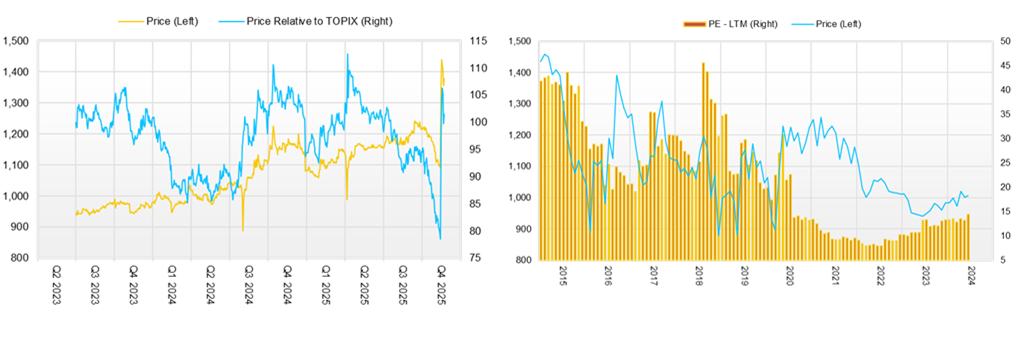
◇ Stock price trend and points of focus going forward
The company’s stock price trended gradually higher from July through September 2024, rising to a level approaching 1,250 yen, but then declined amid a trend of yen depreciation and temporarily fell below 1,100 yen after the announcement of the current financial results.
However, after the disclosure regarding the chicken egg bioreactor mentioned above, the stock price surged and has been trading above 1,400 yen. This is evidence that the stock market is eagerly awaiting the company’s transformation from an import trading company into a global trading company with manufacturing functions.
In the near term, points of focus will likely be the trend in the USD/JPY exchange rate, which determines import costs, the achievement of the full-year earnings forecasts, and the outlook for the earnings forecasts for the new fiscal year.
However, given the current valuation (a forecast PER of 18.9x, a PBR of 0.9x, and a forecast dividend yield of 3.2%), factors that lead to ROE of 8% and PBR above 1x are more critical. Specifically, these include the globalization of trading company functions, improvements in labor productivity through the promotion of DX, the ramp-up of Scientist3, a contract service-matching service, and the development of value-added businesses such as the chicken egg bioreactor business and the peptide manufacturing business. If a new medium-term plan is announced, attention is expected to increase.
Company profile
Cosmo Bio Co., Ltd. is a bio-focused trading company that upholds the objective of “contributing to the advancement of life sciences.” It is one of the major providers of reagents for life science research, supplying as many as 12 million items from about 500 manufacturers worldwide. In recent years, it has expanded globally, advancing the functions of trading companies, launching its own contract services, and entering proprietary manufacturing and sales businesses. Expectations are placed on these to contribute to earnings, improve capital efficiency, and raise PBR.
Key financial data
| Unit: million yen | 2020/12 | 2021/12 | 2022/12 | 2023/12 | 2024/12 | 2025/12 CE |
| Sales | 8,092 | 9,231 | 9,553 | 9,340 | 10,037 | 10,700 |
| EBIT (Operating Income) | 753 | 1,050 | 817 | 521 | 319 | 490 |
| Pretax Income | 1,008 | 1,099 | 790 | 653 | 369 | 580 |
| Net Profit Attributable to Owner of Parent | 674 | 737 | 517 | 442 | 262 | 430 |
| Cash & Short-Term Investments | 3,259 | 3,555 | 3,036 | 3,025 | 2,693 | |
| Total assets | 9,640 | 10,072 | 10,313 | 10,872 | 11,723 | |
| Total Debt | 20 | 28 | 27 | 25 | 23 | |
| Net Debt | -3,239 | -3,527 | -3,009 | -3,000 | -2,670 | |
| Total liabilities | 1,776 | 1,750 | 1,693 | 1,844 | 2,166 | |
| Total Shareholders’ Equity | 7,358 | 7,787 | 8,052 | 8,445 | 8,968 | |
| Net Operating Cash Flow | 803 | 648 | 306 | 744 | 241 | |
| Capital Expenditure | 76 | 156 | 119 | 120 | 319 | |
| Net Investing Cash Flow | 42 | -145 | -313 | -766 | -217 | |
| Net Financing Cash Flow | -97 | -420 | -236 | -201 | -479 | |
| Free Cash Flow | 767 | 617 | 251 | 677 | 25 | |
| ROA (%) | 7.27 | 7.48 | 5.07 | 4.17 | 2.32 | |
| ROE (%) | 9.49 | 9.73 | 6.53 | 5.36 | 3.01 | |
| EPS (Yen) | 113.7 | 126.9 | 89.1 | 75.8 | 45.0 | 75.5 |
| BPS (Yen) | 1,241.2 | 1,344.5 | 1,385.1 | 1,447.2 | 1,565.0 | |
| Dividend per Share (Yen) | 34.00 | 36.00 | 36.00 | 30.00 | 50.00 | 50.00 |
| Shares Outstanding (Million shrs) | 6.05 | 6.05 | 6.05 | 6.05 | 6.05 |
Source: Omega Investment from company data, rounded to the nearest whole number.
Share price
Financial data (quarterly basis)
| Unit: million yen | 2023/12 | 2024/12 | 2025/12 | ||||||
| 3Q | 4Q | 1Q | 2Q | 3Q | 4Q | 1Q | 2Q | 3Q | |
| (Income Statement) | |||||||||
| Sales | 2,050 | 2,463 | 2,943 | 2,186 | 2,280 | 2,628 | 3,093 | 2,309 | 2,483 |
| Year-on-year | 1.7% | 1.5% | 4.1% | 9.4% | 11.2% | 6.7% | 5.1% | 5.6% | 8.9% |
| Cost of Goods Sold (COGS) | 1,350 | 1,678 | 1,956 | 1,460 | 1,522 | 1,770 | 2,034 | 1,502 | 1,612 |
| Gross Income | 700 | 785 | 987 | 726 | 758 | 858 | 1,059 | 807 | 871 |
| Gross Income Margin | 34.1% | 31.9% | 33.5% | 33.2% | 33.2% | 32.6% | 34.2% | 35.0% | 35.1% |
| SG&A Expense | 711 | 712 | 681 | 708 | 713 | 908 | 785 | 805 | 871 |
| EBIT (Operating Income) | -11 | 73 | 306 | 18 | 45 | -50 | 274 | 2 | 0 |
| Year-on-year | -114.5% | -36.0% | -23.7% | -69.0% | -509.1% | -168.5% | -10.5% | -88.9% | -100.0% |
| Operating Income Margin | -0.5% | 3.0% | 10.4% | 0.8% | 2.0% | -1.9% | 8.9% | 0.1% | 0.0% |
| EBITDA | 28 | 112 | 336 | 50 | 79 | -10 | 308 | 40 | 41 |
| Pretax Income | 2 | 99 | 353 | 37 | 48 | -69 | 321 | 50 | 26 |
| Consolidated Net Income | 1 | 83 | 240 | 27 | 34 | -32 | 220 | 35 | 22 |
| Minority Interest | -5 | 8 | 10 | -2 | 2 | -3 | 7 | -2 | -1 |
| Net Income ATOP | 5 | 76 | 230 | 28 | 33 | -29 | 212 | 38 | 22 |
| Year-on-year | -89.4% | 20.6% | -12.9% | -71.1% | 560.0% | -138.2% | -7.8% | 35.7% | -33.3% |
| Net Income Margin | 0.2% | 3.1% | 7.8% | 1.3% | 1.4% | -1.1% | 6.9% | 1.6% | 0.9% |
| (Balance Sheet) | |||||||||
| Cash & Short-Term Investments | 3,637 | 3,025 | 2,813 | 3,224 | 3,044 | 2,693 | 2,497 | 3,192 | 3,192 |
| Total assets | 10,773 | 10,872 | 11,594 | 11,739 | 11,333 | 11,723 | 11,516 | 11,790 | 12,266 |
| Total Debt | 219 | 25 | 316 | 418 | 370 | 23 | 345 | 490 | 667 |
| Net Debt | -3,418 | -3,000 | -2,497 | -2,806 | -2,674 | -2,670 | -2,152 | -2,702 | -2,525 |
| Total liabilities | 1,772 | 1,844 | 2,101 | 1,953 | 1,853 | 2,166 | 2,160 | 2,114 | 2,396 |
| Total Shareholders’ Equity | 8,426 | 8,445 | 8,903 | 9,197 | 8,889 | 8,968 | 8,763 | 9,084 | 9,279 |
| (Profitability %) | |||||||||
| ROA | 4.12 | 4.17 | 3.66 | 3.01 | 3.31 | 2.32 | 2.12 | 2.15 | 2.07 |
| ROE | 5.24 | 5.36 | 4.76 | 3.84 | 4.23 | 3.01 | 2.77 | 2.77 | 2.69 |
| (Per-share) Unit: JPY | |||||||||
| EPS | 0.9 | 13.0 | 39.4 | 4.8 | 5.7 | -5.1 | 37.1 | 6.7 | 3.9 |
| BPS | 1,443.9 | 1,447.2 | 1,525.8 | 1,569.7 | 1,532.0 | 1,565.0 | 1,536.8 | 1,597.1 | 1,635.1 |
| Dividend per Share | 0.00 | 16.00 | 0.00 | 14.00 | 0.00 | 36.00 | 0.00 | 25.00 | 0.00 |
| Shares Outstanding(million shrs) | 6.05 | 6.05 | 6.05 | 6.05 | 6.05 | 6.05 | 6.05 | 6.05 | 6.05 |
Source: Omega Investment from company materials
Financial data (full-year basis)
| Unit: million yen | 2015/12 | 2016/12 | 2017/12 | 2018/12 | 2019/12 | 2020/12 | 2021/12 | 2022/12 | 2023/12 | 2024/12 |
| (Income Statement) | ||||||||||
| Sales | 7,357 | 7,427 | 7,068 | 7,261 | 7,590 | 8,092 | 9,231 | 9,553 | 9,340 | 10,037 |
| Year-on-year | 1.7% | 1.0% | -4.8% | 2.7% | 4.5% | 6.6% | 14.1% | 3.5% | -2.2% | 7.5% |
| Cost of Goods Sold | 4,976 | 4,655 | 4,535 | 4,607 | 4,710 | 4,940 | 5,572 | 6,112 | 6,090 | 6,708 |
| Gross Income | 2,381 | 2,772 | 2,533 | 2,654 | 2,880 | 3,152 | 3,659 | 3,441 | 3,250 | 3,329 |
| Gross Income Margin | 32.4% | 37.3% | 35.8% | 36.6% | 37.9% | 39.0% | 39.6% | 36.0% | 34.8% | 33.2% |
| SG&A Expense | 2,181 | 2,257 | 2,339 | 2,330 | 2,474 | 2,399 | 2,609 | 2,624 | 2,729 | 3,010 |
| EBIT (Operating Income) | 200 | 515 | 194 | 324 | 406 | 753 | 1,050 | 817 | 521 | 319 |
| Year-on-year | 23.5% | 157.5% | -62.3% | 67.0% | 25.3% | 85.5% | 39.4% | -22.2% | -36.2% | -38.8% |
| Operating Income Margin | 2.7% | 6.9% | 2.7% | 4.5% | 5.3% | 9.3% | 11.4% | 8.6% | 5.6% | 3.2% |
| EBITDA | 279 | 600 | 350 | 507 | 613 | 928 | 1,216 | 958 | 669 | 455 |
| Pretax Income | 407 | 456 | 400 | 403 | 388 | 1,008 | 1,099 | 790 | 653 | 369 |
| Consolidated Net Income | 249 | 276 | 250 | 278 | 246 | 701 | 768 | 552 | 461 | 269 |
| Minority Interest | 19 | 22 | 12 | 17 | 8 | 27 | 31 | 35 | 19 | 7 |
| Net Income ATOP | 230 | 254 | 237 | 260 | 237 | 674 | 737 | 517 | 442 | 262 |
| Year-on-year | 14.4% | 10.4% | -6.7% | 9.7% | -8.8% | 184.4% | 9.3% | -29.9% | -14.5% | -40.7% |
| Net Income Margin | 3.1% | 3.4% | 3.4% | 3.6% | 3.1% | 8.3% | 8.0% | 5.4% | 4.7% | 2.6% |
| (Balance Sheet) | ||||||||||
| Cash & Short-Term Investments | 1,498 | 1,948 | 1,483 | 2,268 | 2,516 | 3,259 | 3,555 | 3,036 | 3,025 | 2,693 |
| Total assets | 7,790 | 7,934 | 8,126 | 8,501 | 8,890 | 9,640 | 10,072 | 10,313 | 10,872 | 11,723 |
| Total Debt | 20 | 20 | 20 | 20 | 20 | 20 | 28 | 27 | 25 | 23 |
| Net Debt | -1,478 | -1,928 | -1,463 | -2,248 | -2,496 | -3,239 | -3,527 | -3,009 | -3,000 | -2,670 |
| Total liabilities | 1,412 | 1,350 | 1,286 | 1,445 | 1,566 | 1,776 | 1,750 | 1,693 | 1,844 | 2,166 |
| Total Shareholders’ Equity | 5,951 | 6,135 | 6,381 | 6,581 | 6,843 | 7,358 | 7,787 | 8,052 | 8,445 | 8,968 |
| (Cash Flow) | ||||||||||
| Net Operating Cash Flow | 129 | 573 | 294 | 909 | 569 | 803 | 648 | 306 | 744 | 241 |
| Capital Expenditure | 175 | 252 | 546 | 152 | 171 | 76 | 156 | 119 | 120 | 319 |
| Net Investing Cash Flow | -263 | 99 | -440 | -186 | -135 | 42 | -145 | -313 | -766 | -217 |
| Net Financing Cash Flow | -151 | -107 | -109 | -85 | -85 | -97 | -420 | -236 | -201 | -479 |
| Free Cash Flow | 80 | 444 | -185 | 858 | 428 | 767 | 617 | 251 | 677 | 25 |
| (Profitability %) | ||||||||||
| ROA | 2.88 | 3.23 | 2.96 | 3.14 | 2.74 | 7.27 | 7.48 | 5.07 | 4.17 | 2.32 |
| ROE | 3.83 | 4.20 | 3.80 | 4.03 | 3.55 | 9.49 | 9.73 | 6.53 | 5.36 | 3.01 |
| Net profit margin | 3.13 | 3.42 | 3.37 | 3.59 | 3.14 | 8.33 | 7.98 | 5.41 | 4.73 | 2.61 |
| Asset turnover ratio | 0.92 | 0.94 | 0.88 | 0.87 | 0.87 | 0.87 | 0.94 | 0.94 | 0.88 | 0.89 |
| Financial leverage | 1.33 | 1.30 | 1.28 | 1.28 | 1.30 | 1.30 | 1.30 | 1.29 | 1.28 | 1.30 |
| (Per-share) Unit: JPY | ||||||||||
| EPS | 38.8 | 42.8 | 40.0 | 43.9 | 40.0 | 113.7 | 126.9 | 89.1 | 75.8 | 45.0 |
| BPS | 1,003.9 | 1,034.9 | 1,076.4 | 1,110.2 | 1,154.4 | 1,241.2 | 1,344.5 | 1,385.1 | 1,447.2 | 1,565.0 |
| Dividend per Share | 16.00 | 18.00 | 14.00 | 14.00 | 14.00 | 34.00 | 36.00 | 36.00 | 30.00 | 50.00 |
| Shares Outstanding (million shares) | 6.05 | 6.05 | 6.05 | 6.05 | 6.05 | 6.05 | 6.05 | 6.05 | 6.05 | 6.05 |
Source: Omega Investment from company materials