2026-07-27
Home
Japanese

Omega Investment Co., Ltd.
CNS (Investment report – 2Q update)
| Share price (1/21) | ¥1,725 | Dividend Yield (26/5 CE) | 2.9 % |
| 52weeks high/low | ¥1,294/1,920 | ROE(25/5) | 11.2 % |
| Avg Vol (3 month) | 2.6 thou shrs | Operating margin (TTM) | 7.9 % |
| Market Cap | ¥5.01 bn | Beta (5Y Monthly) | 0.51 |
| Enterprise Value | ¥1.45 bn | Shares Outstanding | 2.906 mn shrs |
| PER (26/5 CE) | 10.4 X | Listed market | TSE Growth |
| PBR (25/5 act) | 1.3 X |
| Click here for the PDF version of this page |
| PDF version |
The upward earnings revision provides a catalyst for a reassessment of the share price. Clarification of capital allocation is the next focus.
Investment conclusion
The upward revision expands the scope for revaluation. The next focus is for management to make the capital allocation policy more concrete.
CNS Co., Ltd. (hereinafter, “CNS”) has ample net cash, and the shares remain, as in the previous view, clearly undervalued. In 2Q (interim period) of FY2026/5, CNS continued higher net sales and higher profits, with net sales of 3.753 billion yen (+11.6% YoY) and operating profit of 350 million yen (+55.0% YoY, operating margin 9.3%), and the company upwardly revised its full-year operating profit forecast to 658 million yen.
Two points should be noted from these financial results. First, the “structural improvement in the gross margin due to improvement in the order mix,” which was emphasized previously, was also confirmed in the interim period. The gross margin rose to 25.4%, and the increase in gross profit absorbed increases in office relocation-related expenses, etc., expanding operating profit. Second, the background to the upward revision was not an upside in net sales but rather margin factors such as an increase in the number of projects, improvement in unit prices, and a higher ratio of highly profitable projects, as well as SG&A control through an underachievement in acquiring advanced human resources and a review of head office relocation expenses; this is content that allows the sustainability of an improved earnings structure to be evaluated, not merely a short-term improvement in business performance.
The sources of the company’s corporate value are, as organized to date, (1) technological assets spanning OCI/ERP, ServiceNow, and data/AI, (2) agile human resource development, (3) a diverse project portfolio, and (4) a robust financial structure. In addition, through an MOU in the DX and AI domain with NTQ Solution, the company aims to build an offshore development structure with advanced human resources in ServiceNow, AI, ERP, Cloud, etc., and to ease supply constraints and enhance project execution capability. No new disclosure regarding the capital allocation policy, such as enhanced shareholder returns or share buybacks, can be confirmed from this set of earnings-related materials, and decisive factors for a share-price rerating remain limited.
The company is in the early stages of laying the groundwork for an expansion. Meanwhile, considering the financial position of net cash of 3.651 billion yen (approximately 72% of market capitalization) versus a market capitalization of 5.1 billion yen, and low share-price multiples of forecast PER of 12.02x and actual PBR of 1.28x, it is inferred that there is substantial room for reassessment in an earnings upside phase. However, for a marked step-up in share-price valuation, in addition to reproducibility of profit growth, clarification of capital allocation (such as quantification of the shareholder return policy) will become a critical investment conclusion factor.
◇ FY2026/5 2Q results highlights: A rise in the gross margin drove a sharp profit increase, absorbing growth investment and cost increases and upwardly revising full-year profit.
CNS’s 2Q (interim period) of FY2026/5 saw profit growth accelerate as gross margin improved alongside higher net sales, resulting in a sharp profit increase that absorbed cost increases, including office relocation-related expenses. Net sales were 3.753 billion yen (+11.6% YoY), gross profit was 952 million yen (+18.6% YoY, gross margin 25.4%), operating profit was 350 million yen (+55.0% YoY, operating margin 9.3%), and ordinary profit was 360 million yen (+49.7% YoY). Interim net income attributable to owners of the parent was 273 million yen (+68.7% YoY).
In terms of structural causality, it is essential that (1) the increase in gross profit (+149 million yen YoY) was the main factor, and (2) in SG&A, increases occurred in system implementation, equipment acquisition, rent, etc., associated with the office relocation. At the same time, (3) hiring-related expenses decreased, and as a result, operating profit increased by 124 million yen YoY. As for the content of growth, while the businesses overall continued to perform steadily, securing higher net sales and higher profits, the company has noted that the growth rate settled down compared with 1Q; this is a form in which high profit growth was maintained even after factoring in a short-term slowdown in growth.
There are two points to note. First, the acquisition of advanced human resources, planned as an investment, did not proceed as expected in the first half, leaving uncertainty about the progress of the growth investment. Second, due to the relocation of the head office, fixed assets and accounts payable, etc., temporarily increased, and the equity ratio declined from 75.3% (end of FY2025/5) to 68.9% (end of the interim period). Nevertheless, while acknowledging the former was difficult, the company has indicated a review of plans from 3Q onward, and the next focus will be to make specific measures concrete, including productivity improvements and the use of external resources that do not rely solely on hiring.
The company maintained its full-year net sales forecast at 8.253 billion yen, while upwardly revising operating profit to 658 million yen, ordinary profit to 675 million yen, and net income attributable to owners of the parent to 483 million yen. The reasons for the revision are that margin improvement is expected due to an increase in the number of projects, improved unit prices, and a higher ratio of highly profitable projects, and that underachievement in acquiring advanced human resources and a review of head office relocation expenses contributed to SG&A control.
The upward revision to profits is of high quality, but if hiring difficulties continue, they will become a constraint on growth. Attention should be paid to specific disclosures of human-resource and productivity measures from 3Q onward.
◇ Segment Analysis: A virtuous cycle with a three-in-one combination of leading-edge, business, and upstream, with the technology domain leading profitability.
CNS’s segment is a single segment of the system engineering services business; however, to promote the mid-term management plan, as of June 1, 2025, it has classified the business categories into three businesses: (1) Technology Solutions Business, (2) Business Solutions Business, and (3) Consulting Business. Consulting plays a hub role in expanding upstream touchpoints and creating projects; Technology Solutions is seeing progress in improving profitability through an increase in high-margin projects; and Business Solutions is expanding its earnings base through accretive acquisitions such as U-Way, against a backdrop of stable demand. The FY2025/5 sales composition by business was Technology 40%, Business 49%, and Consulting 11%. While the earnings base is placed in Business, the room to raise the leading-edge ratio is an investor focus point.
The Technology Solutions Business is a domain that supports the integration and automation of customers’ business processes and the advancement of platforms, focusing on the implementation and operation of ServiceNow and cloud/infrastructure development, etc. In 2Q (cumulative interim period) of FY2026/5, net sales were 1.660 billion yen (+24.8% YoY), gross profit was 489 million yen (+29.8% YoY), and the gross margin expanded to 29% (up 1 pt YoY), with expansion of generative AI projects and the composition of high-margin projects supporting growth.
The Business Solutions Business is a domain that, in addition to system development for financial institutions and retail/distribution, handles the company’s service “U-Way” utilizing OCI (Oracle Cloud Infrastructure) and implementation of ERP packages, and has characteristics that make it easy to accumulate recurring revenue (operations and maintenance after implementation). Cumulative interim-period net sales were 1.748 billion yen (+3.5% YoY), gross profit was 352 million yen (+7.6% YoY), and the gross margin was 20% (up 1 pt YoY), with the accumulation of U-Way and an expansion in orders for OCI projects contributing to improved profitability.
The Consulting Business provides upstream services, including DX strategy formulation and execution support, business process reform, and the development of digital/AI human resources. It is positioned as a hub function that leads to the creation of downstream SI projects. In the cumulative interim period, net sales were flat at 344 million yen (+0.1% YoY). At the same time, gross profit was 111 million yen (+12.1% YoY), and the gross margin rose to 32% (up 3 points YoY), indicating an increase in the share of high-gross-margin projects.
◇ FY2026/5 outlook: Upwardly revised full-year profit; margin recovery is a tailwind toward the mid-term target.
Under the company plan base, for the full year of FY2026/5, net sales remain on the planned line, while profit is clearly expected to exceed the plan. The near-term focus points are (1) how much margin improvement can be reproduced in 2H, and (2) whether, even under human-resource constraints, the focus areas (ServiceNow / U-Way / ERP / AI) can be accumulated. A bridge can be made to net sales of 10.0 billion yen and an operating margin of 10.0% or more set for FY2027/5.
In the company’s full-year forecast, net sales of 8.253 billion yen (+17.8% YoY) were maintained. In comparison, operating profit was upwardly revised to 658 million yen (+18.5% YoY), ordinary profit to 675 million yen (+15.3% YoY), and net income attributable to owners of the parent to 483 million yen (+13.0% YoY). Gross profit is expected to be 1.940 billion yen (+13.7% YoY, gross margin 23.5%), and the operating margin is expected to be 8.0%.
On the positive side, the company outlines a multilayered approach to repeatable growth drivers (a policy to add ERP and AI to ServiceNow and U-Way). The fact that it is also strengthening its partnership with Oracle in the ERP domain (Enhanced Oracle PartnerNetwork Level 2, Oracle NetSuite Alliance Partner) could lead to project creation from 2H onward. On the negative side, hiring was more difficult than assumed in 1H, and among the investment plan, hiring of advanced professional human resources is being treated as a plan review from 3Q onward. Nevertheless, on the premise of a shortage of human resources, the company has, through an MOU with NTQ Solution, set forth building an offshore development center and collaboration themes such as supplying advanced-skilled human resources in ServiceNow / AI / ERP / Cloud, and the key will be whether it can steer from a single-legged reliance on hiring to a multilayered supply means.
In addition, the dividend for FY2026/5 is forecast at 50 yen annually (year-end 50 yen), and the company indicates a policy of increasing dividends in line with profit growth.
The upward revision to the company’s earnings forecast is driven mainly by improvements in unit prices and mix, and is of high quality. Prolonged hiring difficulties will become a drag on growth; attention should be paid to human resource supply (including collaboration) in 2H and to the accumulation of net sales in the focus areas.
◇ Share price trends and points to watch going forward: Entering a reassessment phase from being left undervalued, starting from the upward revision. The next focus is on balancing growth, investment, and capital allocation.
In the past three months, CNS’s share price has shown signs of breaking out of its range, following the upward earnings revision (January 9, 2026), and the market’s valuation axis is shifting from undervaluation to the sustainability of growth. To maintain upward momentum in the share price, it will be necessary to confirm going forward that margin improvement is not transitory and that there is consistency between human-resource investment (hiring and development) and capital allocation.
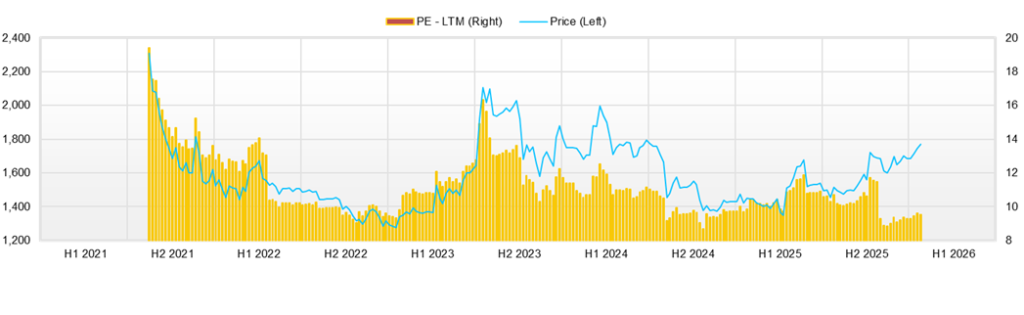
The share price rose by +12.2%, from a closing price of 1,586 yen on October 1, 2025, to a closing price of 1,780 yen on January 13, 2026; the period low was 1,560 yen on October 3, 2025, and the most recent high was 1,819 yen set on January 13, 2026. Trading volume tends to swell on earnings announcement days, such as October 10, 2025 (closing price: 1,721 yen; volume: 23,300 shares).
Looking at reactions to catalysts, (1) after the disclosure of AI initiatives (October 3, 2025), the stock rebounded to a closing price of 1,611 yen on October 6 (+3.27% vs. October 3), while (2) on October 10, 2025, when disclosures including 1Q results were made, it rose to +10.32% vs. October 3, indicating that it tends to react to “earnings/numbers.” (3) After the DX and AI domain MOU with NTQ Solution (November 26, 2025), it increased modestly to a closing price of 1,700 yen on November 27 (+2.41% vs. November 26), suggesting expectations for the effectiveness of the collaboration (building an Offshore Development Center, ERP strengthening / joint AI development). (4) The upward revision to the full-year earnings forecast on January 9, 2026 (operating profit: 557 million yen → 658 million yen) pushed up the share price, which stepped up to a closing price of 1,780 yen by January 13. The share-price impact of non-earnings-related catalysts such as the head office relocation (November 4, 2025) and the LEARNING VISION AWARD (December 3, 2025) was limited, with the share price only moving from 1,674 yen on December 2 to 1,675 yen on December 3 (+0.06%).
Valuation is at a forecast PER of 12.0x and an actual PBR of 1.28x, and the robust financial position, with NetCash of 3.651 billion yen, supports the share price. On the other hand, the conditions for the share price to be clearly revalued are considered to be (1) a further upward revision (quantitative disclosure of continued improvement in unit order prices and the gross margin), (2) execution of growth investment (visualization of progress in hiring and education), and (3) concretization of capital allocation (shareholder return policy, share buybacks, etc.).
From a technical standpoint, since October 2025, the trend has been toward higher lows, and recently, the 1,700 yen level has become a new baseline. Because the level was corrected to the 1,750 yen range after the upward revision, for the time being, the focus is on (1) return-selling pressure if it falls below 1,700 yen, and (2) whether it breaks above the 1,800 yen level (around the 1,819 yen high).
The upward revision broke the state of being left undervalued, but next, evidence is needed for the sustainability of hiring/development and the gross margin. If maintenance of the 1,700 yen level and additional quantitative disclosures (unit price, utilization, headcount) are in place, the room to raise the valuation range will expand.
Key stock price data
Company profile
◇ An independent SI company developing around cloud and AI, aiming to balance growth, investment, and high-margin projects
CNS Co., Ltd. is a growth-oriented IT services company that, leveraging its implementation capabilities in leading-edge technologies such as cloud and AI, captures the structural tailwind of DX demand while shifting its order mix from the contracted SI domain to high-value-added domains. The company was founded on July 4, 1985, and its Representative Director and President is Mr. Masahide Sekine. As of the end of May 2025, the number of employees was 265 on a consolidated basis and 221 on a non-consolidated basis, and CNS Hokkaido Co., Ltd. was a consolidated subsidiary. Its business is developed across three domains, Technology Solutions, Business Solutions, and Consulting, with the provision of IT solutions that support companies’ operational efficiency and promote DX using leading-edge technologies, such as cloud and AI, as core. At present, through acquiring projects spanning generative AI, cloud platforms, and business process reform, expanding the service ratio, and moving toward more upstream-oriented work that can push up gross margins are becoming the key axes of investor evaluation.
Key financial data
| Unit: million yen | 2021 | 2022 | 2023 | 2024 | 2025 CE |
| Sales | 5,419 | 5,989 | 6,657 | 7,005 | 8,253 |
| EBIT (Operating Income) | 533 | 559 | 620 | 555 | 658 |
| Pretax Income | 595 | 589 | 636 | 583 | |
| Net Profit Attributable to Owner of Parent | 409 | 433 | 461 | 427 | 483 |
| Cash & Short-Term Investments | 3,010 | 3,163 | 3,574 | 3,667 | |
| Total assets | 4,152 | 4,547 | 4,934 | 5,260 | |
| Total Debt | 6 | 13 | 11 | 8 | |
| Net Debt | -3,004 | -3,150 | -3,563 | -3,659 | |
| Total liabilities | 1,113 | 1,206 | 1,262 | 1,300 | |
| Total Shareholders’ Equity | 3,039 | 3,341 | 3,672 | 3,959 | |
| Net Operating Cash Flow | 461 | 353 | 565 | 444 | |
| Capital Expenditure | 19 | 59 | 11 | 24 | |
| Net Investing Cash Flow | -23 | -126 | -81 | -269 | |
| Net Financing Cash Flow | 634 | -133 | -134 | -142 | |
| Free Cash Flow | 450 | 344 | 554 | 429 | |
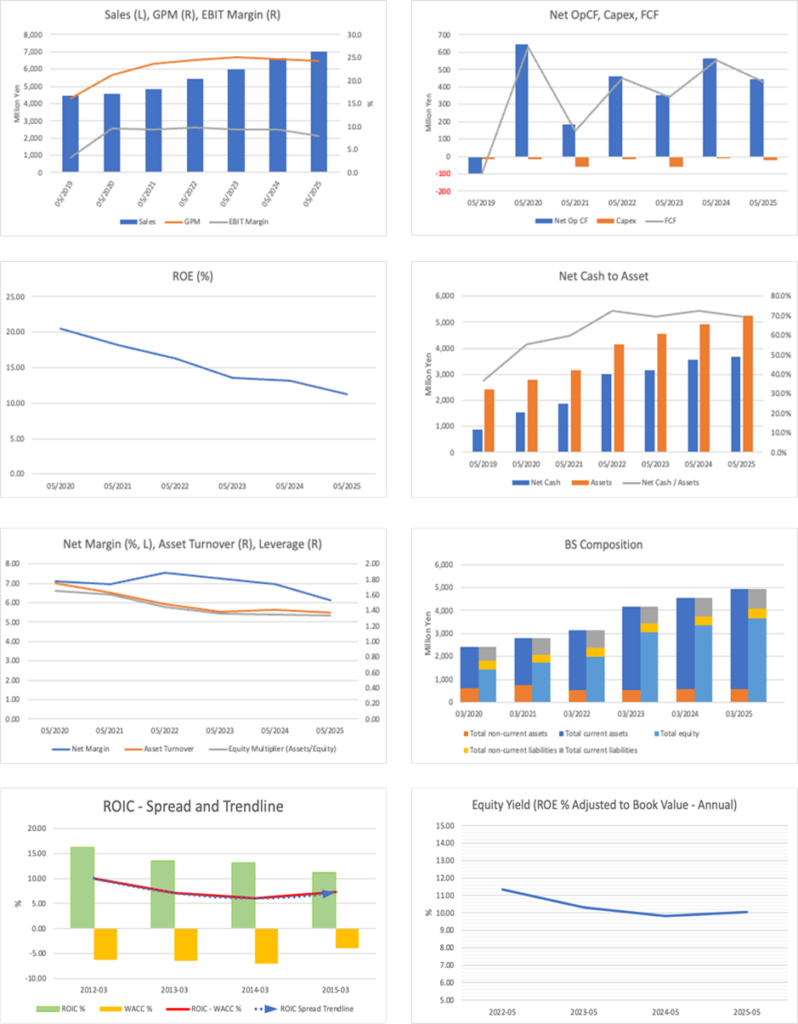
| ROA (%) | 11.23 | 9.96 | 9.73 | 8.38 | |
| ROE (%) | 16.27 | 13.58 | 13.16 | 11.20 | |
| EPS (Yen) | 145.5 | 149.0 | 158.8 | 147.1 | 166.21 |
| BPS (Yen) | 1,045.7 | 1,149.7 | 1,263.5 | 1,362.5 | |
| Dividend per Share (Yen) | 45.00 | 45.00 | 48.00 | 75.00 | 50.00 |
| Shares Outstanding (Million shares) | 2.91 | 2.91 | 2.91 | 2.91 |
Source: Omega Investment from company data, rounded to the nearest whole number.
Share price
Financial data (quarterly basis)
| Unit: million yen | 2024/5 | 2025/5 | 2026/5 | ||||||
| 2Q | 3Q | 4Q | 1Q | 2Q | 3Q | 4Q | 1Q | 2Q | |
| (Income Statement) | |||||||||
| Sales | 1,651 | 1,683 | 1,677 | 1,645 | 1,720 | 1,823 | 1,818 | 1,875 | 1,879 |
| Year-on-year | 14.3% | 10.5% | 3.5% | -0.1% | 4.2% | 8.3% | 8.4% | 14.0% | 9.2% |
| Cost of Goods Sold (COGS) | 1,236 | 1,262 | 1,278 | 1,266 | 1,294 | 1,368 | 1,370 | 1,386 | 1,414 |
| Gross Income | 415 | 421 | 399 | 378 | 425 | 455 | 448 | 488 | 465 |
| Gross Income Margin | 25.1% | 25.0% | 23.8% | 23.0% | 24.7% | 24.9% | 24.7% | 26.0% | 24.7% |
| SG&A Expense | 233 | 232 | 292 | 298 | 279 | 260 | 314 | 306 | 296 |
| EBIT (Operating Income) | 182 | 189 | 108 | 80 | 146 | 195 | 134 | 182 | 168 |
| Year-on-year | 11.5% | 8.2% | -6.8% | -43.6% | -19.5% | 3.0% | 24.9% | 128.7% | 15.0% |
| Operating Income Margin | 11.0% | 11.2% | 6.4% | 4.8% | 8.5% | 10.7% | 7.4% | 9.7% | 9.0% |
| EBITDA | 190 | 198 | 117 | 88 | 155 | 209 | 150 | 195 | 184 |
| Pretax Income | 193 | 190 | 123 | 81 | 160 | 202 | 140 | 229 | 177 |
| Consolidated Net Income | 131 | 130 | 111 | 55 | 107 | 137 | 128 | 155 | 119 |
| Minority Interest | 0 | 0 | 0 | 0 | 0 | 0 | 0 | 0 | 0 |
| Net Income ATOP | 131 | 130 | 111 | 55 | 107 | 137 | 128 | 155 | 119 |
| Year-on-year | 14.5% | 3.7% | -5.7% | -38.4% | -18.2% | 5.5% | 15.3% | 181.6% | 10.8% |
| Net Income Margin | 7.9% | 7.7% | 6.6% | 3.3% | 6.2% | 7.5% | 7.0% | 8.3% | 6.3% |
| (Balance Sheet) | |||||||||
| Cash & Short-Term Investments | 3,244 | 3,325 | 3,574 | 3,372 | 3,382 | 3,355 | 3,667 | 3,479 | 3,657 |
| Total assets | 4,622 | 4,665 | 4,934 | 4,732 | 5,005 | 4,946 | 5,260 | 5,172 | 5,831 |
| Total Debt | 12 | 11 | 11 | 10 | 9 | 9 | 8 | 7 | 6 |
| Net Debt | -3,232 | -3,314 | -3,563 | -3,362 | -3,372 | -3,346 | -3,659 | -3,472 | -3,651 |
| Total liabilities | 1,191 | 1,104 | 1,262 | 1,145 | 1,311 | 1,114 | 1,300 | 1,275 | 1,816 |
| Total Shareholders’ Equity | 3,431 | 3,561 | 3,672 | 3,587 | 3,694 | 3,832 | 3,959 | 3,896 | 4,015 |
| (Profitability %) | |||||||||
| ROA | 10.53 | 10.51 | 9.73 | 9.34 | 8.38 | 8.54 | 8.38 | 10.65 | 9.94 |
| ROE | 14.19 | 13.80 | 13.16 | 12.40 | 11.32 | 11.10 | 11.20 | 14.09 | 13.98 |
| (Per-share) Unit: JPY | |||||||||
| EPS | 45.1 | 44.8 | 38.1 | 18.9 | 36.9 | 47.3 | 44.0 | 53.3 | 40.9 |
| BPS | 1,180.5 | 1,225.4 | 1,263.5 | 1,234.4 | 1,271.3 | 1,318.6 | 1,362.5 | 1,340.8 | 1,381.7 |
| Dividend per Share | 0.00 | 0.00 | 48.00 | 0.00 | 0.00 | 0.00 | 75.00 | 0.00 | 0.00 |
| Shares Outstanding (million shares) | 2.91 | 2.91 | 2.91 | 2.91 | 2.91 | 2.91 | 2.91 | 2.91 | 2.91 |
Source: Omega Investment from company materials
Financial data (full-year basis)
| Unit: million yen | 2021 | 2022 | 2023 | 2024 |
| (Income Statement) | ||||
| Sales | 5,419 | 5,989 | 6,657 | 7,005 |
| Year-on-year | 11.9% | 10.5% | 11.1% | 5.2% |
| Cost of Goods Sold | 4,097 | 4,483 | 5,018 | 5,298 |
| Gross Income | 1,322 | 1,506 | 1,639 | 1,707 |
| Gross Income Margin | 24.4% | 25.1% | 24.6% | 24.4% |
| SG&A Expense | 789 | 947 | 1,019 | 1,151 |
| EBIT (Operating Income) | 533 | 559 | 620 | 555 |
| Year-on-year | 16.4% | 4.8% | 10.9% | -10.4% |
| Operating Income Margin | 9.8% | 9.3% | 9.3% | 7.9% |
| EBITDA | 559 | 589 | 654 | 601 |
| Pretax Income | 595 | 589 | 636 | 583 |
| Consolidated Net Income | 409 | 433 | 461 | 427 |
| Minority Interest | 0 | 0 | 0 | 0 |
| Net Income ATOP | 409 | 433 | 461 | 427 |
| Year-on-year | 21.6% | 5.8% | 6.5% | -7.4% |
| Net Income Margin | 7.6% | 7.2% | 6.9% | 6.1% |
| (Balance Sheet) | ||||
| Cash & Short-Term Investments | 3,010 | 3,163 | 3,574 | 3,667 |
| Total assets | 4,152 | 4,547 | 4,934 | 5,260 |
| Total Debt | 6 | 13 | 11 | 8 |
| Net Debt | -3,004 | -3,150 | -3,563 | -3,659 |
| Total liabilities | 1,113 | 1,206 | 1,262 | 1,300 |
| Total Shareholders’ Equity | 3,039 | 3,341 | 3,672 | 3,959 |
| (Cash Flow) | ||||
| Net Operating Cash Flow | 461 | 353 | 565 | 444 |
| Capital Expenditure | 19 | 59 | 11 | 24 |
| Net Investing Cash Flow | -23 | -126 | -81 | -269 |
| Net Financing Cash Flow | 634 | -133 | -134 | -142 |
| Free Cash Flow | 450 | 344 | 554 | 429 |
| (Profitability ) | ||||
| ROA (%) | 11.23 | 9.96 | 9.73 | 8.38 |
| ROE (%) | 16.27 | 13.58 | 13.16 | 11.20 |
| Net Margin (%) | 7.56 | 7.23 | 6.93 | 6.10 |
| Asset Turn | 1.49 | 1.38 | 1.40 | 1.37 |
| Assets/Equity | 1.45 | 1.36 | 1.35 | 1.34 |
| (Per-share) Unit: JPY | ||||
| EPS | 145.5 | 149.0 | 158.8 | 147.1 |
| BPS | 1,045.7 | 1,149.7 | 1,263.5 | 1,362.5 |
| Dividend per Share | 45.00 | 45.00 | 48.00 | 75.00 |
| Shares Outstanding (million shares) | 2.91 | 2.91 | 2.91 | 2.91 |
Source: Omega Investment from company materials