2026-07-15
Home
Japanese

Omega Investment Co., Ltd.
CNS (Investment report – Basic report)
| Share price (7/24) | ¥1,803 | Dividend Yield (27/5 CE) | 3.9 % |
| 52weeks high/low | ¥1,444/1,895 | ROE(26/5) | 14.2 % |
| Avg Vol (3 month) | 2.7 thou shrs | Operating margin (TTM) | 8.8 % |
| Market Cap | ¥5.24 bn | Beta (5Y Monthly) | 0.43 |
| Enterprise Value | ¥1.56 bn | Shares Outstanding | 2.906 mn shrs |
| PER (27/5 CE) | 7.7 X | Listed market | TSE Growth |
| PBR (26/5 act) | 1.2 X |
| Click here for the PDF version of this page |
| PDF version |
Stronger earnings and clearer capital allocation set the stage for a re-rating of the underlying business, long overshadowed by the cash-rich balance sheet.
Investment conclusion
We are upgrading our investment view to Bullish. Although several aspects of the management’s plan still require verification, the current share price underestimates the company’s earnings growth and capital efficiency.
CNS Co., Ltd. is an independent IT services company active in generative AI, ServiceNow, cloud infrastructure, financial systems, ERP, and upstream consulting. For the fiscal year ended May 2026, revenue was 7.774 billion yen and operating profit was 685 million yen, representing year-over-year growth of 11.0% and 23.4%, respectively. The operating margin improved from 7.9% to 8.8%, and profit grew faster than revenue, despite upfront investment and head office relocation costs. For the fiscal year ending May 2027, the company forecasts revenue of 9.278 billion yen, operating profit of 966 million yen, and an operating margin of 10.4%. The operating profit forecast implies growth of 40.9%, driven by a better project mix, expansion of priority growth businesses, and productivity gains from the companywide use of generative AI.
There are three reasons for the upgrade. First, the high-margin growth of the Technology Solutions business, which we identified as a key confirmation point in our previous quarterly update, continued through the full year. Revenue reached 3.579 billion yen and gross profit 1.034 billion yen, both up approximately 27% year over year. Generative AI projects, a next-generation cashless payment platform, and new ServiceNow engagements supported growth, while the gross margin remained high at 28.9%. Second, in the Consulting business, a shift toward direct end-user engagements and upstream work improved profitability. Revenue was nearly flat, but gross profit increased 26.5%, and the gross margin rose to 34.2%. Third, the company made progress on capital allocation, which had previously been the largest missing piece. It placed growth investment first, announced a 2.0 billion yen M&A investment framework, and said it would consider a progressive dividend policy, shareholder-return measures in the next medium-term plan, optimization of the shareholder base, and improved share liquidity.
At a share price of 1,720 yen and a forecast EPS of 233.7 yen, the forward PER is 7.4x. Conservative net cash, calculated by subtracting lease liabilities from cash and deposits, was 3.782 billion yen at the end of May 2026, equivalent to about 76% of the company’s market capitalization of approximately 5.0 billion yen. The implied value of the operating business after net cash is only about 1.22 billion yen, and the net-cash-adjusted PER, based on a forecast net income of 679 million yen, is approximately 1.8 times. At the current share price, roughly 1,301 yen per share is backed by net cash, meaning the business is expected to generate annual EPS of 233.7 yen and is valued at only about 419 yen per share. In our view, the operating business is receiving very little market recognition.
Our Bullish view does not assume full achievement of the company’s fiscal May 2027 plan. Among the three businesses, Business Solutions is expected to increase gross profit by 57.9% year over year and raise its gross margin from 17.9% to 23.0%, a demanding target. If ERP orders remain weak, projects continue to run longer than planned, or existing financial-sector engagements shrink, operating profit may fall short of 966 million yen. Even if operating profit is only around 850 million yen to 900 million yen, however, the value assigned to the operating business after net cash would remain low. The gap between the share price and intrinsic value remains substantial even after allowing for a degree of downside.
Our three valuation approaches produce median fair values of approximately 2,160 yen under the PBR method, 4,600 yen under the DCF method, and 2,820 yen under the ROIC method. DCF produces a high value because net cash represents a large share of total value, so it should not be used mechanically as a price target. Even so, both the PBR and ROIC approaches indicate upside from the current share price. We use a practical central valuation range of 2,200 yen to 3,200 yen, with a median of approximately 2,820 yen across the three methods. This implies upside of about 64% from 1,720 yen to the median. In the near term, the shares could face a pullback after the post-earnings rise or see selling as investors wait for evidence that the company is on track. Over the medium- to long-term, however, earnings growth, dividend increases, and greater clarity on capital allocation should support a higher valuation.
1. Company Overview and the Drivers of Corporate Value
CNS is an independent IT services company founded in 1985. Building on long-term relationships with major systems integrators, financial institutions, and retailers, it provides end-to-end services spanning requirements definition, design, development, implementation, and operations. Beginning in fiscal May 2026, the company reorganized its activities into three businesses: Technology Solutions, Business Solutions, and Consulting. It remains a single reportable segment, System Engineering Services, for accounting purposes, but the three businesses play distinct operating roles.
Technology Solutions is responsible for growth and a high gross margin. It focuses on generative AI, ServiceNow, systems infrastructure, and cloud utilization, implementing advanced technologies in customers’ operations. Business Solutions covers systems for financial institutions, U-Way, and ERP implementation, and provides an earnings base through recurring relationships with existing customers and operations and maintenance work. Consulting provides DX strategy, business-process reform, digital-talent development, and AI adoption support, serving as the entry point for upstream work and prime-contractor engagements. By operating the three businesses as an integrated platform, CNS aims for Consulting to identify customer issues and for Technology Solutions and Business Solutions to handle implementation and ongoing support.
Increasing the number of engineers and billable personnel alone will not raise corporate value. CNS must simultaneously expand revenue from its priority growth businesses and prime-contractor engagements, improve gross margins, and raise productivity. Revenue from priority growth businesses reached 2.080 yen billion in fiscal May 2026, roughly double the 1.025 billion yen recorded in fiscal May 2024. Prime-contractor revenue rose from 1.632 billion yen to 2.717 billion yen, while the prime-contractor revenue ratio increased from 24.5% to 35.0%. The company is making progress in its transition from a contract-development-centered model to one combining higher-value proposals with standardized services.
U-Way, the company’s proprietary service, is designed to standardize cloud implementation and operations support using Oracle Cloud Infrastructure. In an implementation case study at Watts Co., Ltd., the service reduced dependence on individual personnel, lowered development hours, and improved maintainability and scalability. If CNS can convert knowledge accumulated from bespoke engagements into reusable services, it should be able to improve gross margins while reducing the start-up burden for each project.
2. Fiscal May 2026 Results and Review of Our Previous Assessment
Fiscal May 2026 delivered higher revenue and profit as well as improved margins. Revenue was 7.774 billion yen, gross profit was 1.903 billion yen, operating profit was 685 million yen, recurring profit was 725 million yen, and net income attributable to owners of the parent was 590 million yen. The gross margin rose from 24.4% to 24.5%, and the operating margin from 7.9% to 8.8%. Because net income included a one-time benefit from a reassessment of tax-effect accounting, operating profit is the more appropriate measure of underlying earnings growth.
The 130 million yen increase in operating profit reflected a 196 million yen increase in gross profit, which exceeded the 66 million yen increase in SG&A expenses. ERP-related investment and costs associated with the head-office move, including systems implementation, equipment purchases, and rent, raised expenses, while recruiting costs came in below plan. It would therefore be inappropriate to attribute the improvement in profit solely to unspent recruiting budgets; the main driver was an increase in higher-margin projects. At the same time, lower recruiting expenses caused by a difficult hiring environment do not make it easier to secure personnel in the following year and remain a constraint on delivery capacity.
In our previous quarterly update, we considered the company’s twice-revised fiscal May 2026 plan highly achievable. Actual revenue, however, reached only 94.2% of the revised forecast of 8.253 billion yen. Project wins grew less than expected, and year-end demand was weaker than in a typical year. The company also continued to withdraw from low-margin projects. Our prior revenue outlook was too optimistic, and we should acknowledge that we overestimated both project acquisition and year-end demand.
Operating profit, by contrast, was 685 million yen against the revised forecast of 710 million yen, a shortfall of only 25 million yen. Despite revenue missing the forecast by approximately 480 million yen, the operating margin was 8.8%, above the revised forecast of 8.6%. The margin improvement achieved while exiting low-margin projects should be assessed separately from the revenue shortfall. CNS is moving toward a management approach that emphasizes project mix and profitability rather than revenue scale alone.
Among the conditions set out in our previous investment view, high-margin growth in Technology Solutions, margin improvement in Consulting, and greater specificity on capital allocation all progressed. The recovery in Business Solutions profitability and the hiring of highly skilled professionals, however, remained unmet. We are upgrading the investment view, not because every issue has been resolved, but because the improvements that have occurred are not reflected in the share price and the valuation discount remains substantial even after accounting for the remaining issues.
3. Roles of the Three Businesses, Key KPIs, and the Fiscal May 2027 Plan
Technology Solutions
In fiscal May 2026, Technology Solutions generated revenue of 3.579 billion yen, gross profit of 1.034 billion yen, and a gross margin of 28.9%. Projects expanded primarily in generative AI, and both revenue and gross profit rose by approximately 27% year over year. Growth was driven by AI tool-development projects related to generative AI asset development for a major systems integrator, a next-generation cashless payment platform, and expanded teams for existing customers. Although a large ServiceNow project had run its course, the business won new engagements.
Its role includes value creation, which entails combining revenue growth with high gross margins. Key KPIs include generative AI revenue, ServiceNow revenue, the number of new projects, staffing levels at existing customers, and the gross margin. AI revenue increased from 118 million yen in fiscal May 2025 to 416 million yen in fiscal May 2026, while ServiceNow revenue rose from 740 million yen to 801 million yen. A key issue is whether generative AI work can expand across multiple customers and use cases rather than remain concentrated in a specific project for a single customer.
For fiscal May 2027, the company forecasts revenue of 4.113 billion yen and gross profit of 1.177 billion yen. This represents growth of 14.9% and 13.8%, respectively, and a planned gross margin of 28.6%. The forecast incorporates continued expansion in generative AI projects. Upside could come from broader deployment of generative AI assets, large ServiceNow projects, and greater delivery capacity through the partnership with NTQ Solution. Downside risks include changes to development plans with major customers, delays in AI project completion, higher business partner rates, and a lull in ServiceNow demand. In the next earnings release, we will focus on year-over-year AI revenue growth, ServiceNow revenue, and whether the gross margin remains in the 28% range.
Business Solutions
In fiscal May 2026, Business Solutions generated revenue of 3.460 billion yen, gross profit of 618 million yen, and a gross margin of 17.9%. Financial-sector projects and U-Way were solid, but customer-driven project reductions, delays on certain projects, and upfront costs for ERP training and skills development caused gross profit to decline 11.1% year over year. The profitability recovery we had previously expected did not materialize.
Its role in corporate value creation is to build an earnings base through long-term customer relationships, operations and maintenance, and standardized services. Key KPIs include ERP orders, ERP revenue, the number of certified personnel, U-Way revenue, staffing levels on financial-sector projects, the number of unprofitable projects, and the gross margin. ERP projects involve long sales cycles, while certification and team-building costs are incurred before revenue begins, creating a period of earnings pressure. In fiscal May 2027, the company plans to reorganize its ERP operation and use its alliance with Oracle to accelerate project wins.
For fiscal May 2027, the company forecasts revenue of 4.242 billion yen, gross profit of 975 million yen, and a gross margin of 23.0%, representing growth of 22.6%, 57.9%, and approximately 5 percentage points, respectively. Business Solutions is expected to contribute roughly 357 million yen of the companywide 582 million yen increase in gross profit and will therefore be decisive in determining whether the overall plan is achieved. Large ERP projects, rollout of U-Way Lite to multiple customers, and further exits from low-margin projects could produce upside. Renewed delays in ERP orders, low utilization of launch personnel, contraction in financial-sector work, and further project delays are the principal downside risks. In the next earnings release, our highest priorities will be whether the gross margin returns above 20% and whether ERP orders and revenue show concrete growth.
Consulting
In fiscal May 2026, Consulting generated revenue of 735 million yen, gross profit of 251 million yen, and a gross margin of 34.2%. Revenue declined 0.6% year over year, but gross profit increased 26.5%. The improvement reflected a shift away from SES work and toward direct end-user relationships, including upstream engagements in health care, construction, and manufacturing.
Its role in corporate value creation is less about revenue scale than about identifying customer issues, expanding direct relationships, and originating projects for the other businesses. Key KPIs include prime-contractor revenue, the prime-contractor revenue ratio, project pricing, revenue from development work generated by consulting engagements, and the gross margin. Prime-contractor revenue increased from 1.632 billion yen in fiscal May 2024 to 2.717 billion yen in fiscal May 2026, while the prime-contractor revenue ratio rose from 24.5% to 35.0%.
For fiscal May 2027, the company forecasts revenue of 921 million yen, gross profit of 333 million yen, and a gross margin of 36.1%, based on continued growth in upstream work and direct customer relationships. Upside would come from consulting engagements expanding into Technology Solutions and Business Solutions development work. Downside risks include a shortage of highly paid professionals, smaller project sizes, and longer sales cycles. In the next earnings release, we will monitor the prime-contractor revenue ratio, whether the gross margin remains near 35%, and the extent to which consulting engagements generate projects for other businesses.
4. Growth Strategy, Delivery Capacity, and M&A
The company’s medium-term management plan is based on promoting empowerment and fostering innovation. Its five strategies are strengthening the business foundation, expanding scale through new customer acquisition, broadening the market through enhanced solutions, strengthening proposal capabilities to create new demand, and creating businesses that address social issues. In fiscal May 2026, progress was made in the Oracle partnership, collaboration with NTQ Solution, proposals to new customers, generative AI projects, and the establishment of a companywide proposal structure. Challenges remained in recruiting highly skilled professionals, winning ERP orders, and commercializing jointly developed services.
On the personnel side, CNS is supporting growth through a combination of internal employees and business partners amid a more difficult hiring environment. The number of engineers at CNS on a stand-alone basis declined from 242 in fiscal May 2025 to 238 in fiscal May 2026, while the average monthly number of active business-partner personnel increased from 369 to 396. Business partners provide flexibility in responding to project growth, but they also pose challenges related to rising rates, quality control, and knowledge retention within CNS. If revenue growth depends only on adding business-partner personnel, margin improvement will be difficult. The company, therefore, needs to raise gross profit per person through prime engagements, priority growth businesses, and internal use of generative AI.
In fiscal May 2027, CNS plans to improve productivity through companywide use of generative AI, shift personnel from low-margin projects to priority growth businesses, reorganize the ERP operation, strengthen the companywide value chain, and turn knowledge gained through systems integration into services. Companywide use of generative AI could improve not only customer-facing revenue but also internal productivity in development, testing, documentation, and proposal preparation. Achieving the company’s 10.4% operating margin target will require both a better revenue mix and higher internal productivity.
M&A is an important means of converting excess cash into corporate value. The company has established a 2.0 billion yen M&A investment framework. Logical targets would include companies with talent and customer relationships in generative AI, Oracle ERP, ServiceNow, or upstream consulting. If acquisitions can supply scarce personnel and enable the company to offer new services to existing customers, growth could accelerate without relying solely on direct hiring. At the same time, 2.0 billion yen is large relative to CNS’s current business scale, creating risks related to purchase price, goodwill, integration, and the departure of key personnel. Management should explain the target fields, return thresholds, expected ROIC, and responsibility for integration. Shareholder value will depend not on using cash for its own sake, but on earning returns above the cost of capital.
5. Financial Position, Cash Flow, ROIC, and Capital Allocation
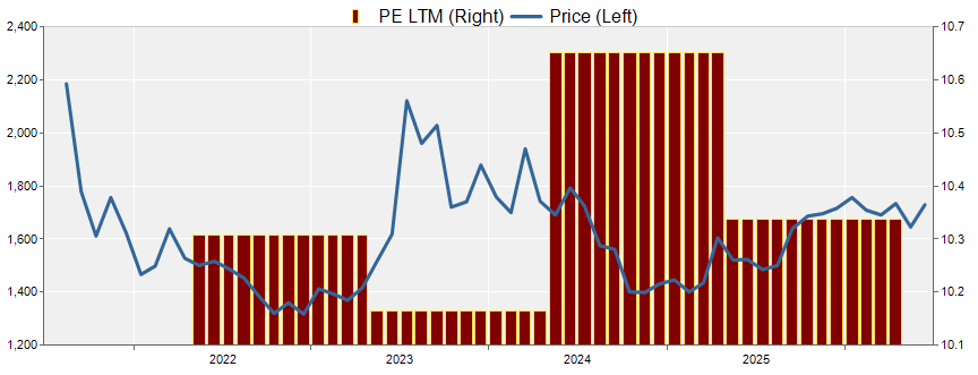
At the end of fiscal May 2026, total assets were 5.857 billion yen, shareholders’ equity was 4.332 billion yen, and the equity ratio was 74.0%. Tangible fixed assets increased following the head-office relocation, but financial soundness remained high. Cash and deposits were 3.787 billion yen, and the company had no borrowings. Lease liabilities were only approximately 1 million yen current and 4 million yen noncurrent. Net cash was 3.787 billion yen on a borrowings-only basis and 3.782 billion yen on a conservative basis, which includes lease liabilities. Conservative net cash increased by approximately 123 million yen from about 3.659 billion yen at the end of fiscal May 2025.
Operating cash flow was 580 million yen, investing cash flow was negative 299 million yen, and free cash flow was 280 million yen. The company generated positive free cash flow and increased cash equivalents despite spending 405 million yen on tangible fixed assets related to the head-office move. Historically, CNS has consistently generated operating cash flow and carried a relatively light capital expenditure burden. Although relocation investment increased outflows in fiscal May 2026, the business’s underlying cash-generating capacity remained intact.
We estimate ROIC at 14.2%. The numerator is fiscal May 2026 net income attributable to owners of the parent of 591 million yen, while the denominator is average invested capital of approximately 4.150 billion yen, calculated as shareholders’ equity plus long-term lease liabilities at the beginning and end of the period. Because net income included a one-time benefit from the reassessment of tax-effect accounting, 14.2% should not be treated as a sustainable run rate without adjustment. Nevertheless, the improvement in operating margin and capital turnover indicates that capital efficiency has improved, up from roughly 11% in the prior year. With forecast net income of 679 million yen in fiscal May 2027, ROIC could remain high even after allowing for further growth in equity.
The fiscal May 2026 dividend totaled 61 yen per share, consisting of an ordinary dividend of 55 yen and a special dividend of 6 yen. The company forecasts 70 yen for fiscal May 2027. CNS intends to continue a progressive dividend policy with a payout ratio of at least 30% as a guideline. The forecast dividend yield is 4.1%, providing some support for the share price. Even so, dividends alone will improve capital efficiency only gradually for a company that earns roughly 600 million yen annually and holds more than 3.7 billion yen in net cash. The next medium-term plan should clarify the priorities among growth investment, M&A, dividends, and share repurchases, as well as the minimum cash balance the company intends to maintain.
6. Shareholder Structure and Share Liquidity
The shareholder base includes a high proportion of stable holdings by the founder, management, the employee shareholding association, and business partners. According to FactSet, identified shareholders account for 66.4% of outstanding shares, and the free float is 33.76%. The former chairman (currently a director) holds 34.58%, the president 6.13%, and the employee shareholding association 4.44%. NTT DATA Group and Co-op Sapporo are also shareholders, linking business relationships and capital ties.
A high proportion of stable shareholders is positive because it allows the company to invest in human capital and new businesses without being overly influenced by short-term share-price fluctuations. It also provides some alignment between management and shareholders. On the other hand, the small number of tradable shares and low daily volume make it difficult for institutional investors to build meaningful positions. Institutional ownership is limited, so even when earnings grow, the pool of new buyers may not expand quickly. Low liquidity is therefore one reason the shares trade at discounted PER and PBR multiples.
The company has said it will consider optimizing the shareholder base and improving liquidity. Possible measures include a stock split, broadening the range of investors targeted by IR activities, and partial secondary offerings by major shareholders. A stock split does not change corporate value, but it can lower the minimum investment amount and encourage participation by individual investors. A secondary offering by a major shareholder could create a temporary supply burden, but it would increase free float and, over time, make the shares more accessible to institutional investors. The fact that management now recognizes liquidity as a corporate issue is itself a step toward a higher valuation.
7. Share-Price Performance and Reasons for the Valuation Discount
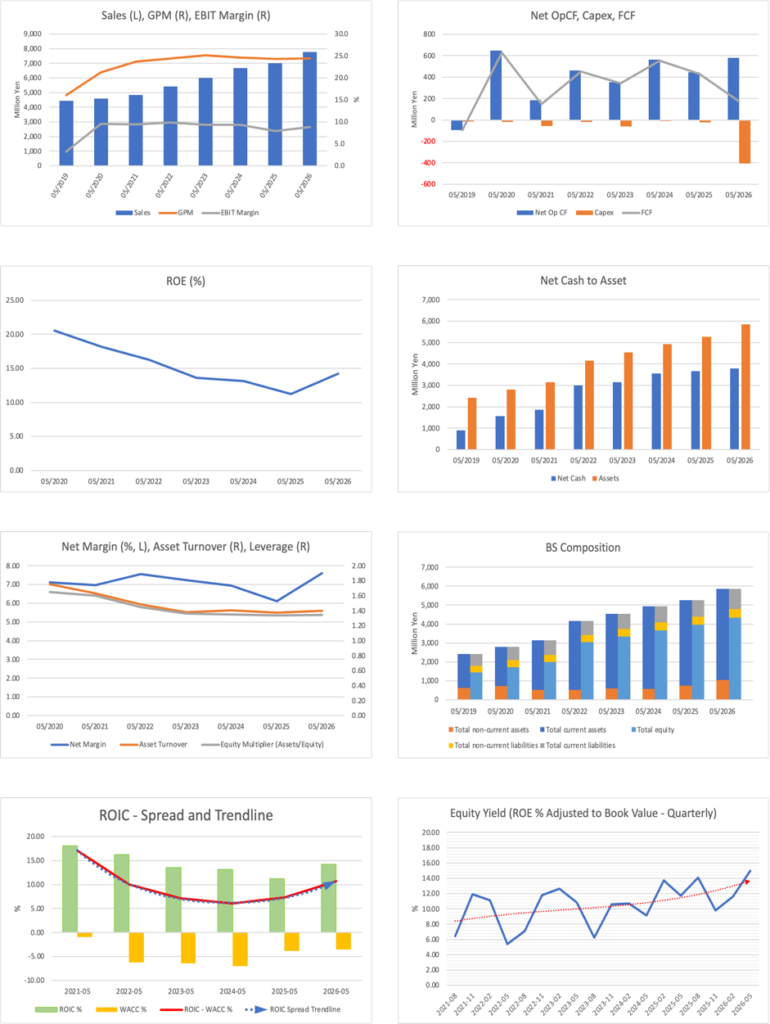
Over roughly the past five years, the share price has responded more strongly to earnings forecasts, dividends, and changes in margins than to the company’s long-term revenue growth. The shares rose at times from 2024 through the first half of 2025 on expectations for growth and the commemorative dividend. Still, the valuation declined following lower operating profit and a weaker operating margin in fiscal May 2025. Even as net cash increased, the share price remained within the 1,500 yen range, demonstrating that cash accumulation alone was insufficient to drive appreciation.
In 2026, the shares reacted to the January upward earnings revision, the April second upward revision, and the dividend increase. By contrast, announcements whose earnings contribution was difficult to quantify, such as new U-Way services and health-management certification, had a limited effect. The market is focused not on the number of new initiatives, but on whether they translate into operating profit, EPS, and dividends.
There are five main reasons the shares remain inexpensive despite rising revenue and profit, high ROE, and recurring cash generation. First, the decline in profit in fiscal May 2025 reduced confidence in the stability of earnings growth. Second, the market still tends to view CNS as a labor-hour-based contract developer and has not fully recognized the repeatability of engagements with U-Way, generative AI, ServiceNow, and prime contractors. Third, fiscal May 2026 revenue fell short despite two upward revisions, prompting investors to remain cautious about the fiscal May 2027 plan. Fourth, the use of cash remained unclear for an extended period, delaying improvement in capital efficiency. Fifth, low share liquidity makes it difficult for new investors to enter and participate in the company’s valuation.
We believe the marked rise in the share price after the July 13 earnings announcement reflected the simultaneous disclosure of a 40.9% increase in fiscal May 2027 operating profit, a 10.4% operating margin, a 70 yen annual dividend, a 6 yen special dividend for fiscal May 2026, a 2.0 billion yen M&A investment framework, and consideration of measures to improve share liquidity. Most important was the greater specificity on capital allocation, an area that had previously been lacking. Because the shares started from a low PER, confirmation of better earnings and shareholder returns can produce a large price move even on limited trading volume.
In the near term, the shares may fluctuate due to profit-taking following the post-earnings rally, concerns about first-quarter progress toward the company’s plan, and an investor waiting for a recovery in Business Solutions. Over the medium- to long-term, ERP orders, prime engagements, priority growth businesses, M&A, and dividend increases should be the principal drivers of share prices. For the valuation to rise further, the company must demonstrate not only that the stock is inexpensive, but also that earnings growth is sustainable and cash is being used to increase corporate value.
8. Valuation and Fair Value
At a share price of 1,720 yen, forecast EPS of 233.7 yen implies a forward PER of 7.4 times. An actual BPS of 1,490.8 yen implies a PBR of 1.5 and a forecast dividend yield of 4.1%. A PBR of 1.15 times is low relative to the actual ROE of 14.2%. The net cash-adjusted PER is approximately 1.8x, indicating that the market assigns very little value to the operating business’s earnings power.
Using a simplified dividend-discount framework, the EPS growth rate embedded in the share price is approximately 5.9%, assuming a required equity return of 10.0%. At required returns of 9.0% to 11.0%, the implied growth rate is approximately 4.9% to 6.9%. EPS increased from 145.51 yen in fiscal May 2021 to 203.31 yen in fiscal May 2026, a five-year CAGR of approximately 6.9%. The current share price, therefore, does not require growth above the historical record. Compared with the forecast EPS growth of 14.9% in fiscal May 2027, the market appears to place a low probability on the sustainability of the company’s plan.
Under the PBR method, we use a BPS of 1,490.8 yen, an ROE of 14.2%, and an appropriate PBR range of 1.30 to 1.60 times. This produces a fair-value range of approximately 1,940 yen to 2,390 yen and a midpoint of about 2,160 yen. The low end assumes that the improvement in capital efficiency is temporary and that cash deployment remains limited. The high-end assumption is that ROE remains around 14% and capital allocation progresses.
Under the DCF method, we start with the company’s fiscal May 2027 plan and assume an operating margin near 10% over the medium term, a WACC of 7.5% to 9.5%, a terminal growth rate of 1.0% to 2.0%, and net cash of 3.782 billion yen. The resulting fair-value range is approximately 4,200 yen to 5,100 yen, with a midpoint near 4,600 yen. Because net cash accounts for a large part of DCF value, the valuation would decline if the company deployed cash into low-return investments or if a discount were applied to excess cash. We therefore do not use the DCF midpoint as a stand-alone price target.
Under the ROIC method, we assume ROIC of 14.2%, a cost of capital of 8.5% to 10.0%, and long-term growth of 1.0% to 2.0%. A residual-income valuation in which excess returns gradually decline produces a fair-value range of approximately 2,430 yen to 3,140 yen and a midpoint of about 2,820 yen. This assumes the company maintains ROIC above the cost of capital and directs excess cash toward growth investment or shareholder returns.
The three methods produce median values of 2,160 yen under PBR, 4,600 yen under DCF, and 2,820 yen under ROIC. The median of these three midpoints is 2,820 yen. Although the full range across the three methods is broad, at 1,940 yen to 5,100 yen, we use a practical central range of 2,200 yen to 3,200 yen for the investment view. This represents upside of approximately 28% to the bottom of the central range, 64% to the median, and 86% to the top of the central range from the current share price.
| Valuation Method | Key Assumptions | Fair-Value Range | Midpoint |
| PBR | BPS 1,490.8yen; appropriate PBR 1.30x–1.60x | 1,940–2,390yen | 2,160yen |
| DCF | WACC 7.5%–9.5%; terminal growth 1.0%–2.0% | 4,200–5,100yen | 4,600yen |
| ROIC | ROIC 14.2%; cost of capital 8.5%–10.0% | 2,430–3,140yen | 2,820yen |
9. Risks and Items to Monitor in Future Results
The largest earnings risk is failure to achieve the Business Solutions plan. The company expects to improve the gross margin by approximately 5 percentage points in fiscal May 2027, which will require ERP orders, exits from low-margin projects, and a recovery in existing financial-sector work to occur simultaneously. If the gross margin does not begin improving in the first quarter, investor concern about the full-year plan is likely to rise.
The second risk is personnel supply. The number of internal engineers has declined while the number of active business-partner personnel has increased. Higher business-partner rates and the burden of quality control could pressure gross margins. Investors should monitor not only hiring numbers but also per-person gross profit, turnover, certified personnel, and productivity improvements from generative AI.
The third risk is customer concentration and project volatility. Large generative AI and payment-platform projects drive profit growth, but their completion or contraction can have a significant impact. We will monitor diversification of AI revenue by customer, project duration, and conversion to maintenance and operations work. The fourth risk is M&A. Overpaying, goodwill, delayed integration, or loss of key personnel could cause the company’s substantial cash balance to destroy shareholder value.
Revenue and operating profit alone are not sufficient for assessing future earnings. Our highest priority will be whether the Business Solutions gross margin returns above 20% and whether ERP orders and revenue show tangible growth. In Technology Solutions, we will monitor year-over-year AI revenue, ServiceNow revenue, and whether the gross margin remains in the high-20% range. In Consulting, we will monitor prime-contractor revenue, the prime-contractor revenue ratio, a gross margin near 35%, and the extent to which consulting engagements generate work for the other businesses.
At the companywide level, we will monitor progress toward a 10% operating margin, the number of engineers and active business-partner personnel, outsourcing rates, the impact of exiting low-margin projects, and productivity gains from the companywide use of generative AI. On capital policy, we will monitor the areas targeted for M&A, utilization of the 2.0 billion yen framework, return thresholds, measures to improve share liquidity, and the shareholder-return policy in the next medium-term plan. Progress on these items could shift the market’s focus from cash value toward earnings growth and capital efficiency.
10. Investment Scenarios and Monitoring Framework
In translating the investment view into portfolio decisions, it is preferable to consider several earnings paths rather than accept the company plan as a single point estimate. In the upside scenario, generative AI projects expand beyond existing major customers and new ServiceNow engagements accumulate. In Business Solutions, a large ERP project begins, and the combination of existing low-margin work and the standardization of U-Way raises the gross margin to around 23%. In Consulting, prime engagements convert into development work, and the companywide operating margin exceeds the planned 10.4%. Operating profit could then exceed 1.0 billion yen, and EPS could surpass company guidance. If M&A also strengthens personnel and the customer base, while progressive dividends and liquidity measures advance, the share price could approach the upper end of the ROIC valuation range.
In the base case, Technology Solutions continues to grow at a double-digit rate, and Consulting maintains its high margin. ERP, however, ramps more slowly than the company expects, and the Business Solutions gross margin recovers only to around 21%. Companywide revenue would be approximately 9.0 billion yen, and operating profit would be about 850 million yen to 900 million yen, both below the company plan. Even then, the value assigned to the operating business after net cash would remain on the low end of the operating profit range, and the forward PER would stay in single digits. If the 70 yen dividend is maintained, financial strength and income support should help limit downside. Our Bullish view is based on the fact that expected returns remain attractive even in this base case.
In the cautious scenario, a major generative AI project is reduced, and ERP orders are delayed again. The company has low-margin projects but fails to replace them with sufficient new work, stalling revenue growth. Higher business-partner rates and a shortage of internal personnel prevent gross-margin improvement, leaving operating profit roughly flat or only slightly higher. M&A also fails to progress, and cash continues to accumulate. In this case, the share price could fall toward approximately 1.0 times book value. Even so, BPS of 1,490.8 yen and net cash of approximately 1,301 yen per share provide useful downside reference points. Unless the business turns loss-making or the company undertakes a large value-destructive investment, a prolonged period materially below book value appears unlikely.
In the first quarter, investors should look not only at year-over-year comparisons but also at the segment margins required to achieve the company plan. A Business Solutions gross margin above 20% would be an early indication of progress toward the full-year target of 23%. If the margin remains below 20% and the company provides no concrete explanation of ERP orders, the probability of achieving the plan should be reduced. In Technology Solutions, investors should confirm that higher generative AI revenue is accompanied by a gross margin in the 28% range. If revenue rises while the margin falls, greater dependence on business partners or lower project pricing may be the cause.
At the first-half stage, the key question will be whether the revised project mix is being reflected in the operating margin. Since the full-year target is 10.4%, a first-half operating margin in the high-9% range would indicate good progress. If the first-half margin remains in the 8% range, the company would require a large second-half improvement and would become more dependent on year-end projects. Because year-end demand was weaker than expected in the prior year, CNS needs to smooth the timing of project starts and profit recognition across quarters.
For priority growth businesses, investors should assess not only total revenue from ServiceNow, U-Way, AI, and ERP, but also the gross margin and continuity of each area. If AI revenue growth is driven mainly by one-time development projects, the following year’s comparison base will become more difficult. For U-Way, the key is post-implementation operations revenue; for ServiceNow, maintenance and additional development; and for ERP, continuing support after implementation. Disclosure of backlog, recurring revenue, and project counts for priority growth businesses would make it easier for the market to evaluate the repeatability of growth.
The prime-contractor revenue ratio has risen to 35.0%, but investors should evaluate profitability, project-originating effects, and the ratio itself. Direct engagements increase the burden of sales, requirements definition, and project management, so their contribution to corporate value is limited unless gross margins also improve. Ideally, projects won by Consulting will generate revenue in Technology Solutions or Business Solutions and extend both customer value and contract duration. The company should, to the extent possible, disclose gross margins, retention rates, and cross-business revenue generated by prime engagements.
Capital allocation should not be judged solely by whether an acquisition is completed. Against the 2.0 billion yen framework, investors should assess the target company’s revenue scale, operating margin, key customers, workforce composition, and post-acquisition ROIC. Even when the purpose is to acquire talent in growth fields, value will not remain if employees leave after the transaction. Share consideration would create dilution, while cash consideration would reduce net cash. If the company discloses the cost of capital, payback period, and post-acquisition ROIC as investment criteria, market concern about cash deployment should decline.
Shareholder returns should be evaluated together with earnings growth and the sustainability of the progressive dividend. The forecast 70 yen dividend represents a 30% payout ratio, leaving some flexibility even if earnings fall short of plan. If operating profit misses the forecast and M&A does not progress, share repurchases could raise per-share value. Because free float is limited, a large repurchase could further reduce liquidity, but an appropriately sized program and clear cancellation policy could balance capital efficiency with shareholder returns.
Investors do not need more growth-strategy terminology; they need a clear connection between strategy and financial results. Important disclosures would include how much companywide use of generative AI raises gross profit per person, how many percentage points exiting low-margin projects adds to segment margins, how many orders are generated by ERP-certified personnel, and how much downstream revenue originates from consulting engagements. Such information would enable investors to translate management’s strategy into earnings forecasts and could lead to a different share-price valuation.
11. What the Company Must Do to Support a Re-rating
The first condition for a re-rating is early evidence that the company is progressing toward its plan. Fiscal May 2027 calls for a high 40.9% increase in operating profit, and an explanation that profits will be concentrated at year-end is unlikely to earn market confidence. By the first quarter and first half, the company should show revenue from priority growth businesses, the Business Solutions margin, and the effect of exiting low-margin projects. Continued quarterly disclosure of segment gross profit and key KPIs would allow investors to assess the likelihood of achieving the plan sooner.
The second condition is a more detailed disclosure of the ERP pipeline. To date, the company’s explanation has focused on certification, organizational preparation, and collaboration with Oracle. Investors need the number of projects, the proposal value, the expected timing of orders, the period from order to revenue recognition, and the recurring revenue after implementation. Even within confidentiality constraints, the company should be able to disclose project counts by size and backlog. Because ERP is expected to drive a large share of the planned earnings increase, more granular progress disclosure should support a higher valuation.
The third condition is a clear definition of the role of net cash. The company is financially sound, but when cash represents roughly three-quarters of market capitalization, investors tend to value the shares primarily on asset value rather than the operating business. Management should distinguish the minimum working-capital requirement, funds for growth investment, the M&A framework, and capital available for shareholder returns, and then present a multi-year allocation plan. A clear explanation of why cash is retained and under what conditions it will be deployed would reduce the discount applied to excess cash.
The fourth condition is that management treat the share price and the cost of capital as management metrics. A PBR of 1.15 times despite ROE and ROIC in the 14% range indicates market concerns about earnings durability, capital allocation, and liquidity. Management does not need to set PBR or the cost of equity as direct targets, but it should explain how operating margin, ROIC, dividends, and investment will be combined to increase per-share value.
The fifth condition is to broaden the IR audience. With a small market capitalization and low trading volume, CNS is difficult for large institutions to own. The company should communicate a consistent story around priority growth businesses, prime-contractor revenue, net cash, and capital allocation to domestic institutions specializing in small-cap equities, long-term individual investors, and investors comparing IT services companies. As the earnings presentation has become richer in business KPIs and English-language disclosures, one-on-one meetings could further broaden the investor base.
As the share price moves toward the valuation range, repeatability across several quarters will matter more than a single earnings beat. Investors need a sequence of evidence: continued generative AI projects, a recovery in Business Solutions, consulting engagements that generate downstream work, and progress in capital allocation. If the company demonstrates these points quarter by quarter, the current forward PER in the 7-times range is unlikely to persist. Conversely, if disclosure remains qualitative and the use of cash and progress in ERP remain unclear, the shares could continue to trade at a low valuation even as earnings rise.
12. Medium- to Long-Term Corporate-Value Creation
The core of medium- to long-term value creation is not simply expanding revenue, but extending customer relationships from upstream advisory work through implementation and operations. Consulting identifies customer issues, Technology Solutions implements generative AI, ServiceNow, and cloud infrastructure, and Business Solutions provides ongoing support through financial systems, ERP, and U-Way. If this flow becomes established, revenue and gross profit per customer should rise, and selling efficiency should improve. The interaction among the three businesses is therefore central to value creation, and the company’s progress cannot be understood through the growth rate of any single business alone.
Looking toward 2030, the long-term vision is revenue of 15.0 billion yen and an operating margin of 12%. Nearly doubling revenue from the current 7.774 billion yen will require more than deeper penetration of existing customers; it will also require new customers, standardized services, and M&A. Achieving a 12% operating margin will require gross profit to grow faster than revenue and SG&A growth to remain controlled. Reusing knowledge in U-Way, ServiceNow, ERP, and generative AI, while reducing bespoke design for each project, will be critical.
From a financial perspective, the current net cash balance provides a buffer for growth. Even if the economy weakens or a major project ends, the company can continue to invest in personnel development and service creation. If cash remains unused for too long, however, equity will continue to accumulate, and ROE will decline. The company needs the discipline to prioritize growth investment when expected returns exceed the cost of capital and to direct funds to dividends or share repurchases when attractive investment opportunities are unavailable. Flexibility in capital allocation is a strength, but it becomes a valuation discount when the use of cash is unclear.
Investors should distinguish between the company CNS could become in three to four years and the factors likely to influence the share price over the next one to two years. Over three to four years, value will be determined by implementation capabilities in generative AI and cloud, recurring revenue from ERP and U-Way, upstream consulting, and personnel expansion through M&A. Over one to two years, progress toward a 10% operating margin, dividends of 70 yen or more, concrete M&A steps, and liquidity measures are more likely to move the share price. Because the current valuation incorporates little long-term success, even near-term confirmation of progress could change the market’s assessment.
Even if the medium- to long-term growth strategy succeeds, it may not necessarily translate into shareholder value. Risks include acquiring companies at excessive prices, adding low-margin projects again, allowing margins to decline through excessive reliance on business partners, or retaining too much cash. Revenue of 10.0 billion yen or 15.0 billion yen would be important milestones, but the ultimate requirement is growth in EPS, ROE, ROIC, and free cash flow. Our analysis will therefore continue to assess capital efficiency and per-share value, not merely the achievement of revenue targets.
CNS’s project-based approach combines short-term order volatility with long-term customer relationships. When quarterly revenue is weak, investors must distinguish among customer investment delays, reduced competitiveness, and deliberate withdrawal from low-margin projects. The prior-year revenue miss reflected both weak year-end demand and project exits. Going forward, revenue changes should be assessed together with backlog, project count, pricing, gross margin, and the status of recurring customer relationships.
The reason forecast net income growth of 14.9% in fiscal May 2027 is well below the operating profit growth of 40.9% is that prior-year net income included a one-time benefit from a reassessment of tax-effect accounting. EPS growth alone may therefore appear modest; operating profit and the operating margin are more appropriate indicators of underlying earnings power. With the one-time factor absent in subsequent years, investors should examine whether operating-profit growth translates more directly into EPS growth.
A dividend yield above 4% supports holding-period returns, but the dividend is not the primary driver of the investment view. The principal expected return is share price appreciation as the gap between corporate and market value narrows. If the company can combine earnings growth with disciplined capital allocation, investors can receive dividends while waiting for a re-rating. If earnings stagnate and capital allocation does not progress, however, dividends alone will not compensate for the long-term opportunity cost.
The investment-view upgrade is not based solely on the high figures in the company plan. We place greater weight on the fact that the previously identified conditions, margin improvement, expansion of priority growth businesses, and progress in capital allocation, are now in place. At the same time, the current share price does not fully reflect them. If these conditions deteriorate in future results, the Bullish view should not be treated as permanent; it should be reassessed based on segment margins and capital efficiency.
Conclusion
CNS is evolving from a cash-rich value stock into a company in which margin improvement and capital allocation are advancing in tandem. Fiscal May 2026 revenue fell short of plan, but the company improved the operating margin while exiting low-margin projects. Generative AI projects in Technology Solutions and upstream engagements in Consulting raised company-wide profitability. Challenges remain in Business Solutions, ERP, and recruitment.
The fiscal May 2027 plan is ambitious, particularly the expected profit improvement in Business Solutions, and requires verification. Nevertheless, at 1,720 yen, the shares trade at a forward PER of 7.4 times, a PBR of 1.15 times, and a dividend yield of 4.1%, while the net cash-adjusted PER is only about 1.8 times. Even if the company falls moderately short of its plan, the operating business would remain materially undervalued.
The conditions for a re-rating are ERP orders, growth in priority businesses, prime engagements, progress toward a 10% operating margin, disciplined M&A, and measures to improve liquidity. If these become visible in the numbers, we believe the share price could move toward the central valuation range of 2,200 yen to 3,200 yen. The shares may experience a near-term pullback after the post-earnings rise. However, over the medium- to long-term, the gap between corporate value and market value is likely to narrow as earnings grow, dividends rise, and capital allocation advances. Our investment view is Bullish.
Key stock price data
Key financial data
| Unit: million yen | 2022 | 2023 | 2024 | 2025 | 2026 CE |
| Sales | 5,989 | 6,657 | 7,005 | 7,774 | 9,278 |
| EBIT (Operating Income) | 559 | 620 | 555 | 685 | 966 |
| Pretax Income | 589 | 636 | 583 | 772 | |
| Net Profit Attributable to Owner of Parent | 433 | 461 | 427 | 591 | 679 |
| Cash & Short-Term Investments | 3,163 | 3,574 | 3,667 | 3,787 | |
| Total assets | 4,547 | 4,934 | 5,260 | 5,857 | |
| Total Debt | 13 | 11 | 8 | 5 | |
| Net Debt | -3,150 | -3,563 | -3,659 | -3,782 | |
| Total liabilities | 1,206 | 1,262 | 1,300 | 1,524 | |
| Total Shareholders’ Equity | 3,341 | 3,672 | 3,959 | 4,332 | |
| Net Operating Cash Flow | 353 | 565 | 444 | 580 | |
| Capital Expenditure | 59 | 11 | 24 | 405 | |
| Net Investing Cash Flow | -126 | -81 | -269 | -299 | |
| Net Financing Cash Flow | -133 | -134 | -142 | -221 | |
| Free Cash Flow | 344 | 554 | 429 | 175 | |
| ROA (%) | 9.96 | 9.73 | 8.38 | 10.63 | |
| ROE (%) | 13.58 | 13.16 | 11.20 | 14.25 | |
| EPS (Yen) | 149.0 | 158.8 | 147.1 | 203.3 | 233.7 |
| BPS (Yen) | 1,149.7 | 1,263.5 | 1,362.5 | 1,490.8 | |
| Dividend per Share (Yen) | 45.00 | 48.00 | 75.00 | 61.00 | 70.00 |
| Shares Outstanding (Million shares) | 2.91 | 2.91 | 2.91 | 2.91 |
Source: Calculated by Omega Investment based on FactSet’s standard criteria, rounded to the nearest whole number.
Share price
Financial data (quarterly basis)
| Unit: million yen | 2024/8 | 2025/5 | 2026/5 | ||||||
| 4Q | 1Q | 2Q | 3Q | 4Q | 1Q | 2Q | 3Q | 4Q | |
| (Income Statement) | |||||||||
| Sales | 1,677 | 1,645 | 1,720 | 1,823 | 1,818 | 1,875 | 1,879 | 1,965 | 2,057 |
| Year-on-year | 3.5% | -0.1% | 4.2% | 8.3% | 8.4% | 14.0% | 9.2% | 7.8% | 13.1% |
| Cost of Goods Sold (COGS) | 1,278 | 1,266 | 1,294 | 1,368 | 1,370 | 1,386 | 1,414 | 1,497 | 1,574 |
| Gross Income | 399 | 378 | 425 | 455 | 448 | 488 | 465 | 467 | 483 |
| Gross Income Margin | 23.8% | 23.0% | 24.7% | 24.9% | 24.7% | 26.0% | 24.7% | 23.8% | 23.5% |
| SG&A Expense | 292 | 298 | 279 | 260 | 314 | 306 | 296 | 271 | 344 |
| EBIT | 108 | 80 | 146 | 195 | 134 | 182 | 168 | 196 | 139 |
| Year-on-year | -6.8% | -43.6% | -19.5% | 3.0% | 24.9% | 128.7% | 15.0% | 0.5% | 3.4% |
| Operating Income Margin | 6.4% | 4.8% | 8.5% | 10.7% | 7.4% | 9.7% | 9.0% | 10.0% | 6.8% |
| EBITDA | 117 | 88 | 155 | 209 | 150 | 195 | 184 | 218 | 165 |
| Pretax Income | 123 | 81 | 160 | 202 | 140 | 229 | 177 | 210 | 156 |
| Consolidated Net Income | 111 | 55 | 107 | 137 | 128 | 155 | 119 | 142 | 176 |
| Minority Interest | 0 | 0 | 0 | 0 | 0 | 0 | 0 | 0 | 0 |
| Net Income ATOP | 111 | 55 | 107 | 137 | 128 | 155 | 119 | 142 | 176 |
| Year-on-year | -5.7% | -38.4% | -18.2% | 5.5% | 15.3% | 181.6% | 10.8% | 3.1% | 37.4% |
| Net Income Margin | 6.6% | 3.3% | 6.2% | 7.5% | 7.0% | 8.3% | 6.3% | 7.2% | 8.5% |
| (Balance Sheet) | |||||||||
| Cash & Short-Term Investments | 3,574 | 3,372 | 3,382 | 3,355 | 3,667 | 3,479 | 3,657 | 3,304 | 3,787 |
| Total assets | 4,934 | 4,732 | 5,005 | 4,946 | 5,260 | 5,172 | 5,831 | 5,428 | 5,857 |
| Total Debt | 11 | 10 | 9 | 9 | 8 | 7 | 6 | 6 | 5 |
| Net Debt | -3,563 | -3,362 | -3,372 | -3,346 | -3,659 | -3,472 | -3,651 | -3,298 | -3,782 |
| Total liabilities | 1,262 | 1,145 | 1,311 | 1,114 | 1,300 | 1,275 | 1,816 | 1,271 | 1,524 |
| Total Shareholders’ Equity | 3,672 | 3,587 | 3,694 | 3,832 | 3,959 | 3,896 | 4,015 | 4,157 | 4,332 |
| (Profitability %) | |||||||||
| ROA | 9.73 | 9.34 | 8.38 | 8.54 | 8.38 | 10.65 | 9.94 | 10.47 | 10.63 |
| ROE | 13.16 | 12.40 | 11.32 | 11.10 | 11.20 | 14.09 | 13.98 | 13.60 | 14.25 |
| (Per-share) Unit: JPY | |||||||||
| EPS | 38.1 | 18.9 | 36.9 | 47.3 | 44.0 | 53.3 | 40.9 | 48.8 | 60.4 |
| BPS | 1,263.5 | 1,234.4 | 1,271.3 | 1,318.6 | 1,362.5 | 1,340.8 | 1,381.7 | 1,430.5 | 1,490.8 |
| Dividend per Share | 48.00 | 0.00 | 0.00 | 0.00 | 75.00 | 0.00 | 0.00 | 0.00 | 61.00 |
| Shares Outstanding(million shares) | 2.91 | 2.91 | 2.91 | 2.91 | 2.91 | 2.91 | 2.91 | 2.91 | 2.91 |
Source: Calculated by Omega Investment based on FactSet’s standard criteria, rounded to the nearest whole number.
Financial data (full-year basis)
| Unit: million yen | 2021 | 2022 | 2023 | 2024 | 2025 |
| (Income Statement) | |||||
| Sales | 5,419 | 5,989 | 6,657 | 7,005 | 7,774 |
| Year-on-year | 11.9% | 10.5% | 11.1% | 5.2% | 11.0% |
| Cost of Goods Sold | 4,097 | 4,483 | 5,018 | 5,298 | 5,871 |
| Gross Income | 1,322 | 1,506 | 1,639 | 1,707 | 1,903 |
| Gross Income Margin | 24.4% | 25.1% | 24.6% | 24.4% | 24.5% |
| SG&A Expense | 789 | 947 | 1,019 | 1,151 | 1,218 |
| EBIT | 533 | 559 | 620 | 555 | 685 |
| Year-on-year | 16.4% | 4.8% | 10.9% | -10.4% | 23.4% |
| Operating Income Margin | 9.8% | 9.3% | 9.3% | 7.9% | 8.8% |
| EBITDA | 559 | 589 | 654 | 601 | 763 |
| Pretax Income | 595 | 589 | 636 | 583 | 772 |
| Consolidated Net Income | 409 | 433 | 461 | 427 | 591 |
| Minority Interest | 0 | 0 | 0 | 0 | 0 |
| Net Income ATOP | 409 | 433 | 461 | 427 | 591 |
| Year-on-year | 21.6% | 5.8% | 6.5% | -7.4% | 38.3% |
| Net Income Margin | 7.6% | 7.2% | 6.9% | 6.1% | 7.6% |
| (Balance Sheet) | |||||
| Cash & Short-Term Investments | 3,010 | 3,163 | 3,574 | 3,667 | 3,787 |
| Total assets | 4,152 | 4,547 | 4,934 | 5,260 | 5,857 |
| Total Debt | 6 | 13 | 11 | 8 | 5 |
| Net Debt | -3,004 | -3,150 | -3,563 | -3,659 | -3,782 |
| Total liabilities | 1,113 | 1,206 | 1,262 | 1,300 | 1,524 |
| Total Shareholders’ Equity | 3,039 | 3,341 | 3,672 | 3,959 | 4,332 |
| (Cash Flow) | |||||
| Net Operating Cash Flow | 461 | 353 | 565 | 444 | 580 |
| Capital Expenditure | 19 | 59 | 11 | 24 | 405 |
| Net Investing Cash Flow | -23 | -126 | -81 | -269 | -299 |
| Net Financing Cash Flow | 634 | -133 | -134 | -142 | -221 |
| Free Cash Flow | 450 | 344 | 554 | 429 | 175 |
| (Profitability ) | |||||
| ROA (%) | 11.23 | 9.96 | 9.73 | 8.38 | 10.63 |
| ROE (%) | 16.27 | 13.58 | 13.16 | 11.20 | 14.25 |
| Net Margin (%) | 7.56 | 7.23 | 6.93 | 6.10 | 7.60 |
| Asset Turn | 1.49 | 1.38 | 1.40 | 1.37 | 1.40 |
| Assets/Equity | 1.45 | 1.36 | 1.35 | 1.34 | 1.34 |
| (Per-share) Unit: JPY | |||||
| EPS | 145.5 | 149.0 | 158.8 | 147.1 | 203.3 |
| BPS | 1,045.7 | 1,149.7 | 1,263.5 | 1,362.5 | 1,490.8 |
| Dividend per Share | 45.00 | 45.00 | 48.00 | 75.00 | 61.00 |
| Shares Outstanding (million shares) | 2.91 | 2.91 | 2.91 | 2.91 | 2.91 |
Source: Calculated by Omega Investment based on FactSet’s standard criteria, rounded to the nearest whole number.