2026-10-23
Home
Japanese

Omega Investment Co., Ltd.
Kidswell Bio (Investment report – Basic)
| Share price (9/7) | ¥164 | Dividend Yield (27/3 CE) | 0.0 % |
| 52weeks high/low | ¥125/320 | ROE(26/3 act) | -28.1 % |
| Avg Vol (3 month) | 667.1 thou shrs | Operating margin (26/3 act) | -2.1 % |
| Market Cap | ¥8.29 bn | Beta (5Y Monthly) | 1.21 |
| Enterprise Value | ¥7.23 bn | Shares Outstanding | 50.582 mn shrs |
| PER (27/3 CE) | – X | Listed market | TSE Growth |
| PBR (26/3 act) | 4.5 X |
| Click here for the PDF version of this page |
| PDF version |
A turning point toward becoming a biotech company with an earnings base
Profit establishment in biosimilars and commercialization of SQ-SHED will determine the next stage of corporate value
Investment conclusion
The investment stance toward Kidswell Bio is to maintain the previous bullish view. In this basic report, greater emphasis is placed not on operating profitability itself in 1Q FY3/2027, but on the fact that the Company is beginning to move away from the challenges it has faced over the past several years – earnings instability, dependence on external financing for R&D funding, and share dilution – and is starting to transition into a company that can invest in the next stage of growth based on profits from already-launched biosimilars. From FY3/2022 to FY3/2026, sales expanded significantly, while profits and cash flow remained unstable, and business growth did not necessarily translate into higher per-share value. The Company is now at a turning point in evaluating whether that long-term constraint will change. In 1Q FY3/2027, net sales decreased 26.2% YoY to 1.270 billion yen, while the Company secured operating profit of 217 million yen and a gross margin of 34.0%. Because R&D expenses will increase from 2Q onward, this profit level cannot simply be extrapolated to the full year. Nevertheless, the Company’s ability to retain profit despite lower sales through price revisions and cost reductions is an important initial check on the medium- to long-term earnings structure.
The factors supporting the investment stance extend beyond near-term profitability. Over a one- to two-year time horizon, the key questions are whether operating profitability in already-launched biosimilars becomes established even as R&D expenses rise, and whether new biosimilars emerge as the next earnings source. Over the medium term, the composition of corporate value may change if domestic manufacturing facilities improve supply stability and cost competitiveness, and SQ-SHED advances into corporate clinical trials in Japan and overseas. In biosimilars, margin improvements for already-launched products, joint development of new candidates, and construction of domestic manufacturing facilities are progressing in parallel. In cell therapy, with cerebral palsy as the most important indication, Nagoya University has completed 52-week follow-up observations for all three cases in its clinical research; preparations for a corporate clinical trial with Mochida Pharmaceutical are progressing in Japan. The development framework with Treehill Partners and preparations for an IND application are moving forward in the United States. In addition, the Company has completed the exercise of the 24th series of stock acquisition rights, fully converted the 4th series of convertible bonds, and arranged a 2.5 billion yen syndicated loan, improving the structure under which growth funding had depended only on the equity market.
However, three points still need confirmation before judging that this transition has taken hold. First, GBS-007 may face pressure on sales volume due to the entry of Eylea authorized generics and other companies’ aflibercept biosimilars, and it will be necessary to confirm whether gross profit in the existing business can be protected through price revisions and cost reductions. Second, R&D expenses in 1Q were 33 million yen, significantly lower than 212 million yen in the same period of the previous year, and whether the Company can maintain operating profitability even after expenses increase from 2Q onward will determine the true value of the earnings base. Third, 1,374,600 shares under the 23rd series of stock acquisition rights remain outstanding, and large-scale clinical expenses for cell therapy will arise in the future, so dilution concerns have not disappeared completely. Therefore, this report tracks gross margin, operating cash flow, funding methods, and clinical development progress over multiple years, rather than focusing on operating profit in a single quarter.
A share price of 163 yen, a market capitalization of 8.25 billion yen, and an actual PBR of 5.03x are difficult to describe as undervalued if judged only by current profits. However, for a medium- to long-term investment judgment, it is necessary to evaluate whether the Company can transition from an R&D-oriented biotech company premised on losses into a company that pursues the growth value of cell therapy while having profits from existing businesses. Based on our estimates using PBR, DCF, and ROIC methods, the fair share price ranges from 145 yen to 235 yen, and the median of the three methods is around 180 yen, with the current share price below that median. If operating profitability and progress in new biosimilars are confirmed over the next one to two years, and domestic manufacturing and clinical development of SQ-SHED become more concrete over the medium term, the current valuation framework itself may change. Therefore, the current phase should be positioned not as one in which short-term profits are pursued, but as one in which the process of transforming the corporate structure is evaluated over the medium to long term.
1. Medium- to long-term positioning: a turning point from an R&D-front-loaded company to a biotech company with an earnings base
To understand the Company today, it is necessary to look not only at operating profitability in 1Q, but also at changes in its business structure over roughly the past five years. Net sales expanded from 1.569 billion yen in FY3/2022 to 6.590 billion yen in FY3/2026, and the number of launched biosimilar products and supply volume increased. Meanwhile, profit & loss and cash flow fluctuated significantly due to R&D expenses, foreign exchange, manufacturing costs, inventories and advances paid, and financing. The number of shares also increased, and the difficulty of seeing growth in per-share value even as the scale of the business expanded has weighed on long-term share price valuation.
If the past several years are regarded as the first stage, the Company succeeded in launching biosimilars and building sales scale, but did not reach the point of establishing stable profits and an autonomous funding cycle. In the second stage, which is now beginning, the challenge will be to generate profit through price revisions, cost reductions, and manufacturing and delivery management for already-launched biosimilars, and to reinvest that funding into new biosimilars, domestic manufacturing, and SQ-SHED. If this becomes established, the Company can move away from its previous structure, under which R&D progress tended to lead directly to additional equity financing.
Over one to two years, key points to confirm are continued operating profitability, progress in new biosimilars, the competitive impact on GBS-007, and cash-generating capacity after higher R&D expenses. Over the medium term, domestic manufacturing operations, preparations for commercializing new biosimilars, and domestic corporate clinical trials and U.S. clinical development of SQ-SHED will determine corporate value. In other words, improvement in short-term profits is not the objective itself, but a condition for the Company to transition into an enterprise that can generate its own future development funding.
From this perspective, 1Q FY3/2027 should be positioned not as a completed form, but as initial verification of structural transformation. The fact that the Company secured higher operating profit despite lower sales indicates that a mechanism for generating profit without relying solely on sales-volume expansion has begun to function. At the same time, R&D expenses will increase going forward, and the competitive impact on GBS-007 remains, so it is necessary to watch whether the same structure can be maintained over the next several quarters. This report evaluates the current phase not simply as a follow-up to strong results, but as a turning point to test whether past growth investment can be converted into sustainable shareholder value.
2. 1Q results: profit growth despite lower sales as initial verification of structural transformation
Consolidated results for 1Q FY3/2027 were net sales of 1.270 billion yen, gross profit of 431 million yen, operating profit of 217 million yen, ordinary profit of 204 million yen, and quarterly net income of 198 million yen. This report views this quarter not in isolation, but as evidence for assessing whether the gap between sales expansion and earnings instability that has persisted over the past several years has begun to narrow. Net sales and gross profit were below the same period of the previous year, but operating profit, ordinary profit, and quarterly net income exceeded the previous year. The Company explained that the decline in net sales was due to fewer deliveries of some biosimilar APIs and other products, while manufacturing and deliveries proceeded as planned. The important point is that profit increased despite lower sales.
Gross margin was 34.0%, improving 7.5 percentage points from 26.5% for full-year FY3/2026. Although it was slightly below 34.7% in the same period last year, it clearly recovered from 25.4% in 2Q FY3/2026, 19.4% in 3Q, and 26.6% in 4Q. In the previous fiscal year, margins were unstable due to the overlapping effects of the weaker yen, manufacturing costs, and manufacturing process issues. This time, the Company secured a certain level of gross margin despite the continuing headwind of further yen depreciation, suggesting that the effects of supply price revisions and the switch to products with lower manufacturing costs have begun to appear.
The operating margin was high at 17.1%, but this should not be regarded as a steady-state margin. R&D expenses were limited to 33 million yen, down 179 million yen from 212 million yen in the same period of the previous year. The Company states that R&D expenses will begin to be recorded in earnest from 2Q onward, and investment will continue in domestic and overseas clinical development for cerebral palsy, new biosimilars, and manufacturing process development. Other SG&A expenses also declined due to an organizational structure review and operational efficiency improvements, so both margin improvement and the timing of expense recognition contributed to higher operating profit in 1Q. Therefore, investors should focus from 2Q onward not on the level of operating profit itself, but on whether gross margin improvement can support operating profitability even as R&D expenses rise.
The Company has maintained its forecast of net sales of 5.0-6.0 billion yen and operating profit of 100-600 million yen. As of 1Q, operating profit exceeded the lower end of the range, but it is reasonable that the Company has not raised the forecast. The competitive impact on GBS-007 is still under detailed examination, and R&D expenses will increase going forward. At present, the likelihood of achieving operating profitability has increased, but it is not yet the stage to value the share price based on the upper end of 600 million yen.
| million yen | FY3/2026 1Q | FY3/2027 1Q | YoY |
| Net sales | 1,721 | 1,270 | -26.2% |
| Gross profit | 597 | 431 | -27.8% |
| Gross margin | 34.7% | 34.0% | -0.7pt |
| R&D expenses | 212 | 33 | -84.6% |
| Operating profit | 185 | 217 | +17.3% |
| Operating margin | 10.7% | 17.1% | +6.4pt |
| Quarterly net income | 157 | 198 | +26.0% |
Source: Kidswell Bio FY/2026 1Q supplementary results materials, FactSet.
Figure 1. Quarterly gross margin and operating profit trend

Source: Prepared by Omega Investment based on FactSet data. From 1Q FY3/2025 to 1Q FY3/2027.
3. Biosimilar business: earnings improvement in launched products and the next growth base
The first pillar supporting the Company’s medium- to long-term corporate value is whether already-launched biosimilars can be matured from a temporary source of sales into a business that generates stable profits and cash. Among R&D-oriented companies, the Company’s biosimilar business is unusual in that it can earn continuous sales and gross profit from supplying APIs and drug products for launched products. The current major launched products are filgrastim GBS-001, darbepoetin alfa GBS-011, ranibizumab GBS-007, and pegfilgrastim GBS-010. In FY3/2026, consolidated net sales expanded to 6.590 billion yen, and the long-term sales scale changed significantly. However, the previous fiscal year also showed that higher net sales alone do not increase corporate value. This was because the weaker yen, manufacturing costs at overseas CDMOs, and manufacturing process issues pressured profits.
A key change this fiscal year is that the Company has placed margin normalization at the center of its business operations. In 3Q FY3/2025 and 3Q FY3/2026, the Company implemented supply price revisions for different portions of APIs and other products, respectively, and from 4Q FY3/2026, it switched some products to those with lower manufacturing costs. In 1Q, the effects appeared in gross margin. Going forward, the Company will also add manufacturing sites and expand manufacturing volume for other APIs and other products to improve both profitability and supply stability. The biosimilar business should be evaluated not only by volume growth, but as a business that manages supply prices, manufacturing costs, delivery volume, the number of manufacturing sites, foreign exchange, and product mix in an integrated manner.
This change is directly linked to stable corporate value. Cell therapy development expenses tend to be large, and relying solely on external funding would lead to repeated share dilution. If already-launched biosimilars generate stable gross profit, the Company can fund part of its R&D expenses by itself. In FY3/2026, it secured non-consolidated operating profit of 434 million yen, and the existing business has become a base that supports R&D investment. In 1Q FY3/2027, the Company also secured consolidated operating profitability, indicating that this structure has advanced one step from the previous fiscal year.
Nevertheless, caution is needed regarding competition for GBS-007. Since January 2026, Eylea authorized generics and aflibercept biosimilars have launched, and the Company is examining the impact on GBS-007 sales and profits in detail with partner pharmaceutical companies. In ophthalmology, the more products there are in the same mechanism area, the more pressure will be applied to both volume and price. Therefore, GBS-007 sales volume should be viewed conservatively. On the other hand, intensified competition does not need to be treated as synonymous with deterioration in company-wide profits. If gross profit can be supplemented through supply price revisions, cost reductions, product mix, and new product deliveries, profits can be protected even if volume declines. 1Q showed precisely that possibility.
In subsequent results, key points to watch are delivery volume and sales composition for GBS-007, gross margin, the share of products with lower manufacturing costs, progress in approvals for additional manufacturing sites, and delivery stability for other launched products, including GBS-010. As the Company refines its earnings forecast, the extent to which it has factored the impact on GBS-007 into the range will also be important. Competition is intensifying, but because the Company is advancing margin improvement measures ahead of time, there is no need at present to take a bearish view on the biosimilar business as a whole.
Figure 2. Long-term trend in sales, operating profit and gross margin

Source: Prepared by Omega Investment based on FactSet data. Actual results from FY3/2021 to FY3/2026; company forecast range for FY3/2027 sales and operating profit.
New biosimilars and domestic manufacturing: building medium-term earnings sources
Looking to the medium term, improvement in profits from the four existing products alone will not be sufficient to sustain growth. If the Company relies only on the four existing products, sales and profits will eventually mature due to drug price revisions and competing entries. Therefore, the Company is jointly developing multiple new biosimilars with Chiome Bioscience, Alfresa Holdings, and Mycenax Biotech. Cell line construction is progressing, and the Company continues to consider additional candidate products. The names and target diseases of the new products have not been disclosed, but the contracts provide for the Company to receive consideration from Alfresa Holdings according to development progress, and in FY3/2026, a portion was recorded as sales revenue. This is important for the Company, which faces capital constraints.
The domestic manufacturing facility is especially significant. The Company was selected for the Ministry of Health, Labor and Welfare’s support program to develop domestic manufacturing facilities for biosimilars and, in collaboration with Alfresa Holdings, Chiome Bioscience, and Mycenax, is constructing API and drug product manufacturing facilities on the premises of Alfresa Fine Chemical in Akita Prefecture. Through the joint venture Alfenax Biologics, the Company envisions not only commercially manufacturing its jointly developed products in the future, but also expanding into the biopharmaceutical CDMO business.
This initiative is not merely a new source of sales; it also addresses weaknesses in the Company’s existing business. The current biosimilar business depends heavily on overseas CDMOs, and the weaker yen and overseas inflation affect manufacturing costs. Manufacturing process issues can also affect delivery volume and inventories. Stable domestic manufacturing could diversify supply risk, improve management of manufacturing lead times, and reduce foreign-exchange sensitivity. In addition, when the Company expands new biosimilars overseas, a domestic manufacturing track record may work favorably in partner negotiations.
That said, a factory does not generate profit immediately simply because it is constructed. Facility utilization, quality certification, commercial manufacturing orders, and manufacturing costs must be economically rational. The Company’s direct investment burden and the joint venture’s financing terms should also be confirmed. Therefore, this report evaluates the domestic manufacturing facility not as a near-term earnings upside, but as a medium-term asset that supports supply stability and expands the earnings base over the medium term.
| Role in corporate value formation | Key KPIs | Main upside factors | Main downside factors |
| Already-launched biosimilars | Delivery volume, supply prices, gross margin, manufacturing costs |
Price revisions, cost reductions, stable supply |
GBS-007 competition, weaker yen, manufacturing problems |
| New biosimilars | Cell line construction, joint development agreements, development consideration |
Additional candidates, overseas partners |
Development delays, higher development expenses |
| Domestic manufacturing and CDMO | Construction progress, facility completion, start of operation, utilization and orders |
Stable supply, lower FX sensitivity, external orders |
Startup delays, low utilization, additional funding burden |
Source: Compiled by Omega Investment based on company materials.
4. Cell therapy: the next stage of converting research assets into corporate value
The cell therapy business is the second pillar that will significantly affect corporate value over the medium term. Using SQ-SHED, stem cells from human exfoliated deciduous teeth independently developed by subsidiary S-Quatre, the business is currently converting research assets into clinical and commercial value rather than contributing to profits. In March 2026, the Company reorganized its R&D structure and announced a policy of concentrating management resources on cerebral palsy as the most important indication. This should be evaluated as the Company having entered a stage of concentrating personnel and capital in the area where commercialization certainty can most easily be raised, rather than simply expanding the number of research themes.
For cerebral palsy, administration has been completed for all three cases in the investigator-initiated clinical research using autologous SQ-SHED led by Nagoya University. By May 2026, one-year post-administration follow-up observations had been completed for all cases. In the interim analysis announced in November 2025, the study confirmed safety and tolerability and reported improvement in motor function. The final analysis results scheduled for 2026 will be an important factor that reinforces the scientific basis for future corporate clinical trials. Because the number of cases is small (three), these results alone cannot establish efficacy, but they are meaningful as data supporting the rationale for proceeding to the next clinical stage.
In domestic corporate clinical trials, preparations are progressing for GCT-103, allogeneic SQ-SHED, under the joint commercialization agreement with Mochida Pharmaceutical. Mochida Pharmaceutical is mainly responsible for clinical trials and related matters, while S-Quatre is mainly responsible for manufacturing and related matters. After trial manufacturing, preparations for full-scale GMP manufacturing are underway, and the next major milestones will be submitting the clinical trial notification and starting the clinical trial. What matters for investors is not the number of research results, but how clearly the timing of the clinical trial start, case scale, cost burden, and future sales and manufacturing terms become.
In the United States, the Company held a Pre-IND Meeting with the FDA in October 2025 and obtained agreement and advice regarding the corporate clinical trial plan. In February 2026, the Company reached a preliminary agreement with Treehill Partners to establish a new U.S. company and indicated a policy of jointly advancing overseas clinical development and fundraising. U.S. expansion will significantly impact corporate value, but development expenses will also increase substantially. Therefore, the timing of the IND application, the new company’s capital structure, Kidswell Bio’s equity interest, the amount raised from external investors, and the sharing of clinical trial expenses will be central to valuation.
On the manufacturing side of SQ-SHED, the Company is developing a large-scale culture process in cooperation with Corning Life Sciences and working with Nipro to establish a manufacturing process with late-stage clinical trials and commercial manufacturing in mind. In cell therapy, commercialization requires not only clinical data but also the ability to manufacture large volumes with consistent quality. Manufacturing yield, equivalence of cell characteristics, cost, and scale-up should be viewed as KPIs that are as important as the start of clinical trials.
Outside cerebral palsy, the Company is preparing to start clinical research on GCT-102 for congenital intestinal neuropathy with Kyushu University. It has also indicated potential applications in osteonecrosis of the femoral head, gene-modified SQ-SHED, regulatory T cells, oncolytic viruses, and exosomes. However, these should not carry the same weight in corporate valuation. At present, cerebral palsy is closest to commercialization, and other research should be positioned as future development candidates. The sheer number of research themes should not be considered value; value should be assessed by progress toward clinical transition, external funding, and concrete alliance terms.
| Pipeline | Current stage | Items to confirm next | Positioning from an investor perspective |
| GCT-103 cerebral palsy | 52-week follow-up in clinical research completed; domestic and overseas clinical trial preparations |
Final analysis, domestic clinical trial notification, U.S. IND application, funding allocation |
Largest impact on corporate value |
| GCT-102 congenital intestinal neuropathy | AMED adoption; clinical research preparations | Case enrollment, manufacturing, initial safety | Development project with public support through AMED adoption |
| SQ-104 osteonecrosis of the femoral head | Preclinical stage | Conditions for clinical transition | Medium- to long-term candidate |
| Other applied research | Research and consideration of application potential | External alliances, indication selection | Valuation remains limited at present |
Source: Compiled by Omega Investment based on Kidswell Bio FY2026 1Q supplementary results materials and the notice of convocation of the general meeting of shareholders.
5. Capital policy, financial position and shareholder composition: supporting growth investment while limiting dilution
When considering the Company’s long-term shareholder value, the financing structure is as important as business development. For R&D-oriented companies, even if business value improves, repeated share issuance makes it difficult for per-share value to increase. Kidswell Bio has also secured development funding over the past several years through convertible bonds and stock acquisition rights. Hence, at times the potential supply of shares weighed on share price valuation even as the business moved forward. The focus in the next stage is whether this constraint can be weakened by combining profits from the existing business, bank borrowings, and funding from alliance partners.
The 24th series of stock acquisition rights has been fully exercised, completing the financing. The 4th series of unsecured convertible bonds with stock acquisition rights was fully converted in July 2026. In addition, in November 2025, the Company arranged a syndicated loan totaling 2.5 billion yen with a five-year term, with Mizuho Bank as arranger. By combining borrowings from financial institutions, the need to raise all development funding from the equity market has decreased. This can be evaluated favorably from a per-share shareholder-value perspective.
On the other hand, 1,374,600 shares remain under the 23rd series of stock acquisition rights, and the exercise period runs until January 2028. This is equivalent to approximately 2.7% of the current 50.583 million shares outstanding, so equity financing has not ended completely. However, compared with the previous situation, when both convertible bonds and the 24th series of stock acquisition rights remained outstanding at the same time, potential dilution has declined significantly. In line with the Company’s wording, this can be evaluated as progress in refinancing toward early completion of financing.
At the end of 1Q, cash and deposits were 3.234 billion yen and total interest-bearing debt was 2.475 billion yen, resulting in net cash of 759 million yen on a simple difference basis. However, working capital required for biosimilar manufacturing is large, including advances paid of 1.342 billion yen and work-in-process of 414 million yen. Therefore, all cash and deposits should not be regarded as freely usable surplus funds. Even so, the coexistence of operating profitability and bank borrowings increases the possibility of funding clinical development expenses for cell therapy without relying solely on share issuance. Key points to watch going forward are the exercise status of the 23rd series of stock acquisition rights, external fundraising terms for the Treehill new company, the additional funding burden for domestic manufacturing facilities, and improvements in operating cash flow.
Figure 3. Trends in cash and deposits, interest-bearing debt, and shareholders’ equity

Source: Company IR materials, FactSet. Dilution rate is based on Omega Investment calculations against 50.583 million shares outstanding.
| Financing method | Current status | Assessment for shareholder value |
| 24th series of stock acquisition rights | Fully exercised | Additional dilution factor has been eliminated |
| 4th series of convertible bonds | Full conversion completed in July 2026 | Major concern over share supply on the upside has receded |
| 23rd series of stock acquisition rights | 1,374,600 shares remain outstanding | Potential dilution of approximately 2.7% remains |
| Syndicated loan | 2.5 billion yen, five-year term | Contributes to reducing dependence on equity financing |
Source: Company IR materials, FactSet. Dilution rate is based on Omega Investment calculations against 50.583 million shares outstanding.
Shareholder composition: a broader investor base is also needed for long-term re-rating
According to FactSet data, Noritsu Koki is the largest shareholder with 18.72%, followed by NANO Holdings at 1.98%, Heights Capital Management at 1.87%, Mr. Fumishige Ehira at 1.87%, JSR at 1.36%, and Senju Pharmaceutical at 1.10%. Internal stakeholders hold 27.87%, and the free float ratio is 72.1%. Although Noritsu Koki has a large shareholder, the institutional investor holding ratio remains only 1.99%.
This shareholder composition has both advantages and disadvantages. Large stable shareholders tend to stabilize short-term supply and demand, and business-company shareholders can also be expected to align with alliance relationships. On the other hand, because institutional investor participation is limited, the share price may not rise immediately even if operating profitability is established or pipeline progress is achieved. Conversely, if consolidated operating profit becomes established and clinical development becomes more concrete, the Company is recognized as an investable small-cap growth stock; expansion of the institutional investor base itself may lead to a change in share price valuation.
In addition, as a result of the exercise of potential shares, shares outstanding have increased to 50.583 million shares. In share price analysis, it is necessary to consider the increase in shares outstanding, rather than simply comparing past per-share indicators with current figures. Going forward, it will be important whether profit growth exceeds the increase in shares outstanding and whether EPS and BPS can grow sustainably on a per-share basis.
| Shareholder | Holding ratio | Shares held (thousand shares) |
| Noritsu Koki | 18.72% | 9,468 |
| NANO Holdings | 1.98% | 1,000 |
| Heights Capital Management | 1.87% | 947 |
| Fumishige Ehira | 1.87% | 947 |
| JSR | 1.36% | 687 |
| Senju Pharmaceutical | 1.10% | 555 |
| Shinya Kurebayashi | 0.17% | 87 |
Source: FactSet Ownership, as of August 12, 2026.
6. Share price and valuation: the current position between short-term concerns and medium- to long-term value
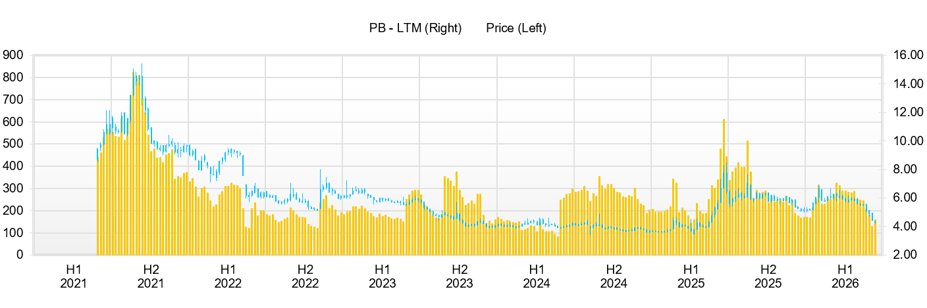
In February 2026, the share price rose to a high of 301 yen following the preliminary agreement with Treehill Partners to establish a new U.S. company. It subsequently entered a downtrend, closing at 163 yen on August 14. From the perspective of this report, this decline should be viewed not merely as a reaction to recent catalysts, but as the result of the market’s lingering distrust regarding profitability, competition, and dilution that has accumulated over the past several years. While the Company’s fundamentals have begun to change, the equity market appears to be waiting to confirm the sustainability of that change before revising its valuation.
First is the competitive environment for GBS-007. The entry of Eylea authorized generics and other companies’ biosimilars has created uncertainty around volume growth for launched products that account for a large portion of sales. Second, the failure to achieve operating profitability in FY3/2026 lowered confidence in the timing of achievement of the Company’s plan. Third, the potential share supply from convertible bonds and stock acquisition rights continued, and even when positive news was released, the market tended to focus on new share supply when the share price rose. Fourth, although cell therapy research results have improved, the timing of clinical trial starts, alliance terms, and external fundraising linked to sales and profits has not yet been finalized. Fifth, the high margin in 1Q was affected by the timing of R&D expense recognition, and the market has not yet been able to confirm the sustainability of annual profits.
Therefore, it is not appropriate to simplify the situation as one in which the business is advancing across the board while only the share price has fallen irrationally. The current state is that improvements have begun in the three areas the market has been concerned about – profitability, competition, and dilution – but those concerns have not been fully resolved. However, with the full conversion of convertible bonds in July and operating profitability in 1Q, concerns over profitability and dilution have receded considerably compared with the previous report. If the competitive impact on GBS-007 is limited and operating profitability can be maintained even as R&D expenses rise, the assumptions underlying share price formation will change.
At a share price of 163 yen, market capitalization is 8.25 billion yen. Although this has recovered from 137 yen at the time of the previous report, it is almost half the market capitalization of approximately 15.2 billion yen at the February high of 301 yen. The market is not valuing SQ-SHED’s future value at zero, but it appears to be applying a large discount to the probability of commercialization. The next share price catalysts will not be simple research announcements, but information directly linked to profit, funding, and clinical progress, such as a domestic clinical trial notification, a U.S. IND application, fundraising by the new Treehill company, and revised earnings forecasts.
Valuation: evaluating current profits and future business value separately
The PBR calculated from the share price of 163 yen and actual BPS of 32.4 yen is 5.03x. From the perspective of this report, rather than relying only on FY3/2027 profits, it is more appropriate to separate normalized profits from the existing business from the value of new biosimilars, domestic manufacturing, and SQ-SHED that could become concrete in the medium term. Because the Company has not disclosed forecast EPS, forecast PER cannot be calculated, and forecast ROE likewise cannot be calculated. Since the Company is transitioning from a loss-making period to a profit-turn phase, simple share price valuation using current EPS or ROE should be avoided.
Reverse-calculating the EPS growth rate implied by the current share price also has no mathematical meaning because EPS has been continuously negative over the past five years and there is no company-forecast EPS, so a CAGR cannot be calculated from a positive base EPS. The same applies to the five-year actual EPS CAGR. Alternatively, examine the sustainable profit level implied by the current market capitalization of 8.25 billion yen. If the future PER is 20x, net income would need to be about 410 million yen; at 25x, about 330 million yen; and at 30x, about 270 million yen. If 1Q net income of 198 million yen were simply annualized, it would exceed this level, but because R&D expenses will increase in the second half, we will not annualize it. We believe the market is looking to confirm both sustainable net income of around 270-410 million yen and progress toward commercialization of cell therapy.
Under the PBR method, we applied a range of 4.5x to 6.0x to the current BPS of 32.4 yen, premised on establishing operating profitability and improving the capital structure. The fair share price is 146-194 yen, with a center value of 170 yen. Since the current PBR is already 5.03x, the stock is not substantially undervalued based on PBR alone, but if BPS increases through profit improvement, the share price can rise even at the same PBR.
Under the DCF method, the assumption is that free cash flow will increase stepwise from FY3/2027 to FY3/2031 due to improved biosimilar margins and progress in new development, using a WACC of 9.5-11.0% and a perpetual growth rate of 1.0%. Cell therapy is heavily discounted for its probability of success and is not treated as definite near-term sales. After incorporating net cash of approximately 760 million yen at the end of 1Q, the fair share price is estimated at 160-235 yen, with a center value of 195 yen.
Under the ROIC method, normalized NOPAT after profitability was set at 550-800 million yen, normalized ROIC at 11-14%, WACC at 10%, and the long-term growth rate at 2%. Enterprise value was calculated by deriving the reinvestment required for growth from ROIC, and after adding net cash, the fair share price was 150-220 yen, with a center value of 180 yen. Current actual ROIC is negative due to losses, and using that value as it stands has limited meaning for valuation. Valuation focuses on whether biosimilars can generate returns above the cost of capital even after bearing R&D investment.
Combining the ranges from the three methods gives 145-235 yen, and the median of the center values is 180 yen. The current share price of 163 yen is about 9% below the median. Because the distance from the lower end is small, valuation alone does not justify arguing for strong upside. On the other hand, the upper ends of DCF and ROIC incorporate progress in SQ-SHED clinical trials and concrete progress in new biosimilars only conservatively. If domestic clinical trials begin, a U.S. IND application is filed, and external fundraising terms become concrete, the upper end will become more credible.
To improve capital efficiency, attention should be paid not only to achieving operating profitability but also to working capital and future capital expenditure burdens. Biosimilars involve advances paid and work-in-process, so even if sales increase, cash may be required in advance depending on manufacturing plans. At the end of 1Q, advances paid were 1.342 billion yen, and work-in-process was 414 million yen, totaling 1.756 billion yen. Given the history of improving capital efficiency through changes in payment terms, future ROIC improvement will require management not only of gross margin but also of manufacturing lots, delivery timing, advances paid, and inventories. In addition, domestic manufacturing facilities will enhance supply stability and cost competitiveness, but will require additional invested capital for the business as a whole. The Company must confirm whether facility utilization, the number of contracted products, and the funding burden at the joint venture will generate sufficient profitability. In other words, for the Company to transition into an enterprise that exceeds its cost of capital, it must align price and cost improvements in launched products, expand new products, improve working capital efficiency, and increase profitability of domestic manufacturing facilities at the same time.
| Method | Key assumptions | Fair share price range | Center value |
| PBR | BPS of 32.4 yen; fair PBR of 4.5-6.0x |
146-194 yen | 170 yen |
| DCF | WACC of 9.5-11.0%; perpetual growth rate of 1.0%; stepwise FCF improvement |
160-235 yen | 195 yen |
| ROIC | Normalized NOPAT of 550-800 million yen; ROIC of 11-14%; WACC of 10% |
150-220 yen | 180 yen |
| Combined three methods | Comparison of each method’s range and center value | 145-235 yen | Median 180 yen |
Source: Omega Investment estimates. The figures do not guarantee any future share price.
Figure 4. Fair share price range based on PBR, DCF, and ROIC methods

Source: Omega Investment estimates.
7. Medium- to long-term growth scenario and risks: Toward medium-term corporate value creation
The most desirable medium- to long-term scenario is that over the next one to two years, already-launched biosimilars secure stable gross profit; over the medium term, new biosimilars and domestic manufacturing create the next earnings sources; and using that cash and external partner funding, SQ-SHED advances into corporate clinical trials in Japan and overseas. In this case, the Company would be evaluated not as a loss-making drug discovery company, but as a biopharmaceutical development and manufacturing company with existing earnings. Equity value may change from one based only on current profits to one that also incorporates future cell therapy value.
Over a one- to two-year time horizon, establishing operating profitability matters most. If the Company achieves operating profit of 100-600 million yen in FY3/2027 and remains profitable in FY3/2028, the perception that the Company repeatedly incurs losses and raises funds, as in the past, will recede. In particular, if the Company can increase R&D expenses while maintaining gross margin in the 30% range, it will prove the earning power of the existing business.
In the medium term, the development stage of new biosimilars, operation of domestic manufacturing facilities, and clinical stage of SQ-SHED will determine corporate value. If new biosimilars progress to clinical development or commercialization preparations, and domestic manufacturing facilities win orders, they will compensate for the maturation of the four existing products. If SQ-SHED advances in domestic corporate clinical trials, preparations for a U.S. IND application progress, and clinical development moves to the next stage, pipeline value relative to current market capitalization will increase.
The downside scenario is one in which the decline in GBS-007 volume is larger than expected and gross profit cannot be protected even through price revisions and cost reductions. Because R&D expenses will increase, if gross profit from the existing business is weak, the Company may return to a consolidated operating loss. Risks also include delays in starting up domestic manufacturing facilities, additional funding burdens, delays in SQ-SHED clinical trial applications, and uncertainty in clinical data. The possibility that remaining stock acquisition rights or future large-scale clinical expenses could again lead to equity financing has not disappeared completely.
Therefore, investors should focus not on the number of catalysts, but on whether profits, funding, and clinical development are improving simultaneously. The Company’s appeal lies not in the number of research themes, but in the structure under which the biosimilars earnings base can support value creation in cell therapy. This 1Q should be positioned as the first actual result showing that this structure has begun to function.
| Item to confirm in future results | Figures/progress to watch | Conditions for a higher assessment | Conditions requiring caution |
| Gross margin | Quarterly gross margin, manufacturing costs | Maintaining the 30% range; continued improvement measures | Decline again to the low 20% range |
| Operating profitability | Operating profit, R&D expenses | Profitability even after R&D increases | Loss due only to higher expenses |
| GBS-007 | Delivery volume, competitive impact | Limited volume decline; profit maintained | Volume and gross profit decline beyond expectations |
| New BS | Cell lines, contracts, development consideration | Additional candidates, concrete alliances | Development stagnation |
| Domestic manufacturing | Construction, approvals, funding burden | Construction and orders progress as planned | Delays, additional funding burden |
| SQ-SHED Japan | Final analysis, clinical trial notification | Clinical trial start timing becomes concrete | Application delays |
| SQ-SHED U.S. | IND application, new company, fundraising | Development progresses with external funding | Expansion of own funding burden |
| Dilution | 23rd series of stock acquisition rights | Early absorption and no additional issuance | Large-scale additional equity financing |
Source: Compiled by Omega Investment.
8. Company history, management team, and business model
The Company was established in Sapporo in March 2001 as Gene Techno Science Co., Ltd. to connect research results from Hokkaido University’s Institute for Genetic Medicine to diagnostic agents and therapeutics. In 2002, it began considering entry into the biosimilar business, and in 2007 it concluded a joint development agreement for filgrastim with Fuji Pharma. In 2012, the filgrastim biosimilar was approved, and in the same year the Company was listed on TSE Mothers.
Subsequently, the Company increased its product portfolio to include darbepoetin alfa, ranibizumab, and pegfilgrastim, expanding its earnings model from a biosimilar developer to a company supplying APIs and drug products after launch. It expanded into the regenerative medicine field by making Advanced Cell Technology and Engineering a wholly owned subsidiary in 2019 and Japan Regenerative Medicine a wholly owned subsidiary in 2020. In July 2021, the Company changed its name to Kidswell Bio and placed healthcare for children and families at the center of its corporate philosophy.
In April 2024, the Company established S-Quatre to manage the cell therapy business and made commercializing SQ-SHED a clear growth pillar. From 2025 to 2026, it advanced joint commercialization for cerebral palsy with Mochida Pharmaceutical, the U.S. development framework with Treehill, joint development of new biosimilars, the establishment of Alfenax Biologics, and the construction of domestic manufacturing facilities. Over its history, the Company has shifted from a company focused only on drug discovery research to one that combines external partners to build biosimilar development and supply, manufacturing infrastructure, and cell therapy.
| Year | Main event | Meaning for corporate value formation |
| 2001 | Gene Techno Science established | Started drug discovery research |
| 2007 | Joint development of filgrastim with Fuji Pharma | Full-scale entry into biosimilar business |
| 2012 | GBS-001 approved; listed on TSE Mothers | Acquired launch track record and access to capital markets |
| 2019-2020 | Made Regenerative medicine-related companies a subsidiary | Expanded business domain into cell therapy |
| 2021 | Name changed to Kidswell Bio | Redefined around pediatric and family healthcare |
| 2024 | S-Quatre established | Independent promotion of the SQ-SHED business |
| 2025-2026 | Progress in alliances with Mochida Pharmaceutical, Treehill, Alfenax and others | Expanded clinical, manufacturing and funding through external collaboration |
Source: Kidswell Bio company information and company IR materials.
Management team: a three-member Board of Directors responsible for the next growth stage
At the ordinary general meeting of shareholders in June 2026, the Company reduced the number of directors from four to three to speed up decision-making and improve effectiveness. The current directors are President and Representative Director Shinya Kurebayashi, Outside Director Norikazu Eiki, and Outside Director Sachiko Nishioka. Two of the three directors are independent outside directors, and the Board of Directors is small. For an R&D-oriented company, decision-making speed matters, and as the management team shrinks, dependence on the president increases, so dividing roles among executive officers becomes important.
President Kurebayashi worked at Goldman Sachs Japan, Morgan Stanley Japan, and the Japan Science and Technology Agency before moving to a regenerative medicine company, and joined the Company in 2019. His defining characteristic is his combination of experience in finance, business development, and regenerative medicine. He became President and Representative Director in 2023 and has also served as Representative Director of S-Quatre since May 2026. In the current phase, when fundraising and overseas alliances for cell therapy affect corporate value, his finance and alliance experience can be a management strength.
Mr. Eiki was involved in pharmaceutical business, manufacturing, and corporate planning at predecessor companies of Novartis Pharma and at Bayer Yakuhin, and served as President and Chairman of Bayer Yakuhin. He has served as an outside director of the Company since 2018 and advises the Board of Directors on corporate management and business development. Ms. Nishioka specializes in corporate communications and concurrently serves as Representative Director of Plusna Communications and a part-time lecturer at Hitotsubashi University. She became an outside director in 2024 and is involved from the perspective of information dissemination and business development.
From an investor perspective, the combination of Mr. Eiki, who has experience in pharmaceutical management, and President Kurebayashi, who has experience in capital markets and business development, is aligned with the current improvement in biosimilar earnings, fundraising, and cell therapy alliances. On the other hand, because the Board of Directors is small with three members, it will be necessary to continue confirming how executive officers and the Audit & Supervisory Board complement the Board in clinical development, manufacturing quality, and financial control.
| Name | Position | Age | Director tenure | Shares held | Holding ratio | Main career and expertise |
| Shinya Kurebayashi | President and Representative Director | 49 | 3 years | 91,000 shares | Approx. 0.18% | Goldman Sachs Japan, Morgan Stanley Japan, JST, regenerative medicine company; joined in 2019. President since 2023. Representative Director of S-Quatre. |
| Norikazu Eiki | Outside Director | 78 | 8 years | 0 shares | 0% | Experience in corporate planning and manufacturing at pharmaceutical companies. Former President and Chairman of Bayer Yakuhin. Outside director at multiple pharmaceutical and biotech companies. |
| Sachiko Nishioka | Outside Director | 62 | 2 years | 0 shares | 0% | Corporate communications. Representative Director of Plusna Communications and part-time lecturer at Hitotsubashi University. |
Source: Notice of convocation of the 2026 ordinary general meeting of shareholders, FactSet People. Shareholdings are based on the notice of convocation, and ratios are approximate figures against 50.583 million shares outstanding. FactSet records 87,000 shares for Mr. Kurebayashi, but the notice of convocation uses 91,000 shares as the latest figure.
Business model and cash flow: conditions for linking profit growth to shareholder value
When analyzing the Company, it is difficult to capture business changes using only sales and operating profit, as in a typical pharmaceutical company. In biosimilars, a time lag exists between placing orders for manufacturing APIs and other products with overseas CDMOs and actual delivery and sales recognition, during which advances paid, work-in-process, and foreign exchange rates fluctuate. At the end of 1Q FY3/2027, advances paid increased to 1.342 billion yen from 1.114 billion yen at the end of the previous fiscal year, and work-in-process also increased to 414 million yen. This does not immediately indicate deterioration and partly reflects manufacturing progress toward future deliveries. On the other hand, if manufacturing delays or demand changes occur, working capital may stagnate, so it is important not to judge financial capacity based only on cash and deposits.
Operating cash flow also fluctuates significantly from year to year. It was positive 937 million yen in FY3/2025, while it was approximately negative 1.1 billion yen in FY3/2026. This is because cash flow is affected not only by increases and decreases in sales, but also by prepayments for manufacturing, inventories, and timing of accounts receivable collection. Going forward, even if margins improve through supply price revisions, payment term revisions, and manufacturing cost reductions, the contribution to shareholder value will be limited if working capital continues to increase. Therefore, in addition to operating profit, confirm movements in operating cash flow, advances paid, work-in-process, and accounts receivable.
Meanwhile, in cell therapy, R&D expenses come first and depress operating cash flow in the short term. External funding and alliance partners matter here. Through joint commercialization with Mochida Pharmaceutical, the new U.S. company with Treehill, AMED adoption, and manufacturing development with Nipro, the Company is building a structure in which it does not shoulder development alone. If the terms of these agreements are favorable, the Company can limit its own funding burden while maintaining development progress. Conversely, expenses will increase as clinical stages advance, so if external funding is insufficient, equity financing may again become necessary. Therefore, investors should not evaluate alliances by name alone; they must confirm the development cost burden, milestone income, manufacturing earnings, and the distribution of future sales profits.
From a corporate value perspective, the basic structure is a two-layer model in which the biosimilar business generates operating profit and cash, while cell therapy creates future value. Going forward, however, domestic manufacturing and CDMO operations may have a third role connecting the two. If, in addition to commercial manufacturing of jointly developed products, the Company can receive external projects as a CDMO, it could add a new source of contract manufacturing revenue separate from R&D revenue. If this is realized, the Company’s valuation will move closer to that of a biopharmaceutical platform company with development, manufacturing, and cell therapy capabilities, rather than a combination of a biosimilar supply company and a drug discovery company. However, confirming the operating track record and profitability of manufacturing facilities is necessary for that valuation, and it should not be anticipated excessively at this point.
9. Investment focus for the Company’s shares going forward
Going forward, investment in the Company’s shares should focus not on quarterly profit fluctuations, but on whether the corporate-structure transformation continues over multiple years. In the current 1Q, operating profitability and gross margin improvement, which were required in the previous report, were confirmed in the figures. In addition, potential dilution receded significantly with the full conversion of convertible bonds. Therefore, the basis for the investment judgment has shifted from expectations in the previous report to actual operating profit and an improved financing structure. This is an important step forward.
From here, the focus will be to confirm that operating profitability is not only a phenomenon in a quarter with low R&D expenses, to understand the competitive impact on GBS-007 in terms of both volume and profit, and to see SQ-SHED advance from research results to corporate clinical trials. In particular, if any of the domestic clinical trial notification, U.S. IND application, or fundraising terms for the Treehill new company becomes concrete, it will become easier to reflect cell therapy value in the share price valuation.
The current share price of 163 yen is below the median of 180 yen under the three-method valuation, but it is also close to the lower end of 145 yen. Therefore, this is not a stock to be evaluated simply based on low PBR or low PER. It should be positioned as a medium- to long-term hold, tracking the repeatability of earnings-structure improvements and concrete progress in clinical development. If the Company achieves operating profitability in FY3/2027 and maintains profitability in FY3/2028, the share price valuation over one to two years is likely to improve. In the medium term, new biosimilars, domestic manufacturing, and clinical progress in SQ-SHED will determine the upper bound of corporate value.
The previous bullish view is maintained. This time, rather than further strengthening that view, it is more appropriate to state that the certainty of the bullish view has increased. Risks remain, including competition for GBS-007 and rising R&D expenses, but earnings, development, alliances, and financing are improving simultaneously. If the 30% range in gross margin and operating profitability is maintained in the next results, and the clinical trial process for SQ-SHED advances one step further, the basis for a re-rating relative to the current market capitalization of 8.25 billion yen will become stronger.
Note: Financial data were referenced in principle based on FactSet standardized data. Therefore, net sales, operating profit, ordinary profit, net income, cash flows, balance sheet items, segment-related figures, and other items may not fully match the line items, reclassifications, rounding, or segment disclosures in company disclosure materials. For net sales by business, operating profit, KPIs, capital allocation policy, and other items, we prioritized company disclosure materials. We used FactSet data and Omega Investment estimates for supplementary purposes as needed.
Key financial data
| Unit: million yen | 2022/3 | 2023/3 | 2024/3 | 2025/3 | 2026/3 | 2027/3 CE |
| Sales | 1,569 | 2,776 | 2,431 | 5,082 | 6,590 | 5,000 -6,000 |
| EBIT | -976 | -551 | -1,336 | 28 | -139 | 100 -600 |
| Pretax Income | -550 | -656 | -1,421 | 73 | -403 | |
| Net Profit Attributable to Owner of Parent | -551 | -657 | -1,422 | -21 | -414 | na |
| Cash & Short-Term Investments | 1,161 | 1,067 | 2,231 | 2,995 | 3,295 | |
| Total assets | 3,470 | 3,895 | 5,086 | 7,008 | 6,088 | |
| Total Debt | 700 | 1,950 | 2,575 | 1,838 | 2,550 | |
| Net Debt | -461 | 883 | 344 | -1,157 | -745 | |
| Total liabilities | 1,767 | 2,661 | 4,254 | 5,598 | 4,434 | |
| Total Shareholders’ Equity | 1,703 | 1,234 | 831 | 1,411 | 1,654 | |
| Net Operating Cash Flow | -1,170 | -1,421 | -454 | 937 | -1,093 | |
| Capital Expenditure | 0 | 0 | 0 | 6 | 18 | |
| Net Investing Cash Flow | 527 | -29 | 0 | 65 | -13 | |
| Net Financing Cash Flow | 369 | 1,356 | 1,618 | -240 | 1,398 | |
| ROA (%) | -14.88 | -17.85 | -31.67 | -0.35 | -6.32 | |
| ROE (%) | -33.25 | -44.78 | -137.73 | -1.89 | -27.02 | |
| EPS (Yen) | -17.9 | -20.8 | -40.2 | -0.5 | -8.5 | na |
| BPS (Yen) | 54.2 | 38.5 | 21.4 | 32.2 | 33.3 | |
| Dividend per Share (Yen) | 0.00 | 0.00 | 0.00 | 0.00 | 0.00 | 0.00 |
| Shares Outstanding (Million shares) | 31.44 | 31.90 | 37.31 | 40.66 | 49.58 |
Source: Calculated by Omega Investment based on FactSet’s standard criteria, rounded to the nearest whole number.
Share price
Key stock price data

Financial data (quarterly basis)
| Unit: million yen | 2025/03 | 2026/3 | 2027/3 | ||||||
| 1Q | 2Q | 3Q | 4Q | 1Q | 2Q | 3Q | 4Q | 1Q | |
| (Income Statement) | |||||||||
| Sales | 483 | 1,267 | 1,286 | 2,046 | 1,721 | 1,556 | 1,743 | 1,571 | 1,270 |
| Year-on-year | 950.4% | 136.4% | 30.6% | 136.6% | 256.3% | 22.8% | 35.5% | -23.2% | -26.2% |
| Cost of Goods Sold (COGS) | 259 | 998 | 748 | 1,436 | 1,123 | 1,160 | 1,405 | 1,154 | 838 |
| Gross Income | 224 | 269 | 538 | 610 | 597 | 396 | 337 | 417 | 431 |
| Gross Income Margin | 46.3% | 21.2% | 41.8% | 29.8% | 34.7% | 25.4% | 19.4% | 26.6% | 34.0% |
| SG&A Expense | 383 | 372 | 414 | 444 | 413 | 365 | 468 | 640 | 215 |
| EBIT | -159 | -104 | 125 | 166 | 185 | 31 | -131 | -223 | 217 |
| Year-on-year | -65.1% | -60.9% | 136.8% | -124.8% | -216.2% | -129.6% | -205.3% | -234.3% | 17.3% |
| Operating Income Margin | -32.9% | -8.2% | 9.7% | 8.1% | 10.7% | 2.0% | -7.5% | -14.2% | 17.1% |
| EBITDA | -159 | -103 | 125 | 166 | 185 | 31 | -131 | -223 | 217 |
| Pretax Income | -176 | -65 | 107 | 207 | 176 | -88 | -212 | -279 | 237 |
| Consolidated Net Income | -177 | -65 | 54 | 167 | 157 | -97 | -203 | -271 | 198 |
| Minority Interest | 0 | 0 | 0 | 0 | 0 | 0 | 0 | 0 | 0 |
| Net Income ATOP | -177 | -65 | 54 | 167 | 157 | -97 | -203 | -271 | 198 |
| Year-on-year | -62.5% | -79.0% | 64.4% | -124.7% | -188.9% | 48.3% | -476.5% | -262.7% | 26.0% |
| Net Income Margin | -36.6% | -5.1% | 4.2% | 8.1% | 9.1% | -6.2% | -11.7% | -17.3% | 15.6% |
| (Balance Sheet) | |||||||||
| Cash & Short-Term Investments | 1,167 | 1,695 | 1,318 | 2,995 | 2,840 | 1,542 | 3,785 | 3,295 | 3,234 |
| Total assets | 4,609 | 4,646 | 4,575 | 7,008 | 6,579 | 5,815 | 6,320 | 6,088 | 6,131 |
| Total Debt | 2,402 | 2,131 | 2,034 | 1,838 | 1,549 | 1,134 | 2,625 | 2,550 | 2,475 |
| Net Debt | 1,235 | 436 | 715 | -1,157 | -1,291 | -407 | -1,160 | -745 | -759 |
| Total liabilities | 3,895 | 3,789 | 3,523 | 5,598 | 4,531 | 3,629 | 4,394 | 4,434 | 4,293 |
| Total Shareholders’ Equity | 714 | 857 | 1,052 | 1,411 | 2,048 | 2,186 | 1,926 | 1,654 | 1,837 |
| (Profitability %) | |||||||||
| ROA | -29.48 | -22.54 | -17.65 | -0.35 | 5.59 | 5.38 | 0.44 | -6.32 | -5.87 |
| ROE | -152.15 | -91.46 | -69.11 | -1.89 | 22.64 | 18.48 | 1.60 | -27.02 | -19.21 |
| (Per-share) Unit: JPY | |||||||||
| EPS | -4.5 | -1.6 | 1.3 | 3.8 | 3.3 | -1.9 | -4.1 | -5.5 | 4.0 |
| BPS | 18.1 | 21.1 | 25.9 | 32.2 | 43.0 | 44.1 | 38.8 | 33.3 | 37.0 |
| Dividend per Share | 0.00 | 0.00 | 0.00 | 0.00 | 0.00 | 0.00 | 0.00 | 0.00 | 0.00 |
| Shares Outstanding (million shares) | 39.41 | 40.66 | 40.66 | 43.88 | 47.63 | 49.56 | 49.58 | 49.62 | 49.63 |
Source: Calculated by Omega Investment based on FactSet’s standard criteria, rounded to the nearest whole number
Financial data (full-year basis)
| Unit: million yen | 2017/3 | 2018/3 | 2019/3 | 2020/3 | 2021/3 | 2022/3 | 2023/3 | 2024/3 | 2025/3 | 2026/3 |
| (Income Statement) | ||||||||||
| Sales | 1,089 | 1,060 | 1,022 | 1,078 | 997 | 1,569 | 2,776 | 2,431 | 5,082 | 6,590 |
| Year-on-year | -6.2% | -2.7% | -3.6% | 5.5% | -7.5% | 57.5% | 76.9% | -12.4% | 109.0% | 29.7% |
| Cost of Goods Sold | 398 | 423 | 413 | 653 | 120 | 553 | 1,251 | 1,393 | 3,443 | 4,843 |
| Gross Income | 692 | 637 | 609 | 425 | 877 | 1,017 | 1,525 | 1,038 | 1,639 | 1,747 |
| Gross Income Margin | 63.5% | 60.1% | 59.6% | 39.4% | 88.0% | 64.8% | 54.9% | 42.7% | 32.3% | 26.5% |
| SG&A Expense | 1,876 | 1,551 | 1,414 | 1,586 | 1,847 | 1,992 | 2,076 | 2,374 | 1,611 | 1,886 |
| EBIT | -1,184 | -913 | -806 | -1,161 | -970 | -976 | -551 | -1,336 | 28 | -139 |
| Year-on-year | 44.4% | -22.9% | -11.8% | 44.2% | -16.5% | 0.6% | -43.5% | 142.4% | -102.1% | -596.8% |
| Operating Income Margin | -108.7% | -86.2% | -78.8% | -107.8% | -97.3% | -62.2% | -19.8% | -54.9% | 0.5% | -2.1% |
| EBITDA | -1,184 | -913 | -805 | -1,161 | -969 | -973 | -550 | -1,335 | 29 | -138 |
| Pretax Income | -1,222 | -903 | -854 | -7,314 | -1,000 | -550 | -656 | -1,421 | 73 | -403 |
| Consolidated Net Income | -1,225 | -905 | -856 | -7,316 | -1,001 | -551 | -657 | -1,422 | -21 | -414 |
| Minority Interest | 0 | 0 | 0 | 0 | 0 | 0 | 0 | 0 | 0 | 0 |
| Net Income ATOP | -1,225 | -905 | -856 | -7,316 | -1,001 | -551 | -657 | -1,422 | -21 | -414 |
| Year-on-year | 55.5% | -26.1% | -5.3% | 754.4% | -86.3% | -45.0% | 19.3% | 116.3% | -98.5% | 1858.3% |
| Net Income Margin | -112.4% | -85.4% | -83.8% | -678.9% | -100.5% | -35.1% | -23.7% | -58.5% | -0.4% | -6.3% |
| (Balance Sheet) | ||||||||||
| Cash & Short-Term Investments | 2,380 | 1,891 | 2,009 | 2,033 | 1,461 | 1,161 | 1,067 | 2,231 | 2,995 | 3,295 |
| Total assets | 3,706 | 3,025 | 3,151 | 3,592 | 3,934 | 3,470 | 3,895 | 5,086 | 7,008 | 6,088 |
| Total Debt | 0 | 0 | 0 | 1,225 | 1,100 | 700 | 1,950 | 2,575 | 1,838 | 2,550 |
| Net Debt | -2,380 | -1,891 | -2,009 | -808 | -361 | -461 | 883 | 344 | -1,157 | -745 |
| Total liabilities | 206 | 421 | 420 | 2,105 | 2,324 | 1,767 | 2,661 | 4,254 | 5,598 | 4,434 |
| Total Shareholders’ Equity | 3,500 | 2,604 | 2,731 | 1,487 | 1,610 | 1,703 | 1,234 | 831 | 1,411 | 1,654 |
| (Cash Flow) | ||||||||||
| Net Operating Cash Flow | -1,759 | -438 | -860 | -1,325 | -1,267 | -1,170 | -1,421 | -454 | 937 | -1,093 |
| Capital Expenditure | 0 | 0 | 0 | 2 | 3 | 0 | 0 | 0 | 6 | 18 |
| Net Investing Cash Flow | -150 | -50 | -0 | -137 | -22 | 527 | -29 | 0 | 65 | -13 |
| Net Financing Cash Flow | 3,472 | 0 | 978 | 1,222 | 718 | 369 | 1,356 | 1,618 | -240 | 1,398 |
| (Profitability ) | ||||||||||
| ROA (%) | -45.35 | -26.88 | -27.73 | -216.99 | -26.61 | -14.88 | -17.85 | -31.67 | -0.35 | -6.32 |
| ROE (%) | -62.74 | -29.64 | -32.10 | -346.86 | -64.66 | -33.25 | -44.78 | -137.73 | -1.89 | -27.02 |
| Net Margin (%) | -112.41 | -85.36 | -83.81 | -678.87 | -100.49 | -35.10 | -23.68 | -58.49 | -0.42 | -6.28 |
| Asset Turn | 0.40 | 0.31 | 0.33 | 0.32 | 0.26 | 0.42 | 0.75 | 0.54 | 0.84 | 1.01 |
| Assets/Equity | 1.38 | 1.10 | 1.16 | 1.60 | 2.43 | 2.23 | 2.51 | 4.35 | 5.39 | 4.27 |
| (Per-share) Unit: JPY | ||||||||||
| EPS | -68.5 | -47.3 | -43.8 | -264.7 | -34.8 | -17.9 | -20.8 | -40.2 | -0.5 | -8.5 |
| BPS | 182.9 | 136.1 | 134.3 | 53.8 | 54.4 | 54.2 | 38.5 | 21.4 | 32.2 | 33.3 |
| Dividend per Share | 0.00 | 0.00 | 0.00 | 0.00 | 0.00 | 0.00 | 0.00 | 0.00 | 0.00 | 0.00 |
| Shares Outstanding (million shares) | 18.74 | 19.14 | 19.68 | 27.65 | 29.06 | 31.44 | 31.90 | 37.31 | 40.66 | 49.58 |
Source: Omega Investment from company data, rounded to the nearest whole number