2026-10-16
Home
Japanese

Omega Investment Co., Ltd.
Sansei Landic (Omega Strategic Outlook)
| Share price (9/28) | 827 yen | Market Cap | 14.20 bn yen |
| PER (26/12 CE) | 6.1 X | Dividend Yield (26/12 CE) | 4.5 X |
| Real estate for sale | 32.7 bn yen | Net debt | 19.35 bn yen |
| Click here for the PDF version of this page |
| PDF version |
The next phase of growth, unlocked by institutionalizing rights-adjustment capabilities.
Assessing inventory quality, capital efficiency, and business expansion from 2028 onward.
Investment Conclusion
We maintain our bullish medium- to long-term investment view. On August 10, the Company raised its full-year forecast for the fiscal year ending December 2026 to net sales of 31.0 billion yen, operating income of 3.68 billion yen, ordinary income of 3.05 billion yen, and net income attributable to owners of parent of 2.19 billion yen. These levels substantially exceed the current Medium-term Management Plan targets of 2.5 billion yen in operating income and 2.0 billion yen in ordinary income. We also estimate ROE at 14%-15%, above the Plan target of 9%-12%. The Company’s 2026 forecast has reached levels that exceed, one year ahead of schedule, the earnings and capital-efficiency targets set for 2027, the final year of the current Plan, confirming that current earning power is running ahead of the previous medium-term assumptions.
At the same time, the Company said the current Medium-term Management Plan will continue through 2027, with only the numerical targets to be revised around February 2027. It also clarified that a new Medium-term Management Plan will begin in 2028, and that the four derivative businesses – co-ownership interests, holding-period business, loan-for-use, and leasehold rights – will remain in the commercialization and verification phase through 2027, with scaling targeted from 2028 onward. Accordingly, the key point from the August 21 briefing was not only that the 2026 Company forecast had reached a level well above the current Plan targets, but also that the management-plan timeline had become clear: numerical targets will be revised in 2027, followed by a new Plan and expansion of the derivative businesses from 2028 onward.
Using this Company policy as the starting point, Omega Investment has independently forecast the core real estate business for 2030. Our median 2030 scenario is net sales of 42.0 billion yen, operating income of 4.8 billion yen, EPS of 175 yen, and a future fair value of 1,600 yen per share. The Company has not disclosed numerical targets for 2030; these are Omega Investment estimates based on inventory, purchases, turnover, profit margins, interest rates, and progress in the derivative businesses.
Three important points were newly confirmed in the August 21 presentation: 93.2% of the 32.7 billion yen of real estate for sale consists of relatively recent properties acquired since 2023; profit margins and business duration have been incorporated into the Company’s organizational evaluation system; and initial projects in the derivative businesses are already in place. On the other hand, demonstrating earnings repeatability will still require disclosure of sales ratios by acquisition year, gross margins, average holding periods, operating cash flow, and borrowing rates.
| Company disclosure | FY12/2026: net sales 31.0 bn yen, operating income 3.68 bn yen, net income 2.19 bn yen |
| Company policy | Revise the current Plan’s numerical targets around February 2027; new Plan from 2028 |
| Omega Investment forecast | 2030 median: net sales 42.0 bn yen, operating income 4.8 bn yen, future fair value 1,600 yen |
Source: Sansei Landic, FY12/2026 2Q Earnings Presentation (August 21, 2026); FactSet; Company disclosures; Omega Investment estimates.
1. Management-plan timeline clarified in the August 21 earnings presentation
The 2026 Company forecast exceeds current Plan earnings targets; targets to be reset in 2027, with a new Plan beginning in 2028
First, the targets and planning periods the Company newly presented are summarized below, distinguishing between Company disclosures and their treatment in this report.
Targets and time frames newly presented by the Company on August 21
| Period/theme | Company disclosure | Treatment in this report |
| 2026 | Current Medium-term Management Plan numerical targets expected to be achieved | Revised numerical targets under the current Plan are operating income of 2.5 bn yen, ordinary income of 2.0 bn yen, and ROE of 9%-12%. Full-year Company forecasts are 3.68 bn yen, 3.05 bn yen, and 2.19 bn yen, respectively. |
| 2027 | Continue the current Medium-term Management Plan | Maintain the basic policy and revise only the numerical targets around February 2027. New figures have not yet been disclosed. |
| 2028 onward | Launch a new Medium-term Management Plan | The four derivative businesses – co-ownership interests, holding-period business, loan-for-use, and leasehold rights – are targeted for scaling. |
| PBR | Improvement policy with a PBR of 1.0x in mind | Approach to improve PBR through ROE, PER, earnings growth, capital efficiency, and shareholder returns |
Company disclosure
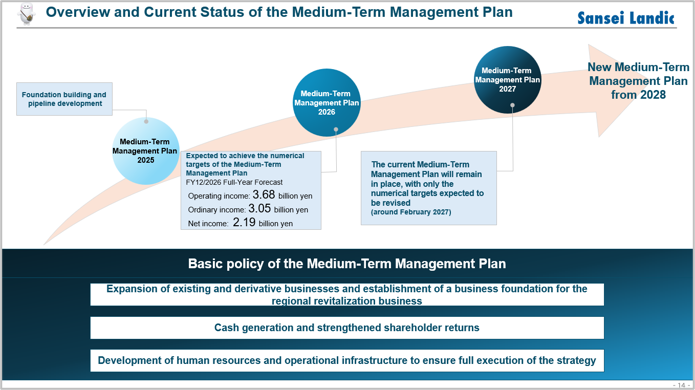
We first organize the numerical targets currently disclosed under the Medium-term Management Plan and the future timeline presented at the August 21 earnings briefing. The current Plan targets are operating income of 2.5 billion yen, ordinary income of 2.0 billion yen, and ROE of 9%-12%. By contrast, the Company forecasts operating income of 3.68 billion yen and ordinary income of 3.05 billion yen for FY12/2026, already well above the current Plan targets on an earnings basis.
The Company has indicated that it will not terminate the current Plan simply because it has exceeded its target levels, but will continue the Plan through 2027. It plans to maintain the basic policy while revising only the numerical targets around February 2027. Accordingly, new targets for net sales, earnings, and ROE for 2027 had not been disclosed as of the date of this report.
The Company will then transition to a new Medium-term Management Plan from 2028. For the four derivative businesses – co-ownership interests, holding-period business, loan-for-use, and leasehold rights – the period through 2027 is designated for commercialization and verification, with scaling targeted from 2028 onward. Thus, the August 21 presentation did not provide specific numerical targets for 2030; rather, it laid out a three-stage timeline: the 2026 Company forecast already exceeds the current Plan targets, numerical targets will be reset in 2027, and a new Plan will begin from 2028 onward.
Source: Company materials
From an investment perspective
Omega Investment views the clarification of the Company’s timeline positively. In particular, resetting numerical targets around February 2027 will be an important step in addressing market concerns that the current earnings level may be temporary, as it should provide visibility into the following year’s sales plan, capital efficiency, and shareholder returns.
However, the Company has not disclosed 2030 targets. The 2030 forecast in this report is an independent scenario that looks ahead of the new Medium-term Management Plan beginning in 2028 and is not a mechanical extrapolation of the Company plan. We have separately modeled current inventory, purchase plans, turnover, gross margins, interest rates, and the ramp-up of derivative businesses.
Framework for medium- to long-term forecasts based on the Company plan
The forecasting framework in this report has two layers. The first consists of the Company’s disclosed FY12/2026 earnings forecast, the numerical targets under the current Medium-term Management Plan, its shareholder-return policy, and the roadmap for derivative businesses. The current Plan targets are operating income of 2.5 billion yen, ordinary income of 2.0 billion yen, and ROE of 9%-12%, while the 2026 Company forecast of 3.68 billion yen in operating income and 3.05 billion yen in ordinary income is substantially higher. The second layer consists of Omega Investment’s independent scenarios for 2027 onward and 2030, based on these Company disclosures and industry data.
Accordingly, Company forecasts for 2026 are net sales of 31.0 billion yen, operating income of 3.68 billion yen, ordinary income of 3.05 billion yen, net income of 2.19 billion yen, EPS of 134.62 yen, and an annual dividend of 37.5 yen. By contrast, Omega Investment’s 2030 scenario analyses are net sales of 34.0-54.0 billion yen, operating income of 3.1-6.8 billion yen, EPS of 110-250 yen, and a future fair value of 800-2,600 yen per share. The Company has not yet disclosed new numerical targets for 2027 or earnings targets for 2030.
The Company’s August 21 discussion of a PBR of 1.0x indicates a direction for improving PBR through ROE, PER, earnings growth, capital efficiency, and shareholder returns; it is not a share-price target. Omega Investment first organizes the Company’s disclosures as facts and then makes its own assessment based on sustainable ROE, earnings repeatability, inventory turnover, and the cost of capital.
| Item | Category | Details |
| FY12/2026 earnings | Company forecast | Net sales 31.0 bn yen, operating income 3.68 bn yen, ordinary income 3.05 bn yen, net income 2.19 bn yen, EPS 134.62 yen |
| Current Plan target level | Company policy | Operating income 2.5 bn yen, ordinary income 2.0 bn yen, and ROE 9%-12%, expected to be achieved in 2026 |
| 2027 | Company policy | Continue the current Plan; only numerical targets are scheduled to be revised around February 2027. New figures have not been disclosed. |
| 2028 onward | Company policy | Launch a new Medium-term Management Plan. The four derivative businesses are targeted for scaling. |
| 2030 earnings | Omega Investment forecast | Core net sales 34.0-54.0 bn yen and operating income 3.1-6.8 bn yen. Median: net sales 42.0 bn yen, operating income 4.8 bn yen, EPS 175 yen |
| Fair value | Omega Investment estimate | 12-18 months: 1,000-1,200 yen; 2030 future value: 800-2,600 yen. Medians: 1,100 yen and 1,600 yen |
2. Market characteristics – a business that converts complex rights into liquidity
Unlike ordinary real estate trading, profit comes from legal work, negotiation, and time management.
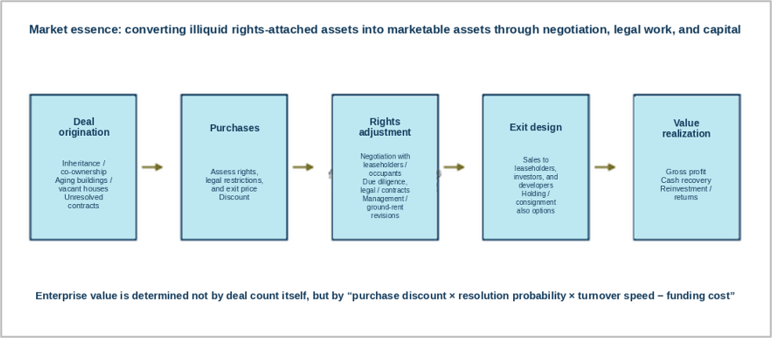
The market in which Sansei Landic operates is narrower, but also deeper, than the ordinary secondary real estate market. The Company purchases properties such as leasehold land, leasehold rights, old unutilized properties, co-ownership interests, and loan-for-use properties, where complex rights relationships make ordinary brokerage-based liquidity difficult. It then improves marketability through rights adjustment and sells the properties. The source of profit is not simply land-price appreciation; rather, the Company absorbs the legal, negotiation, and time costs that buyers would otherwise bear by reducing uncertainty around property rights.
In this market, even properties in the same location and with the same area can differ substantially in economic value depending on the rights structure, contractual terms, the circumstances of land lessees or occupants, road access, surveys, and the number of co-owners. At the purchase stage, uncertainty is reflected in pricing; as rights adjustment progresses, the pool of market participants expands, and exit prices rise. Sansei Landic’s expertise lies in identifying this value gap and estimating both the feasibility of resolution and the holding period.
Structural demand drivers include aging, inheritance, increasing co-ownership, aging buildings, rising numbers of vacant homes, mandatory registration requirements, and more intensive land use in urban areas. Population decline is a headwind for ordinary housing demand, but aging property owners and rising inheritance cases instead increase the need to organize property rights. Accordingly, the Company’s market cannot be explained by housing starts alone.
On the other hand, not every problematic property represents a profit opportunity. Properties in regional areas with limited exit demand, cases requiring lengthy legal resolution, and properties with high repair or demolition costs may not qualify as investment opportunities even if inquiries increase. When considering market size, it is necessary to distinguish between the total stock of problematic properties and cases that can be resolved economically.
Source: Company business materials and the previous Basic Report; prepared by Omega Investment.
3. Medium- to long-term demand – case inflow is increasing, but exit markets are becoming more selective
Structural demand is positive, but capital can remain tied up longer in regional and low-liquidity properties.
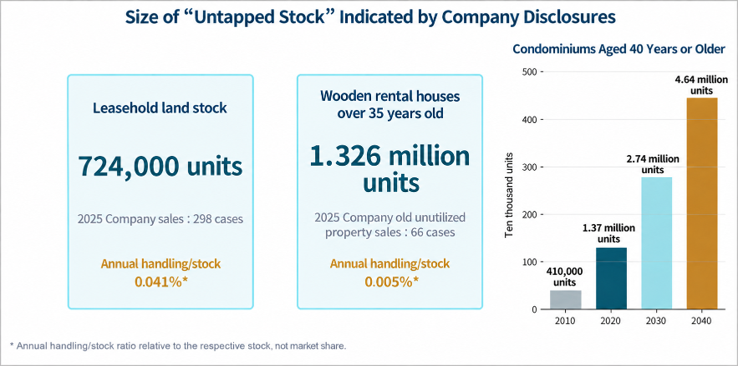
The potential stock of leasehold land, aging rental properties, and co-owned real estate is large. Reference figures presented by the Company on August 21, based on a 2023 Statistics Bureau survey, indicate 724,000 leasehold land cases and 1.326 million wooden rental housing units aged 35 years or more. By comparison, the Company’s annual sales volume is very small. The size of this potential stock suggests that the supply of cases is unlikely to be exhausted over the long term, but these figures cannot simply be treated as annual market size or market share.
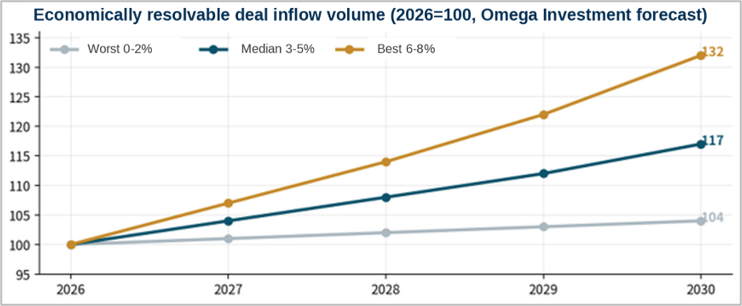
Omega Investment forecasts that inflows of economically resolvable cases will increase at a median annual rate of 3%-5% from 2026 to 2030. Mandatory inheritance registration, aging property owners, more co-owners, and growth in aging properties should support supply. On the other hand, population decline in regional areas, higher construction costs, and tighter financing conditions for buyers will constrain exit prices and turnover.
In the best case, case inflow grows by 6%-8% annually as rising land prices, digital customer acquisition, and referrals from financial institutions reinforce institutional factors. In the worst case, inquiries increase, but the number of monetizable cases does not, limiting growth to 0%-2% annually. More important than the growth rate in the number of cases is the proportion that can be acquired while maintaining purchasing discipline.
For the Company’s sales growth to exceed market growth, it must not only increase sales staff but also accelerate case selection, rights adjustment, and buyer acquisition at an organizational level. The “profit margin x business duration” concept emphasized in the August 21 presentation can be viewed as the management axis for converting this demand growth into returns on capital.
Source: Market-size information in the Company earnings presentation; Statistics Bureau and Ministry of Land, Infrastructure, Transport and Tourism materials. Potential stock is not annual TAM or market share.
Source: Omega Investment forecast. Index, with 2026 = 100.
4. Competitive environment and market share – what should be compared in a market without a common denominator?
Accumulated experience in leasehold land and old unutilized properties is an advantage; purchasing competition with digitally driven players is intensifying.
The rights-adjustment market includes specialist companies such as Sansei Landic, which focus on leasehold land and old unutilized properties; distressed-property companies dealing in co-ownership interests and non-rebuildable properties; regional real estate firms; purchase-and-resale companies; and individual investors. Competition is more likely at the purchasing stage than the selling stage, with access to sellers, appraisal speed, financing capacity, and legal-response capabilities determining case acquisition.
Sansei Landic’s strengths include its long track record in leasehold land, nationwide office network, relationships with financial institutions and brokers, staff able to handle complex cases, and purchasing decisions made with buyers in mind. Leasehold land may require waiting for life events involving land lessees, so competitiveness cannot be measured by short-term turnover alone. The operating experience of receiving ground rent while waiting for an exit is difficult for new entrants to replicate.
Meanwhile, digitally driven players such as AlbaLink (5537: Growth) and unlisted SA are rapidly expanding case inflow through search advertising, content, and nationwide consultation channels. Whereas Sansei Landic has strengths in broker networks and corporate referrals, these companies are building an advantage in directly acquiring individual sellers. Going forward, market position will depend not only on case difficulty but also on customer acquisition costs and appraisal speed.
The industry lacks standardized classifications or transaction statistics, making it impossible to calculate precise revenue shares. Omega Investment compares companies using proxy indicators such as net sales, number of sales transactions, number of purchases, inquiries, number of offices, real estate for sale, and cumulative track record. Because definitions differ, it is more appropriate to position companies along two axes – case complexity and customer-acquisition scale – rather than by a single market-share percentage.
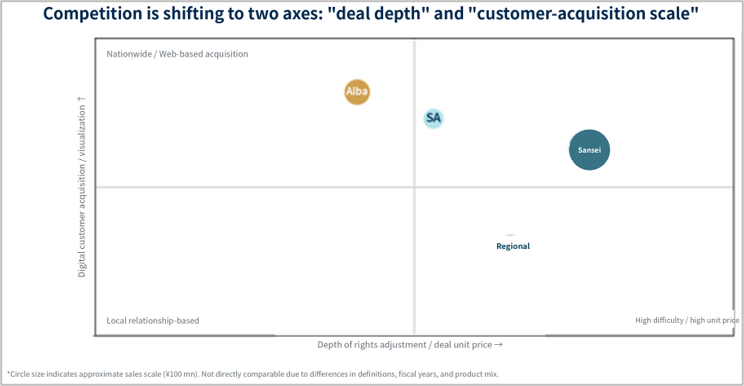
Source: Prepared by Omega Investment based on company disclosures. Direct comparison is not appropriate because sales scale, fiscal years, and business scope differ.
| Player | Main areas | Relative strengths | Key focus going forward |
| Sansei Landic | Leasehold land and old unutilized properties; nationwide offices; corporate and broker network | Complex cases; long-term operation; relationships with financial institutions | Strengthen direct web acquisition; visualize profitability by product |
| AlbaLink | Broad range including vacant homes, co-ownership interests, and non-rebuildable properties | Digital customer acquisition; nationwide expansion; case inflow | Profitability and capital turnover in complex cases |
| SA | Co-ownership interests, non-rebuildable properties, leasehold land, etc. | Direct customer acquisition; expertise in distressed properties | Scale, financing, and diversity of exit channels |
| Regional specialists | Leasehold land, leased land, and inheritance cases in limited regions | Regional networks and local knowledge | Capital strength, personnel, and case diversification |
5. Profit margins and returns on capital – high gross margins do not create value if holding periods are too long
The market structure creates both high gross-margin opportunities and substantial capital commitment
Because rights-adjustment businesses can acquire properties that are difficult to transact in ordinary markets at discounted prices, they can generate high gross margins. However, rights adjustment, surveying, subdivision, negotiation, demolition, and sales take time, making inventory and borrowings prone to increase. Gross margin alone therefore cannot explain shareholder value.
The Company‘s return on capital depends on the combination of the purchase discount, value created through rights adjustment, holding period, SG&A expenses, and borrowing costs. The Company says typical business periods are one to three years for leasehold land and one to two years for old unutilized properties. The holding-period business generates rental income, but because invested capital remains committed longer, it needs to be evaluated on an IRR basis, including gains on sale.
The Company’s results for the first half of FY12/2026 were net sales of 16.59 billion yen, gross profit of 5.27 billion yen, and operating income of 2.57 billion yen, with a high gross margin of 31.8% and operating margin of 15.5%. However, the standalone 2Q gross margin declined to 27.7% from 34.8% in 1Q. Quarterly fluctuations due to deal mix are significant, so it is inappropriate to treat the first-half FY12/2026 margin as a normalized level for full-year earnings.
Omega Investment uses inventory gross-profit yield, inventory operating-income yield, inventory turnover, inventory return after funding costs, and three-year cumulative operating cash flow as key indicators. The Company’s incorporation of “profit margin x business duration” into personnel evaluations represents a shift toward emphasizing annualized returns rather than sales scale and should help improve ROIC.
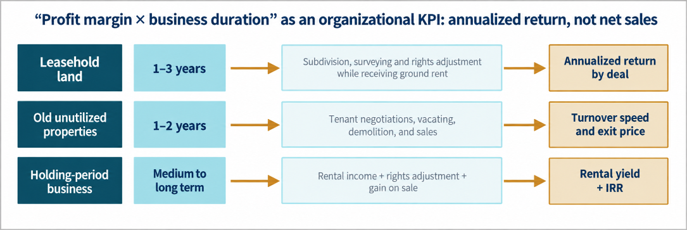
Source: Company earnings presentation; prepared by Omega Investment
| Indicator | Calculation | Implication for investment analysis |
| Inventory gross-profit yield | Gross profit / average real estate for sale | Quality of purchases and rights-adjustment capability |
| Inventory turnover | Net sales / average real estate for sale | Speed of converting capital into sales |
| Inventory operating-income yield | Operating income / average real estate for sale | Inventory profitability including SG&A |
| Return after funding costs | (Operating income – interest expense) / average real estate for sale | Effective return after interest-rate increases |
| Three-year cumulative operating CF | Total operating CF over three years | Smooths single-year fluctuations caused by purchase timing |
6. 2026 earnings – major upward revision to the Company forecast and second-half FY12/2026 assumptions
The Company’s forecast is substantially above the current Plan’s earnings targets; Omega Investment assesses its sustainability
Company disclosure
For cumulative 2Q FY12/2026, net sales were 16.59 billion yen, operating income 2.57 billion yen, ordinary income 2.28 billion yen, and net income 1.58 billion yen. Year on year, net sales increased 14.3%, operating income 14.9%, ordinary income 9.7%, and net income 12.3%. Progress against the Company’s first-half plan reached 114.4% for operating income, 113.9% for ordinary income, and 113.1% for net income, clearly indicating upside on the profit side.
Based on first-half results and current sales conditions, the Company raised its 2026 full-year forecast to 31.0 billion yen in net sales (from 25.5 billion yen), 3.68 billion yen in operating income (from 2.4 billion yen), and 2.19 billion yen in net income (from 1.33 billion yen). EPS rose 64.6%, from 81.76 yen to 134.62 yen. The current Medium-term Management Plan targets are operating income of 2.5 billion yen, ordinary income of 2.0 billion yen, and ROE of 9%-12%; the 2026 Company forecast of 3.68 billion yen in operating income and 3.05 billion yen in ordinary income is substantially above those earnings targets.
The sales forecast by business is 12.1 billion yen for leasehold land, 16.8 billion yen for old unutilized properties, 1.0 billion yen for freehold properties, and 0.9 billion yen for others. The 5.5 billion yen upward revision is driven mainly by leasehold land and old unutilized properties, with old unutilized properties in particular rising to 54.1% of the sales mix. Contributions from highly profitable cases could provide further earnings upside, but variability from transaction size, exit prices, and negotiation periods with occupants will also increase.
While 2026 is a year in which earnings have stepped up, it is also a year to assess how far earnings that already exceed current Plan targets can be sustained from 2027 onward. The new numerical targets to be presented around February 2027 will be important not only for net sales and earnings, but also for how the Company sets gross margin, inventory turnover, ROE, borrowing policy, and shareholder returns.
From an investment perspective
Against full-year operating income guidance of 3.68 billion yen, the Company generated 2.57 billion yen in the first half, implying the Company’s second-half forecast of approximately 1.11 billion yen. The second-half forecast assumes lower profitability than in the first half, but the Company revised upward its original plan—which had conservatively reflected the real estate market and rising interest rates—to incorporate current sales conditions. We believe some conservatism remains in the second-half plan, but we do not simply annualize first-half earnings; we account for the higher mix of old unutilized properties and normalization in gross margin.
While 2026 marks a step-up in earnings, it is also the year the baseline earnings level for 2027 onward will be determined. The new numerical targets to be presented around February 2027 will be important not only for net sales but also for how gross margin, inventory turnover, ROE, borrowing policy, and shareholder returns are set.
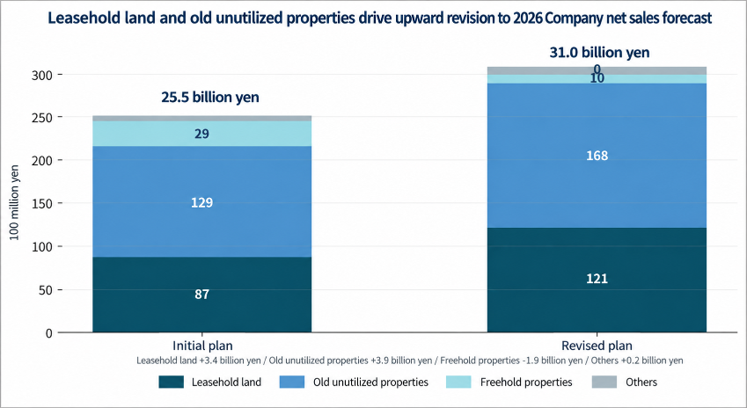
Source: Company earnings presentation; prepared by Omega Investment.
| Item | Initial forecast | August revised forecast | Revision | Category |
| Net sales | 25.5 bn yen | 31.0 bn yen | +21.6% | Company forecast |
| Operating income | 2.40 bn yen | 3.68 bn yen | +53.3% | Company forecast |
| Ordinary income | 1.90 bn yen | 3.05 bn yen | +60.5% | Company forecast |
| Net income | 1.33 bn yen | 2.19 bn yen | +64.7% | Company forecast |
| EPS | 81.76 yen | 134.62 yen | +64.6% | Company forecast |
7. Real estate for sale is being built, but the recency of inventory supports its quality
Inventory recency has been confirmed; the next focus is cohort profitability and cash conversion speed.
Real estate for sale totaled 32.7 billion yen at the end of June 2026, accounting for 75% of total assets of 43.4 billion yen. In the rights-adjustment business, real estate for sale is the source of future earnings, but it also ties up capital and creates interest costs until properties are sold. Accordingly, increases in inventory balances should be regarded as growth only after confirming inventory age and exit visibility.
According to the August 21 earnings presentation, 93.2% of real estate for sale was acquired in 2023 or later, and the 2025 and 2026 acquisition cohorts alone account for 72.9%. The 6.8% acquired in 2022 or earlier consists almost entirely of leasehold land; the Company expects to sell these properties in response to life events involving land lessees while receiving stable ground rent. This disclosure reduced concerns that most of the inventory consists of long-stagnant properties.
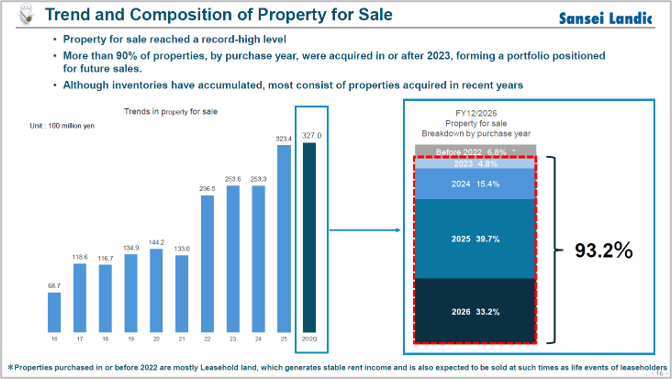
Source: Company materials
The Company raised its 2026 purchase plan from 20.4 billion yen to 22.0 billion yen. First-half purchases were 11.6 billion yen, representing 53% progress, with 10.4 billion yen planned for the second half. This reflects the Company’s policy of purchasing only after securing prospective buyers, along with channel expansion and stronger rights-adjustment capabilities. The Company’s explanation that it is securing sales resources for 2027 onward is consistent with the acquisition timing of current inventory.
On the other hand, interest-bearing debt was 26.0 billion yen, cash and deposits were 6.65 billion yen, and net debt was 19.35 billion yen, equivalent to approximately 1.30x shareholders’ equity of 14.94 billion yen. First-half operating cash flow was positive at 1.798 billion yen, although it declined from the same period of the previous year. Omega Investment positively assesses the recency of inventory, while viewing the lack of disclosure on borrowing rates, the fixed/floating-rate mix, average holding periods, and sales ratios by acquisition year as residual risks.
| Indicator | Value | Category | Assessment |
| Real estate for sale | 32.70 bn yen | Company actual | 93.2% acquired since 2023 |
| 2026 purchase plan | 22.0 bn yen | Company plan | 1H 11.6 bn yen; 2H 10.4 bn yen |
| Interest-bearing debt | 26.00 bn yen | Company actual | Up 0.86 bn yen from year-end |
| Cash and deposits | 6.65 bn yen | Company actual | Up 1.93 bn yen from year-end |
| Net debt | 19.35 bn yen | Omega Investment calculation | Interest-bearing debt – cash and deposits |
| Net debt/shareholders’ equity | 1.30x | Omega Investment calculation | Key indicator of interest-rate sensitivity and shareholder-return capacity |
8. Organizational capabilities and derivative businesses – preparing to support growth from 2028 onward
The Company emphasizes earnings repeatability and business duration; Omega Investment awaits evidence of the profitability of initial investments.
Company disclosure
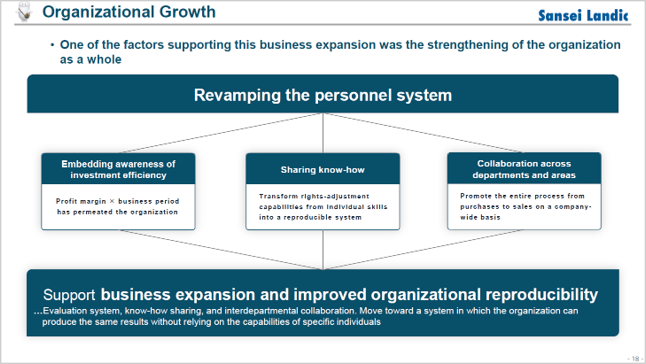
In the August 21 presentation, the Company cited an across-the-board strengthening of the organization as one factor supporting the current business expansion. Through a revamped personnel system, it is incorporating profit margins and business duration into evaluations, shifting rights-adjustment know-how from individual expertise to repeatable processes, and advancing activities from purchasing through sales across departments and regions.
This policy is reasonable given that the Company’s growth constraint lies more in talent development and case-processing capacity than in market size. Even if the number of cases increases, concentrating them among experienced staff can lengthen negotiation periods and reduce gross margins and turnover. Standardizing case selection, legal work, surveys, negotiations, and exit sales should increase the number of cases handled per employee and annualized returns.
Source: Company materials
Time frames for derivative businesses presented by the Company
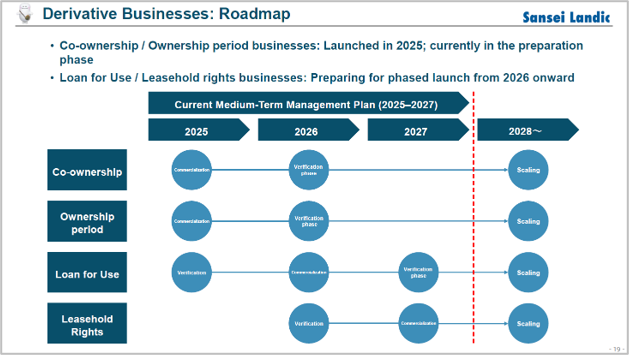
Under the Company’s derivative-business roadmap, co-ownership interests and the holding-period business were commercialized from 2025, with 2026-2027 designated as the verification period and scaling from 2028 onward. Loan-for-use was verified in 2025, commercialized in 2026, and will be re-verified in 2027, with scaling targeted from 2028 onward. Leasehold rights are scheduled for verification in 2026, commercialization in 2027, and scaling from 2028 onward.
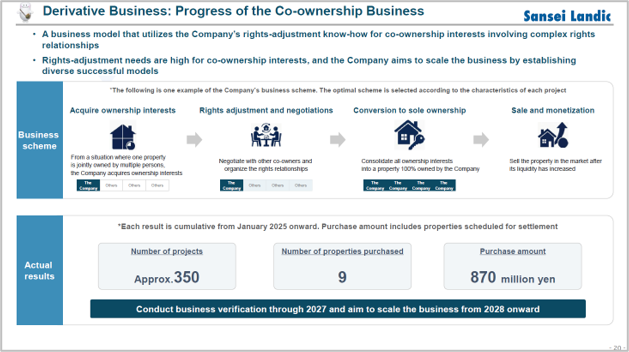
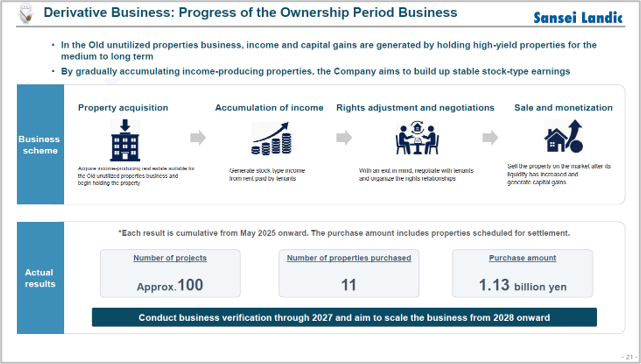
Co-ownership interests have progressed to nine purchases totaling 0.87 billion yen out of approximately 350 cases, while the holding-period business has reached 11 purchases totaling 1.13 billion yen out of approximately 100 cases. The Company plans to continue verifying both businesses through 2027 and target scaling from 2028 onward. These are business-development time frames presented by the Company, not 2030 sales or earnings targets.
Source: Company materials
From an investment perspective
From an investment perspective, case inflow and purchase results in the derivative businesses can now be confirmed. However, sales transaction counts, net sales, gross margins, holding periods, rental yields, and IRR have not been disclosed. In our median 2030 scenario, we incorporate only a limited contribution from derivative businesses and assume that the main drivers of earnings growth are expansion of the existing leasehold land and old unutilized properties businesses and improved turnover. We therefore analyze derivative businesses as additional upside potential.
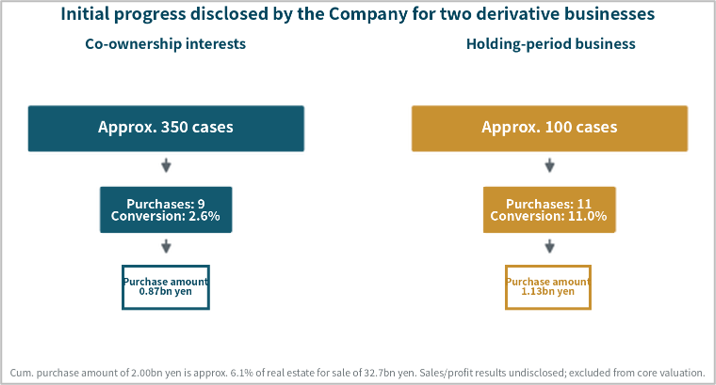
Source: Company earnings presentation; prepared by Omega Investment. Omega Investment calculates conversion rates and the ratio to real estate for sale.
9. In 2030, the core business enters another higher growth phase
The Company has not disclosed numerical targets for 2030. Omega Investment independently forecasts 2030 based on inventory, turnover, and profit margins.
Important: The following 2030 figures are not Company plans. They are Omega Investment estimates based on the Company policy disclosed on August 21, the 2026 Company forecast, real estate for sale, purchase plans, and business mix.
The Company has disclosed earnings forecasts only through FY12/2026; it is scheduled to revise new numerical targets for 2027 around February 2027, and it has not disclosed any 2030 targets. Starting from the Company’s 2026 net sales forecast of 31.0 billion yen, Omega Investment forecasts the 2030 core real estate business using average real estate for sale, inventory turnover, sales mix by product, operating margin, and interest burden.
In the median scenario, we assume average real estate for sale of 41.0-44.0 billion yen, inventory turnover of 0.95-1.00x, net sales of 40.0-44.0 billion yen, and an operating margin of 11%-12%. The central estimate is net sales of 42.0 billion yen, operating income of 4.8 billion yen, and EPS of 175 yen. Growth from the 2026 Company operating income forecast of 3.68 billion yen to 4.8 billion yen in 2030 is approximately 7% annually, broadly consistent with annual net-sales growth of around 8%. Rather than sharply discounting the high 2026 earnings as temporary, we assume the Company maintains a high earnings level through expansion and organizational development in its existing businesses while gradually increasing absolute profit.
In the worst case, purchasing competition, higher interest rates, and weak exit demand reduce turnover to 0.80-0.85x, resulting in net sales of 34.0 billion yen, operating income of 3.1 billion yen, and EPS of 110 yen. This scenario assumes modest net-sales growth from 2026 but a decline in the operating margin to around 9%. In the best case, inventory turnover of 1.05-1.10x, stronger organizational capabilities, and some contribution from derivative businesses result in net sales of 54.0 billion yen, operating income of 6.8 billion yen, and EPS of 250 yen.
The greatest uncertainty in our forecast is the scale and capital efficiency of derivative businesses from 2028 onward. If co-ownership interests and the holding-period business can secure high IRRs, results could move toward the best case. If long-term holdings increase and capital turnover declines, however, ROIC could deteriorate despite higher sales. We will need to reassess our forecasts after the Company releases its new numerical targets around February 2027.
| Year/scenario | Category | Net sales | Operating income | EPS | Key assumptions |
| 2026 | Company forecast | 31.0 bn yen | 3.68 bn yen | 134.62 yen | Company-disclosed full-year forecast |
| 2030 worst case | Omega Investment forecast | 34.0 bn yen | 3.1 bn yen | 110 yen | Turnover 0.80-0.85x; margin around 9%; higher interest rates and weak exit demand |
| 2030 median | Omega Investment forecast | 42.0 bn yen | 4.8 bn yen | 175 yen | Turnover 0.95-1.00x; margin 11%-12%; limited contribution from derivative businesses |
| 2030 best case | Omega Investment forecast | 54.0 bn yen | 6.8 bn yen | 250 yen | Turnover 1.05-1.10x; some contribution from derivative businesses |
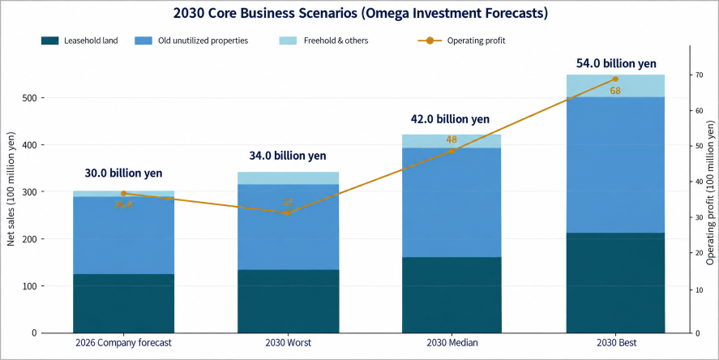
Source: Company earnings presentation; prepared by Omega Investment. 2026 is the Company forecast. 2030 figures are Omega Investment forecasts. The median scenario includes only a limited contribution from derivative businesses, with earnings growth driven mainly by expansion of existing businesses and improved turnover.
10. Direct impact of higher interest rates is limited; share-price valuation hinges on inventory turnover and capital efficiency
Secondary effects on exit prices and the cost of capital are larger than the direct increase in interest expense.
Because the Company holds real estate for sale using borrowings, higher interest rates directly increase interest expense. Based on interest-bearing debt of 26.0 billion yen at the end of June 2026, in an upper-bound scenario in which the entire balance is repriced simultaneously, a 0.5% increase in borrowing rates would raise annual interest expense by 0.13 billion yen, a 1.0% increase by 0.26 billion yen, and a 1.5% increase by 0.39 billion yen. The corresponding after-tax EPS impact would be declines of approximately 5.5 yen, 11.1 yen, and 16.6 yen.
The actual impact would be moderated by the fixed/floating-rate mix, maturity structure, average balance, and refinancing timing. However, because the Company does not disclose these items in sufficient detail, an upper-bound sensitivity analysis is necessary to gauge the size of the risk. Relative to the 2026 Company EPS forecast of 134.62 yen, a 1% interest-rate increase has an approximate 8% direct impact.
The indirect effects are even more important. If buyers face higher borrowing costs, required yields on income-producing properties rise and exit prices decline. If lending standards tighten, sales periods lengthen and the burden of ground rent, management fees, property taxes, and interest increases. At the same time, the cost of equity also rises, reducing the PER and PBR that investors are willing to pay for the same EPS.
Conversely, a gradual rise in interest rates could create medium-term opportunities through competitor exits and lower purchase prices. If less well-capitalized operators reduce purchases and sellers’ need for liquidity increases, Sansei Landic should have a broader set of cases to choose from. Higher interest rates should therefore be assessed separately as a short-term negative for earnings and a potential medium-term positive for market position.
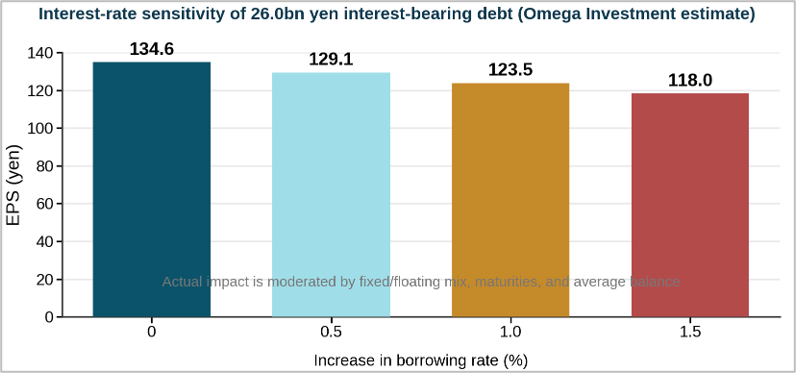
Source: Omega Investment estimates. Assumes full repricing of 26.0 billion yen of interest-bearing debt, a tax rate of 30.6%, and approximately 16.27 million shares outstanding.
| Rate increase | Annual increase in interest expense | After-tax profit decline | EPS decline | Vs. 2026 Company forecast |
| +0.50% | 0.13 bn yen | Approx. 0.09 bn yen | Approx. 5.5 yen | EPS down approx. 4.1% |
| +1.00% | 0.26 bn yen | Approx. 0.18 bn yen | Approx. 11.1 yen | EPS down approx. 8.2% |
| +1.50% | 0.39 bn yen | Approx. 0.271 bn yen | Approx. 16.6 yen | EPS down approx. 12.4% |
11. PER remains low; PBR of 1.0x is a waypoint in the rerating
The Company has a PBR of 1.0x in mind; we assess valuation based on earnings sustainability and the cost of capital
Company view
In its August 21 presentation, the Company framed PBR as ROE x PER. It explained its approach to targeting a PBR of 1.0x through greater confidence in earnings growth, future growth and capital efficiency, and stronger shareholder returns. For 2026, the Company expects record-high net sales and profits and cites investment in derivative businesses, monetization of the Regional Revitalization Promotion Business, greater awareness of investment efficiency, and a substantial dividend increase as factors supporting PBR improvement. The Company explained that PBR had recently risen to approximately 0.9x.
This is the Company’s direction for capital-market engagement, not a guaranteed share-price target. Even if PBR reaches 1.0x, the valuation will not become sustainable if ROE is only temporarily high and PER declines. The Company’s challenge is to translate the high 2026 earnings into repeatable earnings from 2027 onward.
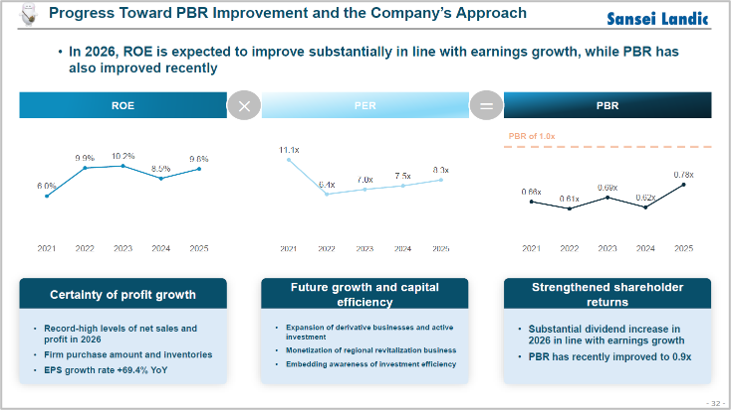
Source: Company materials
From an investment perspective
At the reference share price of 825 yen, PER is approximately 6.1x based on the 2026 Company EPS forecast of 134.62 yen, while estimated PBR is approximately 0.90x based on shareholders’ equity at the end of June 2026. Although the market recognizes the Company’s earnings growth, it continues to apply a discount for deal mix, inventory turnover, interest rates, and operating cash flow sustainability.
Omega Investment’s 12-18 month fair-value range is 1,000-1,200 yen, with a median of 1,100 yen. This combines a PER of 7.4-8.9x, a PBR of 1.08-1.30x, and a dividend yield of 3.1%-3.8%. These are Omega Investment estimates, not Company calculations. If the resetting of numerical targets around February 2027 clarifies targets for ROE, turnover, borrowings, and shareholder returns, the case for PER recovery will strengthen.
Omega Investment’s 2030 future fair-value range is 800-1,000 yen in the worst case, 1,450-1,750 yen in the median case, and 2,200-2,600 yen in the best case. Our median value is 1,600 yen. The median range applies a PER of approximately 8.3-10.0x to EPS of 175 yen and assumes valuation normalizes from the 6x range in 2026, as earnings sustainability and capital efficiency are confirmed. This is a future value as of 2030, not a current target price. The 12-18 month fair value is assessed separately based on the 2026 Company forecast and near-term capital efficiency.
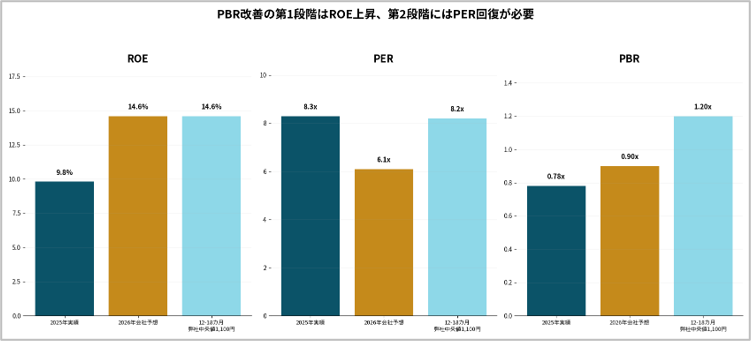
Source: Company earnings presentation; prepared by Omega Investment. 2025 actual figures are from FactSet; 2026 figures are Company forecasts; 12-18 month values are Omega Investment estimates.
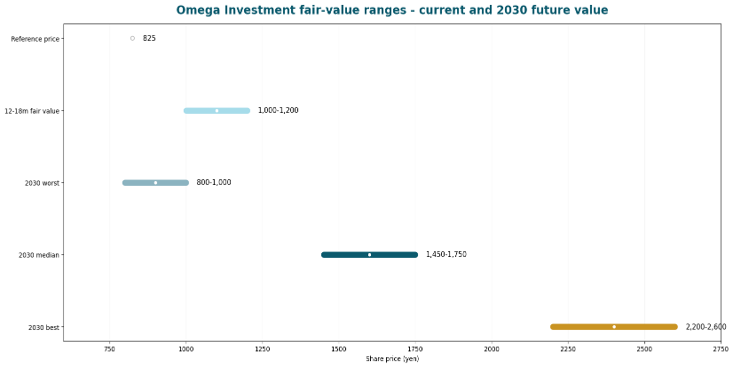
Source: Company earnings presentation; prepared by Omega Investment. Fair-value ranges are Omega Investment estimates. The 2030 range represents future value.
| Valuation metric | Calculation | 12-18 month range | Category |
| PER | EPS 134.62 yen x 7.4-8.9x | 996-1,198 yen | Omega Investment estimate |
| PBR | Estimated BPS 918.6 yen x 1.08-1.30x | 992-1,194 yen | Omega Investment estimate |
| Dividend yield | Company dividend forecast 37.5 yen / 3.1%-3.8% | 987-1,210 yen | Omega Investment estimate |
| Overall | Reflects liquidity, interest rates, and Plan update | 1,000-1,200 yen | Omega Investment fair value |
12. Scope for higher shareholder returns; earnings growth and capital efficiency are key to rerating
There is room for higher dividends, but clear rules are needed to avoid impairing funds for purchases and capital efficiency.
Following the upward revision to its 2026 full-year earnings forecast, the Company raised the year-end dividend from 15 yen to 27 yen, bringing the annual dividend to 37.5 yen on a post-stock-split basis. This represents a payout ratio of 27.9% against the 2026 Company EPS forecast of 134.62 yen. The Company’s basic policy is to provide continuous, stable dividends and proactive shareholder returns in line with earnings.
Viewed solely from the payout ratio, there is scope for additional shareholder returns. The annual dividend payment is approximately 0.61 billion yen, leaving a difference of approximately 1.58 billion yen versus the Company’s net income forecast of 2.19 billion yen. However, the Company needs funds to build real estate for sale, develop derivative businesses, and hold properties in the holding-period business, so accounting earnings and free cash flow do not coincide. Setting a payout ratio consistently above 50% could cause the Company to miss purchasing opportunities.
Omega Investment considers a normal payout ratio of 30%-40%, opportunistic share repurchases when PBR is below 1.0x, and additional returns when inventory is reduced, or extraordinary gains occur, to be a realistic framework. It would be desirable to prioritize progressive dividends and limit share repurchases to cases where net debt, operating cash flow, and the following year’s purchase plan are all within acceptable parameters.
For valuation expansion, the Company needs to disclose not only higher earnings targets but also inventory by cohort, IRR by product, the fixed/floating interest-rate mix, a net-debt ceiling, and criteria for dividends and share repurchases. The key issue when targets are reset around February 2027 will be whether the Company can present net sales and earnings together with capital-efficiency targets.
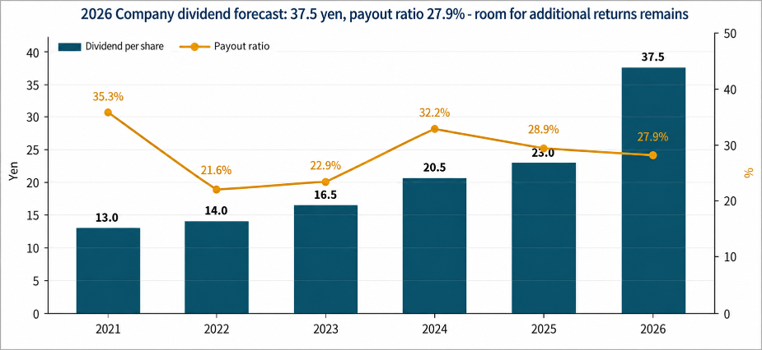
Source: Company earnings presentation; prepared by Omega Investment. The 2026 dividend is the Company’s forecast. The payout ratio is the figure disclosed in Company materials.
| Management action | Specific disclosure/evidence | Expected valuation impact |
| Inventory cohorts | Sales ratio, gross margin, average holding period, and remaining inventory by acquisition year | Make stagnation risk and annualized returns visible |
| Capital efficiency by product | IRR and operating CF for leasehold land, old unutilized properties, co-ownership interests, and holding-period business | Basis for reflecting derivative businesses in corporate value |
| Financial policy | Fixed/floating mix, average interest rate, maturities, and ceiling for net debt/equity | Reduce the interest-rate discount |
| Shareholder-return rules | Payout ratio 30%-40%, share-repurchase conditions, retirement policy | Clarify commitment to per-share value |
| Human capital | Gross profit per employee, number of cases, training period, and rights-adjustment period | Demonstrate the results of organizational development through actual performance. |
13. Medium- to long-term investment view remains bullish; next focus is sustained growth from 2027 onward
The speed of converting inventory into gross profit and cash matters more for the share price than market expansion.
Sansei Landic’s medium- to long-term investment value lies in its ability to use organizational rights-adjustment capabilities to create liquidity for complex properties that are increasing due to inheritance, aging buildings, and co-ownership. The potential stock is large, and case supply is unlikely to dry up in the near term. The Company’s long track record in leasehold land, nationwide offices, broker and financial-institution network, and purchasing with exit buyers in mind are competitive advantages.
At the August 21 earnings briefing, the Company indicated that its 2026 forecast had reached a level substantially above the earnings targets in the current Medium-term Management Plan, and that it plans to revise numerical targets around February 2027 and transition to a new Medium-term Management Plan from 2028. The fact that 93.2% of real estate for sale was purchased in 2023 or later also helps ease concerns about inventory quality.
On the other hand, the high 2026 earnings are influenced by deal mix, with highly profitable cases contributing in both leasehold land and old unutilized properties. Net debt is 19.35 billion yen, or 1.30x shareholders’ equity, leaving the Company exposed to interest rates, lending conditions, and exit prices. Cases and purchases have also been confirmed in derivative businesses, but net sales, gross profit, IRR, and payback periods remain unverified.
Omega Investment estimates a 12-18 month fair-value range of 1,000-1,200 yen, with a median of 1,100 yen, and a 2030 future fair-value range of 800-2,600 yen, with a median of 1,600 yen. Our 2030 median scenario of core net sales of 42.0 billion yen, operating income of 4.8 billion yen, and EPS of 175 yen is not a Company plan. Growth from the 2026 Company operating income forecast of 3.68 billion yen to 4.8 billion yen in 2030 equates to approximately 7% annually. This assumes expansion of existing businesses, stable inventory turnover, and stronger organizational capabilities.
For a PBR above 1.0x to become sustainable over the medium to long term, we believe the Company must maintain ROE above 10% for two to three years, generate positive cumulative operating cash flow over three years, maintain inventory turnover above 0.9x, and establish rules for a 30%-40% payout ratio and opportunistic share repurchases. If these conditions are achieved, we expect PER to recover from the 6x range to 8-10x, supporting a PBR of 1.1-1.3x.
Therefore, our investment conclusion is “bullish over the medium to long term, while in the short term awaiting disclosure of the new numerical targets for 2027 and capital efficiency.” The next important event will be the resetting of numerical targets under the Medium-term Management Plan around February 2027. After already exceeding the current Plan’s earnings targets, the extent to which the Company can quantify its earnings level, ROE, ROIC, inventory turnover, borrowings, and shareholder returns from 2027 onward will determine the next reassessment of the share price.
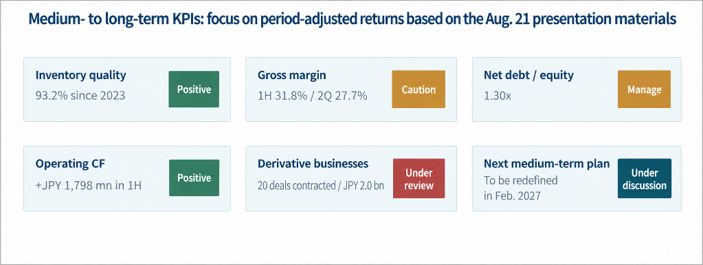
Source: Company earnings presentation; prepared by Omega Investment using Company disclosures, FactSet, and Omega Investment estimates.
| Positive factors | Factors requiring caution |
| • Structural case supply • Expertise in leasehold land and old unutilized properties • 93.2% of inventory acquired since 2023 • 2026 Company forecast is well above current Plan earnings targets • Organizational development and initial progress in derivative businesses |
• Higher mix of old unutilized properties and gross-margin volatility • Net debt of 19.35 bn yen • Sensitivity to interest rates and exit prices • Undisclosed profitability of derivative businesses • Lack of a common market-share denominator and weakness in direct customer acquisition |
Key sources and notes
Notes on data and valuation
Financial data are, in principle, based on FactSet standardized data and may therefore differ from the presentation line items, reclassifications, rounding, segment disclosures, and other details in Company materials. For business-level figures, KPIs, the Medium-term Management Plan, and capital-allocation policies, Company disclosures take precedence and are supplemented as necessary by FactSet and Omega Investment estimates.
Fair values, PER, PBR, ROIC, interest-rate sensitivities, present-value conversions, and other valuation figures and indicators used in this report are Omega Investment estimates based on certain assumptions and do not constitute investment recommendations or guarantees of future share prices or corporate value. The 2030 net sales, earnings, EPS, and fair values are not Company forecasts but Omega Investment scenario analyses.
Key financial data
| Unit: million yen | 2021/12 | 2022/12 | 2023/12 | 2024/12 | 2025/12 | 2026/12 CE |
| Sales | 16,836 | 15,533 | 23,269 | 25,620 | 23,349 | 31,000 |
| EBIT | 1,118 | 1,469 | 2,155 | 1,883 | 2,248 | 3,680 |
| Pretax Income | 1,004 | 1,270 | 1,756 | 1,585 | 1,852 | 3,050 |
| Net Profit Attributable to Owners of Parent | 609 | 1,060 | 1,183 | 1,051 | 1,295 | 2,190 |
| Cash & Short-Term Investments | 5,361 | 3,837 | 3,770 | 5,013 | 4,717 | |
| Total assets | 20,051 | 28,977 | 30,976 | 33,107 | 40,680 | |
| Total Debt | 8,108 | 16,399 | 16,879 | 18,506 | 25,145 | |
| Net Debt | 2,747 | 12,562 | 13,109 | 13,493 | 20,428 | |
| Total liabilities | 9,749 | 17,921 | 18,899 | 20,349 | 27,128 | |
| Total Shareholders’ Equity | 10,302 | 11,056 | 12,077 | 12,759 | 13,551 | |
| Net Operating Cash Flow | 1,705 | -9,268 | -12 | 1,143 | -5,969 | |
| Capital Expenditure | 40 | 28 | 304 | 138 | 217 | |
| Net Investing Cash Flow | -51 | -267 | -766 | -715 | -464 | |
| Net Financing Cash Flow | -608 | 7,971 | 303 | 1,223 | 6,094 | |
| Free Cash Flow | 1,682 | -9,282 | -291 | 1,049 | -6,177 | |
| ROA (%) | 3.04 | 4.32 | 3.95 | 3.28 | 3.51 | |
| ROE (%) | 5.98 | 9.93 | 10.23 | 8.46 | 9.84 | |
| EPS (Yen) | 36.8 | 64.8 | 71.9 | 63.6 | 79.5 | 134.6 |
| BPS (Yen) | 624.7 | 678.4 | 732.7 | 770.9 | 835.0 | |
| Dividend per Share (Yen) | 13.00 | 14.00 | 16.50 | 20.50 | 23.00 | 37.50 |
| Shares Outstanding (Million shares) | 16.95 | 16.98 | 17.17 | 17.17 | 17.17 |
Source: Calculated by Omega Investment based on FactSet’s standard criteria, rounded to the nearest whole number.
Share price
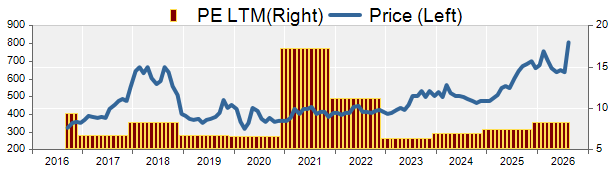
Key stock price data
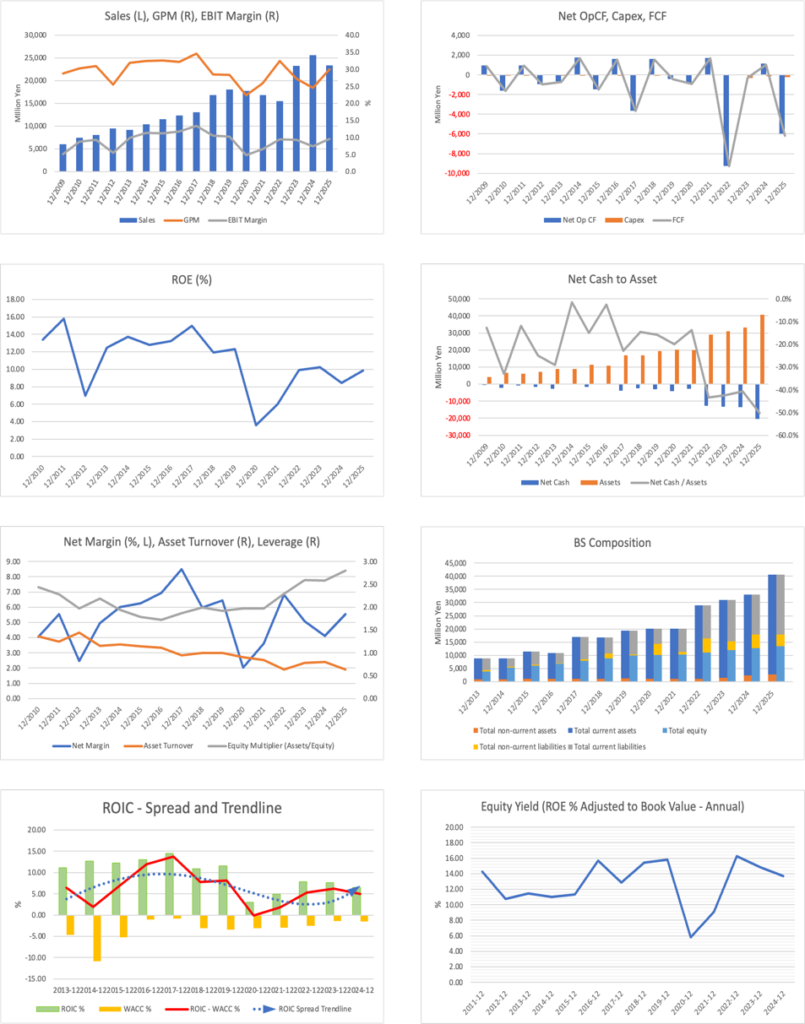
Financial data (quarterly basis)
| Unit: million yen | 2024/12 | 2025/12 | 2026/12 | ||||||
| 2Q | 3Q | 4Q | 1Q | 2Q | 3Q | 4Q | 1Q | 2Q | |
| (Income Statement) | |||||||||
| Sales | 5,785 | 8,358 | 4,270 | 8,848 | 5,664 | 5,202 | 3,634 | 9,607 | 6,984 |
| Year-on-year | 5.3% | 11.7% | 12.3% | 22.8% | -2.1% | -37.8% | -14.9% | 8.6% | 23.3% |
| Cost of Goods Sold (COGS) | 4,228 | 6,448 | 3,122 | 5,842 | 4,062 | 3,684 | 2,767 | 6,264 | 5,056 |
| Gross Income | 1,558 | 1,910 | 1,149 | 3,006 | 1,602 | 1,518 | 868 | 3,342 | 1,928 |
| Gross Income Margin | 26.9% | 22.9% | 26.9% | 34.0% | 28.3% | 29.2% | 23.9% | 34.8% | 27.6% |
| SG&A Expense | 1,102 | 1,125 | 1,077 | 1,200 | 1,168 | 1,108 | 1,271 | 1,302 | 1,395 |
| EBIT | 455 | 785 | 72 | 1,806 | 434 | 410 | -403 | 2,041 | 533 |
| Year-on-year | -15.5% | 16.2% | -140.5% | 216.6% | -4.6% | -47.7% | -662.5% | 13.0% | 22.7% |
| Operating Income Margin | 7.9% | 9.4% | 1.7% | 20.4% | 7.7% | 7.9% | -11.1% | 21.2% | 7.6% |
| EBITDA | 476 | 806 | 92 | 1,827 | 460 | 442 | -372 | 2,071 | 565 |
| Pretax Income | 369 | 728 | -4 | 1,728 | 349 | 313 | -538 | 1,894 | 384 |
| Consolidated Net Income | 245 | 485 | -7 | 1,175 | 236 | 213 | -329 | 1,317 | 267 |
| Minority Interest | 0 | 0 | 0 | 0 | 0 | 0 | 0 | 0 | 0 |
| Net Income ATOP | 245 | 485 | -7 | 1,175 | 236 | 213 | -329 | 1,317 | 267 |
| Year-on-year | -4.0% | 25.2% | -94.9% | 258.2% | -4.0% | -56.1% | 4432.4% | 12.1% | 13.3% |
| Net Income Margin | 4.2% | 5.8% | -0.2% | 13.3% | 4.2% | 4.1% | -9.1% | 13.7% | 3.8% |
| (Balance Sheet) | |||||||||
| Cash & Short-Term Investments | 4,988 | 4,728 | 5,013 | 5,788 | 5,730 | 5,319 | 4,717 | 6,960 | 6,651 |
| Total assets | 30,561 | 29,940 | 33,107 | 31,353 | 32,250 | 35,709 | 40,680 | 44,466 | 43,412 |
| Total Debt | 16,211 | 15,595 | 18,506 | 15,747 | 16,379 | 20,002 | 25,145 | 27,752 | 26,000 |
| Net Debt | 11,223 | 10,867 | 13,493 | 9,959 | 10,649 | 14,683 | 20,428 | 20,792 | 19,350 |
| Total liabilities | 18,163 | 17,173 | 20,349 | 17,712 | 18,471 | 21,832 | 27,128 | 29,821 | 28,469 |
| Total Shareholders’ Equity | 12,398 | 12,768 | 12,759 | 13,641 | 13,779 | 13,877 | 13,551 | 14,645 | 14,943 |
| (Profitability %) | |||||||||
| ROA | 2.66 | 3.02 | 3.28 | 6.14 | 6.01 | 4.93 | 3.51 | 3.79 | 3.88 |
| ROE | 6.74 | 7.32 | 8.46 | 14.73 | 14.43 | 12.13 | 9.84 | 10.16 | 10.22 |
| (Per-share) Unit: JPY | |||||||||
| EPS | 14.9 | 29.3 | -0.4 | 71.2 | 14.5 | 13.1 | -20.3 | 81.2 | 16.4 |
| BPS | 750.6 | 771.4 | 770.9 | 833.0 | 850.8 | 855.0 | 835.0 | 902.4 | 918.8 |
| Dividend per Share | 8.00 | 0.00 | 12.50 | 0.00 | 8.50 | 0.00 | 14.50 | 0.00 | 10.50 |
| Shares Outstanding (million shares) | 17.17 | 17.17 | 17.17 | 17.17 | 17.17 | 17.17 | 17.17 | 17.17 | 17.17 |
Source: Calculated by Omega Investment based on FactSet’s standard criteria, rounded to the nearest whole number.
Financial data (full-year basis)
| Unit: million yen | 2016/12 | 2017/12 | 2018/12 | 2019/12 | 2020/12 | 2021/12 | 2022/12 | 2023/12 | 2024/12 | 2025/12 |
| (Income Statement) | ||||||||||
| Sales | 12,300 | 13,099 | 16,833 | 18,020 | 17,775 | 16,836 | 15,533 | 23,269 | 25,620 | 23,349 |
| Year-on-year | 6.3% | 6.5% | 28.5% | 7.1% | -1.4% | -5.3% | -7.7% | 49.8% | 10.1% | -8.9% |
| Cost of Goods Sold | 8,344 | 8,566 | 12,028 | 12,902 | 13,788 | 12,468 | 10,486 | 16,927 | 19,318 | 16,355 |
| Gross Income | 3,957 | 4,532 | 4,805 | 5,119 | 3,986 | 4,368 | 5,047 | 6,342 | 6,302 | 6,994 |
| Gross Income Margin | 32.2% | 34.6% | 28.5% | 28.4% | 22.4% | 25.9% | 32.5% | 27.3% | 24.6% | 30.0% |
| SG&A Expense | 2,295 | 2,434 | 2,702 | 2,891 | 2,750 | 2,877 | 3,031 | 3,569 | 3,752 | 4,071 |
| EBIT | 1,446 | 1,762 | 1,766 | 1,861 | 847 | 1,118 | 1,469 | 2,155 | 1,883 | 2,248 |
| Year-on-year | 11.2% | 21.9% | 0.2% | 5.4% | -54.5% | 31.9% | 31.5% | 46.7% | -12.6% | 19.4% |
| Operating Income Margin | 11.8% | 13.5% | 10.5% | 10.3% | 4.8% | 6.6% | 9.5% | 9.3% | 7.3% | 9.6% |
| EBITDA | 1,532 | 1,833 | 1,822 | 1,912 | 896 | 1,161 | 1,517 | 2,236 | 1,962 | 2,357 |
| Pretax Income | 1,329 | 1,672 | 1,539 | 1,759 | 712 | 1,004 | 1,270 | 1,756 | 1,585 | 1,852 |
| Consolidated Net Income | 854 | 1,111 | 1,007 | 1,159 | 358 | 609 | 1,060 | 1,183 | 1,051 | 1,295 |
| Minority Interest | 0 | 0 | 0 | 0 | 0 | 0 | 0 | 0 | 0 | 0 |
| Net Income ATOP | 854 | 1,111 | 1,007 | 1,159 | 358 | 609 | 1,060 | 1,183 | 1,051 | 1,295 |
| Year-on-year | 17.9% | 30.2% | -9.4% | 15.1% | -69.1% | 70.5% | 73.9% | 11.6% | -11.2% | 23.2% |
| Net Income Margin | 6.9% | 8.5% | 6.0% | 6.4% | 2.0% | 3.6% | 6.8% | 5.1% | 4.1% | 5.5% |
| (Balance Sheet) | ||||||||||
| Cash & Short-Term Investments | 2,435 | 3,558 | 3,594 | 4,134 | 4,330 | 5,361 | 3,837 | 3,770 | 5,013 | 4,717 |
| Total assets | 10,833 | 16,916 | 16,777 | 19,294 | 20,071 | 20,051 | 28,977 | 30,976 | 33,107 | 40,680 |
| Total Debt | 2,712 | 7,439 | 6,048 | 7,203 | 8,342 | 8,108 | 16,399 | 16,879 | 18,506 | 25,145 |
| Net Debt | 277 | 3,881 | 2,454 | 3,069 | 4,012 | 2,747 | 12,562 | 13,109 | 13,493 | 20,428 |
| Total liabilities | 3,977 | 8,909 | 7,869 | 9,399 | 10,004 | 9,749 | 17,921 | 18,899 | 20,349 | 27,128 |
| Total Shareholders’ Equity | 6,856 | 8,006 | 8,908 | 9,895 | 10,067 | 10,302 | 11,056 | 12,077 | 12,759 | 13,551 |
| (Cash Flow) | ||||||||||
| Net Operating Cash Flow | 1,611 | -3,666 | 1,617 | -420 | -917 | 1,705 | -9,268 | -12 | 1,143 | -5,969 |
| Capital Expenditure | 111 | 57 | 66 | 61 | 21 | 40 | 28 | 304 | 138 | 217 |
| Net Investing Cash Flow | -184 | 107 | -64 | -71 | -288 | -51 | -267 | -766 | -715 | -464 |
| Net Financing Cash Flow | -1,278 | 4,667 | -1,495 | 984 | 953 | -608 | 7,971 | 303 | 1,223 | 6,094 |
| Free Cash Flow | 1,536 | -3,692 | 1,572 | -446 | -923 | 1,682 | -9,282 | -291 | 1,049 | -6,177 |
| (Profitability ) | ||||||||||
| ROA (%) | 7.68 | 8.01 | 5.98 | 6.42 | 1.82 | 3.04 | 4.32 | 3.95 | 3.28 | 3.51 |
| ROE (%) | 13.24 | 14.96 | 11.90 | 12.32 | 3.58 | 5.98 | 9.93 | 10.23 | 8.46 | 9.84 |
| Net Margin (%) | 6.94 | 8.48 | 5.98 | 6.43 | 2.01 | 3.62 | 6.82 | 5.08 | 4.10 | 5.55 |
| Asset Turn | 1.11 | 0.94 | 1.00 | 1.00 | 0.90 | 0.84 | 0.63 | 0.78 | 0.80 | 0.63 |
| Assets/Equity | 1.72 | 1.87 | 1.99 | 1.92 | 1.97 | 1.97 | 2.30 | 2.59 | 2.58 | 2.80 |
| (Per-share) Unit: JPY | ||||||||||
| EPS | 52.5 | 67.2 | 59.8 | 68.5 | 21.2 | 36.8 | 64.8 | 71.9 | 63.6 | 79.5 |
| BPS | 420.7 | 479.0 | 527.2 | 585.1 | 596.5 | 624.7 | 678.4 | 732.7 | 770.9 | 835.0 |
| Dividend per Share | 6.00 | 9.00 | 10.50 | 11.50 | 12.50 | 13.00 | 14.00 | 16.50 | 20.50 | 23.00 |
| Shares Outstanding (million shares) | 16.30 | 16.69 | 16.90 | 16.91 | 16.94 | 16.95 | 16.98 | 17.17 | 17.17 | 17.17 |
Source: Calculated by Omega Investment based on FactSet’s standard criteria, rounded to the nearest whole number.