2026-10-16
Home
Japanese

Omega Investment Co., Ltd.
NADEX (Investment report – Basic)
| Share price (9/18) | ¥1,290 | Dividend Yield (27/4 CE) | 3.1 % |
| 52weeks high/low | ¥1,397/919 | ROE(26/4) | 3.4 % |
| Avg Vol (3 month) | 25.2 thou shrs | Operating margin (TTM) | 3.0 % |
| Market Cap | ¥11.10 bn | Beta (5Y Monthly) | 0.05 |
| Enterprise Value | ¥6.57 bn | Shares Outstanding | 8.606 mn shrs |
| PER (27/4 CE) | 9.7 X | Listed market | TSE Standard section |
| PBR (26/4 act) | 0.5 X |
| Click here for the PDF version of this page |
| PDF version |
Growth businesses are beginning to reshape the sales mix. The next watershed for corporate value is profitability and capital efficiency.
Investment View
The attraction of NADEX’s business lies in its ability to combine joining and processing technologies cultivated over many years, primarily in automotive production equipment, with factory automation, system integration, and procurement capabilities for electronic and electrical control components, enabling it to address issues at customers’ production sites with solutions that go beyond equipment sales alone. While maintaining resistance spot welding control equipment, in which it has strong competitiveness in Japan’s automotive industry, as a business foundation, the Company is extending its technologies and customer base into labor-saving and automation, semiconductor manufacturing processes, logistics automation, and environmental and energy fields, while maintaining the automotive industry as its business foundation, the Company is expanding into new growth markets. In particular, the Smart Energy business in North America has already grown to a scale that can move consolidated net sales, and the ability to extend the technological capabilities and customer touchpoints of existing businesses into new markets is an important strength when considering the Company’s medium- to long-term growth potential.
At 1,291 yen, the share price is 9.7x the forecast EPS of 132.1 yen and 0.50x the latest BPS of 2,569.9 yen. Based on the forecast dividend of 40 yen, the dividend yield is 3.1%, and the forecast earnings yield is 10.3%. The Company’s FY4/27 guidance calls for a substantial increase in both sales and profit, with net sales of 48.0 billion yen and operating profit of 2.2 billion yen. However, we view the current share price as still cautiously valuing the earnings recovery and changes in the business portfolio. Under our estimates using three methods—PBR, DCF, and normalized ROIC—the value per share ranges from 1,550 yen to 2,100 yen, with a median of 1,890 yen. The current share price is below the lower end of this range, and we believe the medium- to long-term valuation bias is upward. The premise, however, is that the Company achieves operating profit of 2.2 billion yen in FY4/27 and carries margin and capital-efficiency improvements into the next medium-term management plan.
At the same time, sales scale alone is not sufficient to lift the share-price valuation by another step. ROE was 3.4% in FY4/26, and the simplified ROE calculated by dividing our forecast EPS of 133.4 yen by the latest BPS is also only 5.2%. There remains a gap between these levels and the medium-term management plan target of 8% ROE and the target of 10% or more toward 2030. Our analysis indicates that ROIC has also declined over the long term, and that the spread over WACC has narrowed since the mid-2010s. This is not a situation in which one should conclude that the ability to create economic value has been lost; rather, it indicates that lower profitability in existing automotive equipment businesses, combined with upfront investment in new fields, has left the Company still in the process of improving its ability to generate profit on invested capital. Investors’ focus from here is likely to shift to how quickly growth in Smart Energy, semiconductors, and logistics automation converts into operating profit margin, ROIC, ROE, and sustainable FCF.
In 1Q FY4/27, net sales were 9.57 billion yen and operating profit was 0.10 billion yen, turning profitable from an operating loss a year earlier. Smart Energy in North America and large automotive equipment projects in Southeast Asia drove higher sales, while Japan posted lower sales and an operating loss. As the Company expects 52% of full-year sales in the second half, it is not appropriate to judge whether the full-year plan can be achieved solely from the 4% operating-profit progress rate in 1Q. However, the more project sales are concentrated in the second half, the more important it becomes to confirm whether margins can be secured at the time of revenue recognition and whether inventories and contract liabilities are converted into sales and cash as planned.
Shareholder returns also support the share-price valuation. The Company targets a total payout ratio of at least 50% and a dividend payout ratio of at least 30% during the medium-term management plan period. It plans an annual dividend of 40 for FY4/27. Share repurchases are also continuing, and as of the end of August 2026, 49.6% of the 200 million yen repurchase authorization for the current fiscal year had been executed. Pursuing an earnings recovery while reducing capital is a reasonable response to a PBR ratio below 1x. It is difficult to say that the current share price prices in even the possibility that the business-structure transformation may face difficulties, while it also does not appear to fully price in the achievement of 8% ROE. Accordingly, if an operating margin in the 4% range becomes established and capital efficiency recovers over the next one to two years, we believe this is likely to lead to a re-rating of the shares.
1. Investment View and Current Share-Price Valuation
The current share price prices in an earnings recovery while remaining cautious on improvement in capital efficiency
The forecast PERof 9.7x at the current share price of 1,291 yen is not an exceptionally low level for a small-cap equipment-related company. However, if the FY4/27 company guidance of 1.05 billion yen in net profit and 2.2 billion yen in operating profit is achieved, it is also difficult to say that the multiple fully discounts the earnings recovery in advance. The PBR ratio of 0.50x is more symbolic. A lower PBR ratio does not automatically mean a stock is undervalued; it must be interpreted relative to ROE, which indicates how much profit is earned on shareholders’ equity, and the cost of capital required by investors. If a forecast ROE of 5.2% may be below the cost of capital, there is some rationale for a PBR ratio materially below 1x.
Even so, the current PBR ratio of 0.50x places only limited value on future improvement. The Company plans to raise its operating margin to 4.6% in FY4/27, up from 3.0% in FY4/26. When the medium-term management plan was formulated, the final-year targets were net sales of 44.3 billion yen, operating profit of 2.2 billion yen, an operating margin of 5.1%, and ROE of 8.0%. Current guidance calls for net sales of 48.0 billion yen, above the original sales target. At the same time, operating profit remains at the original target of 2.2 billion yen, meaning the sales mix shift results in a margin below the initial plan. It is more appropriate to see the Company as entering a phase in which the faster-than-expected expansion of Smart Energy as a new source of sales is again raising the question of how margins should be structured.
The growth rate priced into the shares is also not excessively high. Based on the forecast dividend of 40 yen and a share price of 1,291 yen, the dividend yield is 3.1%. Applying a simple steady-state growth model with a long-term cost of equity assumption of 7.5% suggests that a long-term earnings and dividend growth rate in the low-4% range is one reference point for what the market is currently pricing in. EPS CAGR from FY4/21 to FY4/26 was 6.1%, but EPS fluctuated widely at 60.4 yen, 100.6 yen, 142.9 yen, 96.9 yen, 29.9 yen, and 81.1 yen. Accordingly, 6.1% should not be treated as a stable growth rate. However, the market appears to be pricing in a stable growth rate below the growth indicated by comparing the endpoints of the past five years, suggesting the current share price reflects a considerably cautious view of the business transformation’s results.
All three valuation methods indicate values above the current share price, without assuming excessive improvement in ROE and ROIC
Table 1 Share-price valuation under three methods
| Method | Low | Mid | High | Key assumptions |
| PBR-based | 1,542 yen | 1,670 yen | 1,799 yen | Latest BPS 2,569.9; valuation PBR 0.60x–0.70x, midpoint 0.65x |
| DCF | 1,645 yen | 1,940 yen | 2,110 yen | Normalized FCF 0.85 billion yen–0.95 billion yen; discount rate 7.0%–8.0%; terminal growth 0%–0.5% |
| ROIC-based | 1,663 yen | 1,890 yen | 2,050 yen | Invested capital 16.77 billion yen; net cash 3.53 billion yen; normalized ROIC 5.0%–6.5%; cost of capital 7.5% |
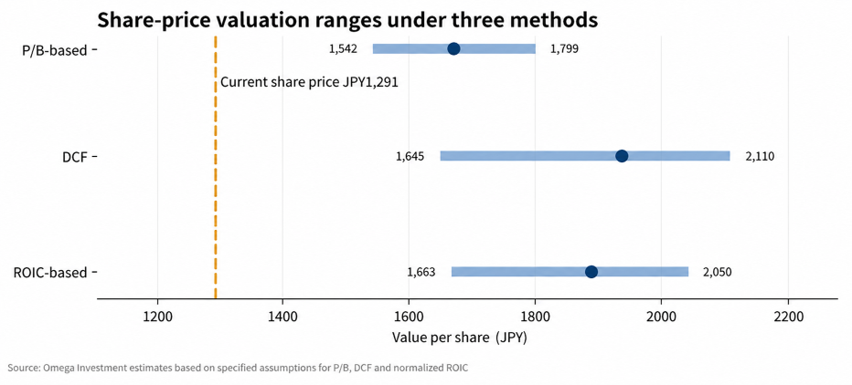
Figure 1 Share-price valuation ranges under three methods
Under the PBR-based method, we do not simply adopt the Company’s target of 1x PBR as fair value. Given that forecast ROE remains low at 5.2%, we use a valuation range of 0.60x to 0.70x. This assumes an improvement from the current 0.50x while conservatively refraining from assigning 1x before ROE reaches 8% to 10%. The midpoint of 0.65x implies 1,670 yen.
Under the DCF method, we do not use FY4/26 FCF of 2.21 billion yen as a permanent level. The FY4/26 operating cash flow of 2.77 billion yen benefited materially from working-capital recovery, driven by declines in trade receivables and inventories. Average FCF over the past five years on a FactSet basis was approximately 0.92 billion yen, and we place this level at the center of normalized FCF. We use a discount rate of 7% to 8%, above the WACC shown in our chart. This reflects the liquidity of a small-cap stock, volatility in project-based businesses, and the short operating track record of new businesses, so we do not overstate long-term value.
Under the ROIC-based method, we estimate invested capital of approximately 16.77 billion yen and net cash of approximately 3.53 billion yen based on shareholders’ equity, debt, and cash at the end of 1Q FY4/27, and set normalized ROIC at 5.0% to 6.5%. This does not assume a return to historically high ROIC levels; instead, it builds in a gradual improvement from current levels. The median of the central values from the three methods is 1,890 yen, and we estimate an overall range of roughly 1,550 yen to 2,100 yen. Actual share prices can fluctuate significantly with earnings performance, interest rates, liquidity, and project profitability, so treat these figures as reference values based on the specified assumptions.
2. Business Model, History, and Management Structure
A technology-oriented trading company integrating manufacturing, trading, and system-integration functions
NADEX was established in 1950 as Nagoya Dengensha and expanded its business from manufacturing and selling resistance welding control equipment. Today, it is a trading company handling industrial equipment and electronic components, a manufacturer with capabilities in resistance welding control equipment, laser processing, and FA equipment, and a system integrator that brings together customers’ production systems from concept and design through fabrication and installation. The Company’s positioning as a total solutions provider stems not from simply expanding the products it handles, but from combining its three functions, manufacturer, trading company, and SI, to address customers’ process issues.
Customers have many points of entry. Relationships may begin with distributorship sales of control components, with specialized technologies such as resistance welding control equipment or laser processing, or with the construction of automated lines using robots. NADEX has a supplier network of more than 1,000 companies in Japan and overseas and handles products from more than 300 material-handling equipment manufacturers in the logistics field. Rather than fitting customers to its own products, the Company can select appropriate equipment from multiple manufacturers and connect the entire system using its own know-how in control, joining, IT, and design. This combination of neutral equipment-selection capabilities and process knowledge differentiates it from a simple machinery trading company.
The core of the manufacturing function is resistance welding control equipment. The Company states that it has the leading share among Japanese automakers and a track record of deliveries to more than 50 countries worldwide. Because resistance spot welding has long been used in mass-production processes for vehicle bodies, NADEX has accumulated know-how not only in selling the control equipment itself but also in welding conditions, quality management, equipment maintenance, and data collection. Even if the absolute number of spot welds is unlikely to rise significantly as vehicles become lighter, use more dissimilar materials, and electrify, the importance of quality assurance and process data is increasing. That is why NADEX is expanding joining from standalone equipment into quality solutions.
The SI function converts these technologies and products into sales. Because it designs production systems to order for customers and handles everything from design and equipment selection to fabrication and commissioning, project values can be large. At the same time, margins can fluctuate with design person-hours, delivery schedules, outsourcing costs, and acceptance timing for each project. Accordingly, when assessing NADEX’s business value, it is necessary to look not only at sales but also at whether the manufacturing function is generating higher value added, whether SI projects are maintaining profitability, and whether the trading function is leading customers into higher-margin solution projects.
The five businesses play different roles: FA for scale, PS for technology, SI for integration, EC for customer touchpoints, and SE for growth.
Table 2: Overview of the five businesses
| Business | FY4/26 sales | Mix | Main activities | Role in corporate value |
| Process Solutions PS | 9.05 billion yen | 24.6% | Resistance welding control, lasers, joining, quality-management IT |
Core proprietary technology; supports margins and differentiation |
| System Integration SI | 5.86 billion yen | 15.9% | Production-equipment concept, design, fabrication, and installation |
Combines Group technologies into large projects |
| Smart Energy SE | 3.68 billion yen | 10.0% | EV charging facilities, monitoring, installation and maintenance |
New North American growth axis; profitability disclosure is the next issue |
| Factory Automation FA | 12.07 billion yen | 32.8% | Robots, labor-saving, logistics automation, FA equipment |
Largest by sales; supports customer touchpoints and cross-market expansion |
| Control Components EC | 6.19 billion yen | 16.8% | Electronic/electrical control components, PCBs, control panels |
Creates stable commercial flows and customer touchpoints |
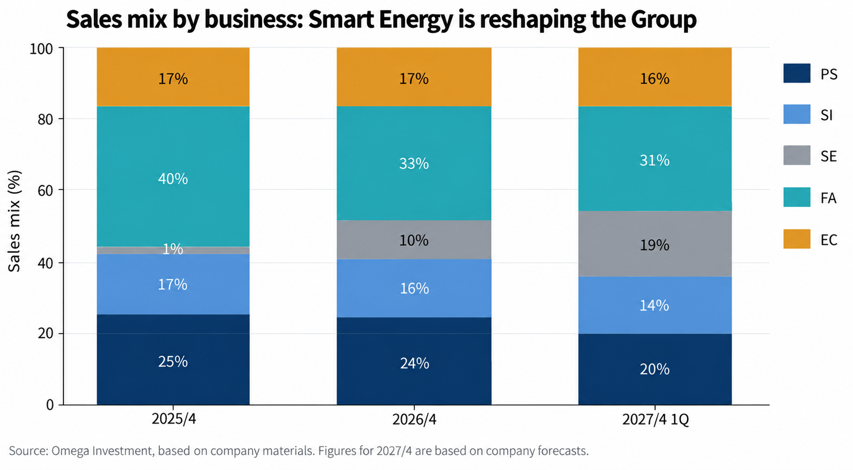
Figure 2 Changes in sales mix by business
From FY4/25 to FY4/26, PS, SI, and FA posted lower sales, while SE increased from 0.33 billion yen to 3.68 billion yen, keeping consolidated net sales roughly flat year on year. In 1Q FY4/27, SE expanded to 19% of sales, with the mix at 31% for FA, 20% for PS, 16% for EC, and 14% for SI. This suggests the medium-term management plan—to offset the cycle in conventional automotive-related capital investment with different sources of demand—is beginning to show in the sales mix. However, because standalone SE profit is not disclosed, it remains necessary to confirm whether the change in sales mix also improves the consolidated margin.
The Company has expanded its business domains step by step from welding to overseas markets, lasers, and energy
Table 3 Key corporate milestones
| Year | Key event | Investment relevance |
| 1950 | Nagoya Dengensha established | Founded to manufacture and sell selenium rectifiers and welding equipment |
| 1957 | Full-scale production and sale of resistance welding control equipment | Established the current technology base |
| 1989 | Predecessor of NADEX OF AMERICA established in the U.S. | Supported overseas expansion by automotive customers |
| 1992 | Company name changed to NADEX | Transitioned to the current brand |
| 1995 | Shares listed OTC | Now listed on the TSE Standard Market |
| 2003 | Local subsidiary established in China | Built a manufacturing and sales structure in China |
| 2008 | Entered Thailand | Captured customer equipment demand in Southeast Asia |
| 2012 | Entered Indonesia | Expanded the ASEAN supply network |
| 2013 | Entered Mexico | Expanded the supply network for North American automotive production |
| 2019 | Tamari Industry became a subsidiary | Strengthened laser-processing and SI technologies |
| 2022 | Transferred to the TSE Standard Market | Market-segment change |
| 2024 | Uptime EV Charger became a subsidiary; investment in Income Power | Entered North American Smart Energy |
| 2025 | NADEX INDIA established | Expanded into India’s manufacturing-automation market |
| 2026 | Robofull became a subsidiary | Strengthened logistics automation and FA for mid-sized companies |
The management structure combines continuity in internal operations with outside perspectives in legal affairs and manufacturing management.
As of July 2026, the Board had six directors, including two Outside Directors, for a 33.3% ratio. Many of the four internal directors have served for 11 years or more, giving the Board strong business understanding and continuity across automotive, FA, and corporate management. The Outside Directors are an attorney and a former manufacturing-company executive, complementing the Board with perspectives in legal and risk management and manufacturing management.
President Daisuke Shindo joined the Company in 2008 and became President & Representative Director in 2023 after experience in corporate planning, administration, and legal affairs. Under a president with experience not only in sales but also in administration and legal affairs, the Company has disclosed a PBR ratio below 1x as a management issue while pursuing share repurchases and investment in new businesses, consistent with the current phase of business transformation. Chairman Masataka Furukawa joined in 2005, became a Director in 2013, and Chairman in 2021, and is positioned to support stable long-term management, including through the Furukawa family’s relationship with major shareholders.
Table 4 Directors as of Sep. 9, 2026
| Name | Position | Age | Years as Director | Shares held | Stake | Profile |
| Masataka Furukawa | Chairman & Director | 58 | 13 years | 233k | 2.78% | Joined in 2005. After roles in General Affairs and the Executive Office, became Director in 2013, Managing Director in 2019, and Chairman in 2021. |
| Daisuke Shindo | President & Representative Director | 54 | 11 years | 40k | 0.48% | Joined in 2008. After corporate planning, corporate administration, and legal affairs, became Director in 2015, Senior Managing Director in 2021, and President in 2023. |
| Katsunori Yokochi | Managing Director, General Manager of Corporate Planning Office | 56 | 11 years | 38k | 0.46% | Joined in 1993. Worked in the Machinery Department and FA Systems business; became Director in 2015 and Managing Director in 2021. |
| Nobuyuki Honda | Director, General Manager of Solution Center | 69 | 11 years | 18k | 0.21% | Joined in 2013 after roles at JFE Steel-related and Panasonic-related companies. Responsible for overseas and welding businesses; became Director in 2015. |
| Yoko Noguchi | Outside Director | 51 | 11 years | — | 0.00% | Attorney, admitted in 2001; currently with and LEGAL. Outside Director since 2015, complementing legal and risk management. |
| Koji Kato | Outside Director | 64 | 1 year | — | 0.00% | Held positions at Aiphone including overseas-subsidiary president, Director, and President & Representative Director—Outside Director since 2025, complementing manufacturing management and technology. |
Table 5 Audit & Supervisory Board Members
| Name | Position | Age | Years as Audit & Supervisory Board Member | Shares held | Profile |
| Osamu Watanabe | Full-time Standing Audit & Supervisory Board Member | 71 | 5 years | 58k | After serving as General Manager of Accounting, Deputy General Manager of Administration, Managing Director, and Senior Managing Director, became a full-time Audit & Supervisory Board Member in 2021. |
| Masanori Senda | Outside Audit & Supervisory Board Member | 71 | 7 years | – | Served as Director and full-time Audit & Supervisory Board Member at Aisan Industry; appointed in 2019. |
| Yoko Yokoi | Outside Audit & Supervisory Board Member | 56 | 3 years | – | Certified public accountant. After Tohmatsu, worked at a CPA office and Sakae Audit Corporation; appointed in 2023. |
3. Earnings Structure by Business, Competitive Strengths, and Customer Industries
Process Solutions: shifting the center of value from joining equipment to quality and process data
The Process Solutions business is a manufacturing business centered on resistance welding control equipment, in which the Company has the leading share in Japan’s automotive industry, combined with laser processing, dissimilar-material joining, and quality-management IT. FY4/26 sales were 9.05 billion yen, down 0.29 billion yen year on year. Sales were roughly flat in Japan, while proprietary-product sales declined in North America. When automakers build new body-production lines for new models, demand for welding control equipment and peripheral equipment rises; conversely, demand for new equipment weakens as existing facilities are rationalized and platforms are shared across vehicle models. The business’s exposure to capital-investment cycles is a weakness.
The competitive axis is not simply the price of welding timers. DAIHEN offers resistance-welding timers, while Dengensha Toa develops control equipment and DX solutions for welding-quality data, broadening competition to control accuracy, quality traceability, robot integration, and maintainability. NADEX’s strength lies in the welding-condition knowledge accumulated over many years in automotive mass-production processes and its ability to span proprietary control equipment, lasers, and SI. Going forward, margins will depend less on changes in the number of weld points than on whether the Company can increase higher-value projects that include quality assurance and process data.
Lasers also serve as a bridge into semiconductors and electronic devices. By including technologies at Tamari Industry, the Group can cover the process from demonstration equipment to mass-production equipment, allowing it to get involved from the customer’s process-development stage. Because semiconductor projects take time before large-volume mass-production equipment is accepted, investors should focus on the number of evaluation projects, the number of mass-production adoptions, equipment unit prices, and gross margins rather than short-term sales.
System Integration: the monetization function that brings total solutions together into large projects
The SI business designs made-to-order production equipment required by customers and handles mechanical and electrical design, fabrication, and commissioning. FY4/26 sales were 5.86 billion yen, down 0.43 billion yen year on year. The main factor was lower automotive-related equipment sales in Japan, while large projects for Japanese automakers contributed in Southeast Asia. In 1Q FY4/27, sales were 1.38 billion yen, down 0.24 billion yen year on year, reflecting lower machine-tool-related equipment sales in Japan.
This business is strategically important because it combines Group technologies and converts them into sales, but the period from order receipt through design, fabrication, and acceptance is long, making quarterly sales and profit volatile. Key indicators for investors are order backlog, acceptance timing, project gross profit, outsourcing costs, and design person-hours. Because the Company does not consistently disclose quarterly order backlog, investors must track project progress indirectly through regional sales, inventories, contract liabilities, and margins. The increase in merchandise and finished goods and contract liabilities in 1Q FY4/27 is consistent with preparations progressing for projects scheduled to be recognized in the second half, but we want to confirm they convert into sales and profit by fiscal year-end.
Factory Automation: the largest business by sales. Can logistics automation reduce automotive dependence?
The FA business is the largest, with FY4/26 sales of 12.07 billion yen, accounting for about 33% of consolidated net sales. It handles everything from robots, assembly machines, processing machines, and inspection machines to complete production lines, combining a trading company’s procurement capabilities with design capabilities. FY4/26 sales decreased by 2.74 billion yen because of lower domestic automotive equipment sales, but 1Q FY4/27 sales increased 11.3% to 2.91 billion yen. The main driver was large automotive projects in Southeast Asia, while sales to electrical equipment-related companies in Japan were weak.
The FA market itself is not limited to automotive applications. According to the International Federation of Robotics (IFR), new global installations of industrial robots were 542,000 units in 2024, exceeding 500,000 units for the fourth consecutive year. Japan declined 4% to 44,500 units, but modest growth is expected in 2025, followed by mid-single-digit growth over the next several years. Even when automotive capital investment is weak, automation demand remains in areas such as labor shortages, logistics rationalization, food, and semiconductors. NADEX’s challenge is to develop this broad demand into orders of similar scale and profitability to its automotive business.
Robofull, which became a subsidiary in May 2026, specializes in robotic automation equipment for mid-sized companies, with strengths in semi-packaged solutions such as palletizing. Unlike conventional made-to-order equipment for major automakers, this model could shorten implementation lead times and increase standardization. If established, it could expand the sales target to small and mid-sized customers while reducing design burdens on individual projects. Going forward, the profitability of standardized equipment, installation numbers, and repeat rates are more important than the absolute scale of Robofull’s sales.
In the competitive environment, robot manufacturers themselves are also moving into solution domains. Yaskawa Electric is using AI robotics to broaden automation of high-mix, low-volume processes that previously depended on human judgment. As robot functionality improves, SI companies must create value beyond simple teaching. For NADEX, key differentiators will include selecting optimal equipment from multiple manufacturers, integrating with WMS and MES, developing equipment concepts based on an understanding of customer processes, and providing post-installation services.
Control Components: not a high-growth business, but a foundation that connects broad customer touchpoints to the next project
The Control Components business centers on distributorship sales of electronic and electrical control components, while also handling PCB design and mounting and control-panel fabrication. FY4/26 sales were 6.19 billion yen, roughly flat year on year, and 1Q FY4/27 sales declined 3.1% to 1.51 billion yen. Standalone product sales tend to carry lower margins than manufacturing businesses, but the business is important as a sales channel into FA, SI, and environment-related products because it allows the Company to understand customers’ equipment-renewal and control needs day to day.
The ability to select products from more than 1,000 suppliers in Japan and overseas helps the Company respond to component shortages and technological change. However, competition with major distributors is strong in electronic components and control equipment, and product differences alone can easily lead to price competition. A key to improving profitability is whether NADEX can expand customer issues beyond individual components into PCBs, control panels, FA equipment, and quality management.
Smart Energy: from a new business to a consolidated growth driver. The next focus is earnings quality.
The SE business centers on Uptime EV Charger, which develops and sells EV-charger monitoring systems in the United States, and Income Power, which handles EV-charger installation and maintenance. Sales increased from 0.33 billion yen in FY4/25 to 3.68 billion yen in FY4/26 and expanded to 1.82 billion yen in 1Q FY4/27. SE accounted for most of the North America segment’s 2.50 billion yen in sales in 1Q. At the same time, North America turned profitable, moving from an operating loss of 0.07 billion yen a year earlier to an operating profit of 0.05 billion yen. SE is therefore no longer merely a future theme; it now affects current consolidated results.
The market direction is favorable. According to the International Energy Agency (IEA), the number of public charging points worldwide exceeded 7 million at the end of 2025, up more than 33% year on year. In the United States, fast and ultra-fast charging points increased by 30% in 2025 to approximately 70,000, while total public charging points are projected to increase from roughly 235,000 to more than 420,000 by 2035. Public charging capacity is expected to expand from approximately 13GW to just under 30GW. Policy support fluctuates, but the market is not supported by NEVI funding alone; structural demand is accumulating for installation, maintenance, and monitoring amid greater EV penetration and rising electricity demand.
At the same time, SE does not disclose standalone operating profit and margin, or the sales mix between construction projects and monitoring services—which investors most want to know. Construction projects can have a large sales scale but also carry heavy working-capital requirements and outsourcing costs, resulting in a different quality of earnings from recurring monitoring and maintenance revenue. Accordingly, further raising the valuation of SE will require information on North America segment margins, operating cash flow, contract continuity, and the service mix. The Company’s strategy of expanding into power-supply solutions, battery energy storage, and distributed power sources is consistent with market opportunities, but we want to confirm whether capital efficiency can improve at the same pace as sales expand.
The customer-industry mix is shifting away from an automotive concentration, although exact industry shares are not disclosed.
NADEX does not disclose sales ratios by customer industry, so this report does not create estimated shares. Major customers identified by the Company include automotive-related companies such as Toyota Motor, DENSO, AISIN, Nissan Motor, Honda Motor, Mazda, and SUBARU, as well as Ibiden, ROHM, Murata Manufacturing, Mitsubishi Electric, and Yamazaki Mazak. For semiconductor and generative-AI manufacturing processes, the Company cites equipment-installation track records at Ibiden, Canon, DENSO, Murata Manufacturing, ROHM, Rapidus, and others. Automotive remains the foundation, while customer touchpoints are increasing in electrical and electronics, semiconductors, machine tools, logistics, and energy.
What matters for investors is not the non-automotive sales ratio itself, but whether non-automotive domains contribute to more stable earnings and improved capital efficiency. If the Company merely transfers large lump-sum equipment orders similar to automotive into other industries, project volatility and working-capital burdens remain. If it can combine different earnings models—such as high-precision processing for semiconductors, standardized equipment for logistics automation, and monitoring and maintenance in SE—the impact of reduced sensitivity to capital-investment cycles can be much larger.
4. FY4/26 Results and FY4/27 Progress
FY4/26: flat sales and a 46.7% rise in operating profit; the main driver was mix change rather than a broad recovery in existing businesses
Consolidated net sales in FY4/26 were 36.84 billion yen, down 0.1% year on year; operating profit was 1.12 billion yen, up 46.7%; ordinary profit was 1.27 billion yen, up 41.9%; and profit attributable to owners of parent was 0.66 billion yen, up 162.0%. Although net sales were flat, gross profit improved, and the operating margin rose from 2.1% to 3.0%. Net profit was also affected by the rebound from special investigation expenses and other costs recorded in the previous year, as well as gains on sales of fixed assets, so it does not represent as straightforward a recovery in the core business as operating profit does. The investment view should therefore focus mainly on operating profit and operating cash flow.
By business, FA declined from 14.80 billion yen to 12.07 billion yen, SI from 6.28 billion yen to 5.86 billion yen, and PS from 9.34 billion yen to 9.05 billion yen. The 3.35 billion yen increase in SE offset lower sales in the three existing businesses, while EC was flat at 6.19 billion yen. Accordingly, it would not be appropriate to describe FY4/26 as a broad recovery in demand for existing automotive equipment. Instead, the value lies in the fact that the Company maintained consolidated sales and increased profit despite weakness in existing businesses.
By region, Japan sales were 27.08 billion yen, down 9.6%, while operating profit rose 24.0% to 0.82 billion yen. The increase in profit despite lower sales suggests that project profitability, pricing measures, and business restructuring are having an effect. North America sales increased 78.8% to 6.81 billion yen and operating profit rose 37.0% to 0.15 billion yen, with SE driving growth. China sales declined 15.9% to 1.38 billion yen, while the operating loss narrowed to 0.06 billion yen. Southeast Asia sales increased 11.9% to 2.63 billion yen, and operating profit rose 36.7% to 0.18 billion yen. Overseas operations cannot be treated as one block: North America is in a new-business phase, China is in restructuring, and Southeast Asia is in automotive equipment.
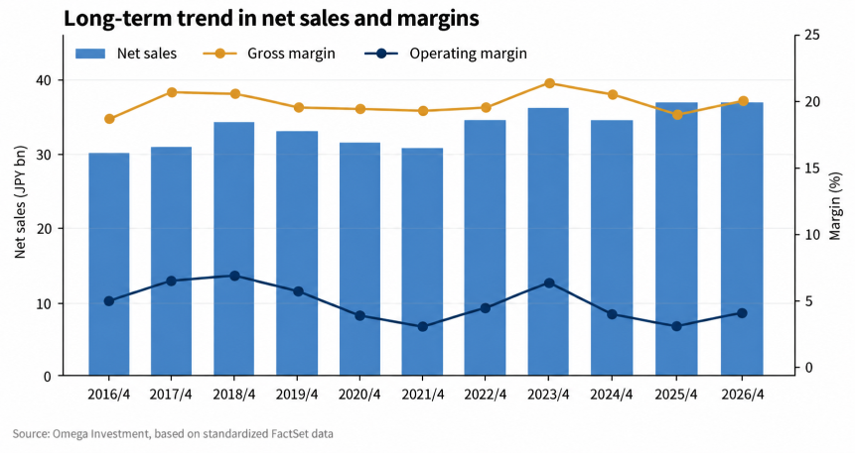
Figure 3 Long-term trend in net sales and margins
FY4/27 company guidance: 48.0 billion yen in sales and 2.2 billion yen in operating profit; the most important point is achieving a 4.6% margin
The Company forecasts FY4/27 net sales of 48.0 billion yen, operating profit of 2.2 billion yen, ordinary profit of 2.2 billion yen, and profit attributable to owners of parent of 1.05 billion yen. Net sales are expected to rise 30.3% and operating profit 96.6%. Sales are 3.7 billion yen above the 44.3 billion yen target set when the medium-term management plan was formulated, while the 2.2 billion yen operating-profit target is unchanged. As a result, the current forecast operating margin is 4.6%, versus 5.1% assumed in the original plan. This can be interpreted as top-line upside from the expansion of SE, with securing margins now becoming the next challenge.
Forecast EPS of 133.4 represents a substantial recovery from 81.1 yen in FY4/26, but simplified ROE calculated using the latest BPS is 5.2%. This remains well below the Company’s medium-term ROE target of 8%. In addition to reducing the denominator through share repurchases and achieving 2.2 billion yen in operating profit, the Company needs to sustain earnings growth under the next plan. The key point is not to treat 8% ROE as a target that must be achieved this fiscal year, but to confirm that improved capital efficiency is visible in both earnings and capital policy.
1Q delivered higher sales and a return to profit; North America and Southeast Asia offset weakness in Japan
In 1Q FY4/27, net sales were 9.57 billion yen, up 23.4% year on year, and operating profit was 0.10 billion yen, turning positive from an operating loss of 0.08 billion yen a year earlier. Ordinary profit was 0.22 billion yen and quarterly profit attributable to owners of parent was 0.01 billion yen. Gross profit rose 0.32 billion yen year on year, despite higher SG&A expenses. Construction of EV charging stations in North America and large automotive-equipment projects in Southeast Asia were the main factors behind the profit improvement.
By region, Japan sales declined 11.7% to 5.65 billion yen, and the segment posted an operating loss of 0.03 billion yen. North America sales were approximately 3.2x higher at 2.50 billion yen, with operating profit turning positive at 0.05 billion yen. China sales increased 54.2% to 0.39 billion yen, and the operating loss improved to 0.02 billion yen. Southeast Asia sales rose 89.0% to 1.27 billion yen, and operating profit increased sharply to 0.09 billion yen. The overseas sales mix rose from approximately 29% in FY4/26 to 43% in 1Q. Because the quarter includes large projects, we do not regard 43% as a new normalized level, but overseas operations are playing a stronger role in offsetting weak domestic demand.
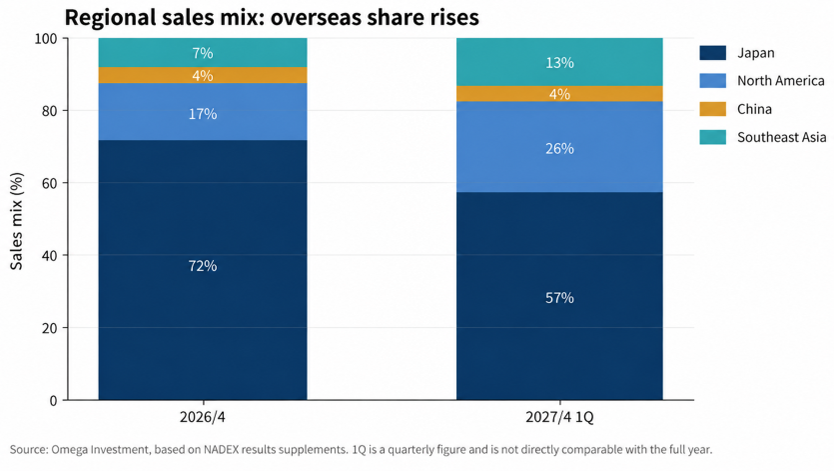
Figure 4 Change in regional sales mix
Second-half weighting is normal seasonality, but balance-sheet movements also warrant attention this year.
The Company explains that sales in FY4/27 will again be concentrated in the second half. The 1Q full-year sales progress rate was 20%, similar to 21% a year earlier. First-half sales guidance of 23.0 billion yen represents 48% of the full-year plan, with 52% expected in the second half. The 1Q operating-profit progress rate is low at 4%, but the Company also posted an operating loss in 1Q of the previous year, so a simple equal quarterly progression does not apply. First-half company guidance calls for operating profit of 0.95 billion yen, implying a sharp increase in profit recognition in 2Q.
Total assets increased from 32.02 billion yen at the end of April 2026 to 37.96 billion yen at the end of 1Q FY4/27. Meanwhile, Company disclosures show increases in merchandise and finished goods, trade receivables and contract assets, contract liabilities, and short-term borrowings. This appears to reflect preparations for large projects and higher advance receipts and does not necessarily indicate financial deterioration. However, it will be important to confirm that inventories convert into sales, contract liabilities into revenue, and trade receivables into cash in the second half.
At the next results announcement, we want to confirm not only net sales and operating profit, but also achievement of first-half operating profit of 0.95 billion yen, the North America segment margin, a return to profitability in Japan, movements in merchandise and finished goods and contract liabilities, and progress in share repurchases. If sales run ahead of the company plan while margins fail to catch up, achieving the 48.0 billion yen sales target alone is unlikely to lead to a higher share-price valuation.
5. Expansion into Growth Markets and Medium-Term Strategy
The medium-term management plan is not to eliminate automotive dependence, but to transfer technologies to different sources of demand.
The 2024–2026 medium-term management plan centers on deepening total solutions and calls for resource allocation to growth markets and growth businesses, development of new markets centered on labor-saving and automation, review of monetization flows, cost reduction and appropriate pricing, and creation of a structure that can mitigate market-cycle effects across the Group. Quantitative targets for FY4/27 are net sales of 44.3 billion yen, operating profit of 2.2 billion yen, ROE of 8%, an equity-to-asset ratio of around 50%, and a cumulative total payout ratio of at least 50% over three years.
After the plan was formulated, the actual growth route changed. Initially, the concept focused on increasing the profit contribution of manufacturing functions such as PS and SI, but North America SE expanded rapidly and shifted the sales mix. The Company is transforming its automotive-centered business structure while updating qualitative measures. Sales are now expected to exceed the original target in the final year of the plan, while margins and ROE have yet to reach the original profile. Closing this gap will be a central theme of the next medium-term management plan.
Semiconductors: market growth is strong, but NADEX’s sales contribution has yet to materialize
In semiconductor and generative-AI manufacturing processes, the Company is extending high-precision processing, inspection, laser, and joining technologies developed in automotive, FA, and machine tools into back-end processes. It provides an integrated response from equipment selection and prior verification through mass-production start-up. It is expanding into dicing, bonding, packaging, visual inspection, marking, HBM, and high-precision processing related to advanced packaging. The company’s materials show installation track records at several major Japanese manufacturers.
The market environment is favorable. Semiconductor Equipment and Materials International (SEMI) forecasts global semiconductor manufacturing equipment sales of 165.9 billion US dollars in 2026, up 23.2% year on year, and 229.5 billion US dollars in 2028. AI infrastructure, advanced logic, high-performance memory, HBM, and investment in test and packaging are growth drivers. The back-end process upgrades targeted by NADEX overlap with the core of market growth.
However, the semiconductor-related market composition shown by the Company is a strategic reference and not an audited sales mix by customer industry. This report does not treat it as an actual sales ratio. Investors should monitor orders for semiconductor equipment, the number of mass-production adoptions, the conversion rate from verification to mass production, and equipment gross margins. In equipment projects where the period to revenue recognition is long, it is important not to anticipate an earnings contribution solely from more exhibitions or inquiries.
Logistics automation: the market is expanding; standardization and upper-level system integration will determine profitability
In logistics automation, the Company proposes not only material-handling equipment such as robots, AGVs, AMRs, and automated warehouses, but also integrated links to upper-level systems such as WMS and MES. The strategy is to extend the in-plant logistics knowledge cultivated in manufacturing to logistics warehouses and mid-sized manufacturers. The Company handles products from more than 300 manufacturers in the logistics field and can select equipment according to each customer’s cargo format, flow lines, and building constraints.
The market’s growth drivers are labor shortages and the shift toward high-mix, low-volume production, which differ from new-model investment in automotive. However, if logistics equipment becomes overly concentrated in large projects, volatility in project profitability and acceptance timing remains. If Robofull’s semi-packaged equipment allows standardized units to be installed in shorter periods, the Company can broaden its customer base while reducing conventional SI design person-hours. Key indicators for the logistics business are project counts, the share of standardized products, installation lead times, gross margins, and maintenance-service sales.
Environment and Energy: from EV charging as an entry point into power management; North America is leading.
In Environment and Energy, North America SE seeks to expand from constructing and monitoring EV charging facilities into operating and optimizing battery energy storage, portable power supplies, and distributed power sources. Rising electricity demand from the expansion of AI and data centers creates market opportunities that do not depend solely on EVs. It is reasonable for the Company to position power-supply solutions as a new growth driver.
At the same time, the power-infrastructure market is affected by regulation, grid connection, subsidies, interest rates, and construction costs. Whether the SE business can maintain its current high growth will depend not only on geographic diversification of orders and project profitability, but also on its ability to accumulate monitoring and maintenance revenue after construction. If the Company can increase recurring revenue by combining software and maintenance rather than growing sales only through large construction projects, it can expect positive effects on both margins and capital efficiency.
India: still at an early stage, but growth in manufacturing automation fits the Company’s technologies
NADEX INDIA was established in October 2025 and began PS and FA operations in January 2026. It is pursuing product and business development with local partners to capture automation demand in manufacturing, including automotive. According to the IFR, industrial-robot installations in India reached a record 9,100 units in 2024, up 7% year on year, with automotive accounting for 45%. India has expanded to become the world’s sixth-largest installation market, and the long-term market opportunity is significant.
However, India’s current contribution to consolidated sales is small, based on disclosed figures. At this early stage, the priority should be acquiring local customers, building the partner network, hiring engineers, increasing the local procurement ratio, and establishing profitability rather than sales. Whether the Company can sell not only to Japanese companies but also to local companies will be a turning point in transforming overseas operations from a customer-following model into an independent growth business.
The next medium-term management plan will test whether the valuation axis can shift from sales scale to ROIC and margins.
The current medium-term management plan ends in FY4/27. The Company has indicated that it intends to maintain the direction of strengthening existing foundations and building new earnings foundations under the next plan. Future numerical targets to watch are not only net sales but also operating margin, ROE, profit by business, operating cash flow, and shareholder returns. In particular, now that SE accounts for a large portion of sales, more extensive disclosure of operating profit by business would make it easier for investors to assess growth quality.
Over the medium to long term, the Company targets ROE of at least 10% and PBR above 1x in FY2030. Raising ROE from the current forecast of 5.2% to 10% will require more than share repurchases. The Company needs to change the sales mix, raise the operating margin, improve working-capital efficiency, and reinvest at an ROIC above the cost of capital. If Smart Energy, semiconductors, and logistics automation create this cycle, a PBR ratio above 1x will have a business-based foundation.
6. Cash Flow, ROE, ROIC, Capital Allocation, and Shareholder Structure
Improved cash flow and lower ROE are not contradictory: cash conversion has preceded the earnings recovery.
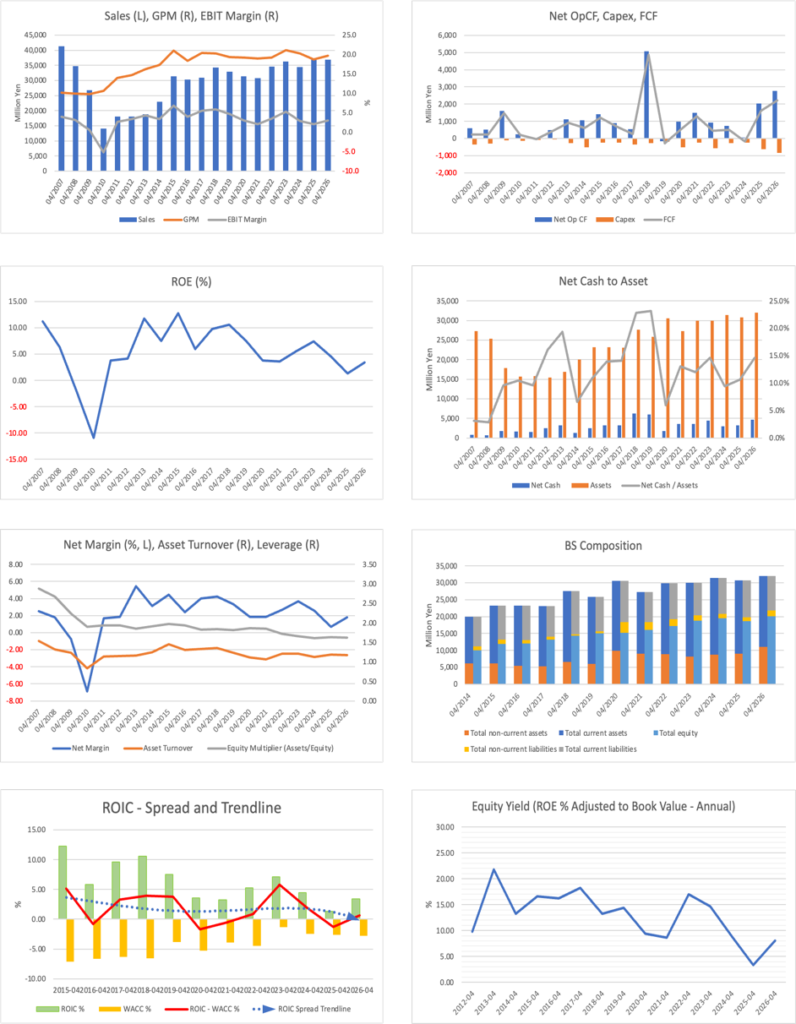
On standardized FactSet data, operating cash flow improved from 0.04 billion yen in FY4/24 to 2.03 billion yen in FY4/25 and 2.77 billion yen in FY4/26. FCF also increased from a deficit of 0.17 billion yen in FY4/24 to 1.63 billion yen in FY4/25 and 2.21 billion yen in FY4/26. Meanwhile, ROE declined from 7.4% in FY4/23 to 4.6% in FY4/24 and 1.3% in FY4/25, then rose to 3.4% in FY4/26. On the surface, cash flow has improved while capital efficiency has deteriorated.
Earnings timing and working capital can explain the difference. FY4/26 operating cash flow benefited from an approximately 2.3 billion yen decline in trade receivables and an approximately 1.0 billion yen decline in inventories, partly offset by lower trade payables. Converting trade receivables and inventories into cash increases operating cash flow, but it does not increase current-period profit by the same amount. After earnings fell sharply in FY4/25, profitability recovered in FY4/26, but profit relative to accumulated shareholders’ equity remains low. Accordingly, the cash flow improvement can be viewed positively in terms of financial quality, but it does not offset the decline in ROE.
The answer to whether the issue is structural or temporary contains elements of both. The sharp decline in net profit in FY4/25 was largely driven by temporary factors, including special investigation expenses, while the ROE recovery in FY4/26 reflects a rebound from those factors. Meanwhile, in the DuPont decomposition, total asset turnover did not deteriorate materially, rising from 1.06x in FY4/21 to 1.17x in FY4/26, while financial leverage only declined gradually from 1.85x to 1.62x. The main driver of lower ROE was the net margin, which fell from 3.7% in FY4/23 to 0.7% in FY4/25 and recovered only to 1.8% in FY4/26. The core issue, therefore, is less that assets are unused than that core business margins have not recovered sufficiently.
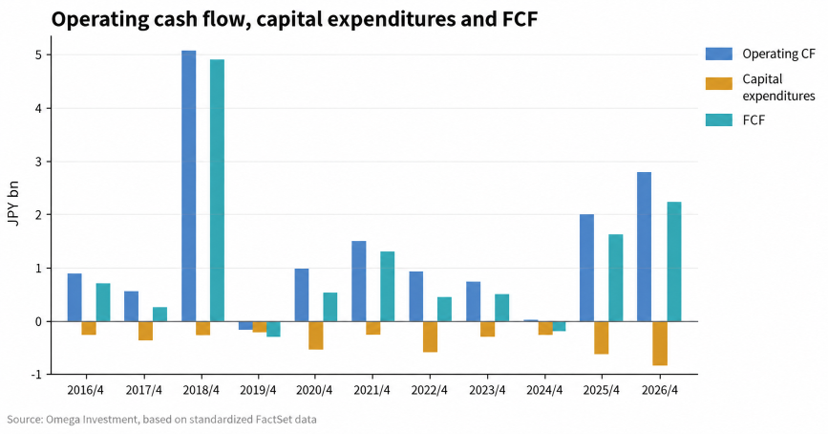
Figure 5 Long-term trend in operating cash flow, capital expenditures, and FCF
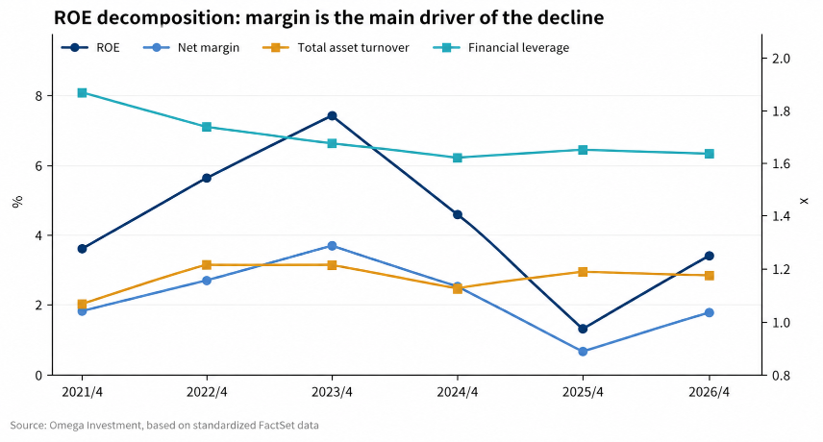
Figure 6 ROE decomposition
The ROIC–WACC spread has narrowed: the phase is now about converting growth investment into economic value.
Our chart shows that ROIC was high in the mid-2010s and has declined over the long term, with the spread over WACC narrowing as well. There have been temporary recoveries in some years, but the trend is that the excess return generated by each yen of invested capital has become smaller. From an investor perspective, it is difficult to overlook that the Company’s ability to create economic value is not as strong as it once was.
However, it is too early to conclude that this represents a permanent decline in business competitiveness. In addition to lower margins in existing automotive equipment, the Company is investing in new business foundations such as Uptime EV Charger, Robofull, and its India operations, so invested capital may grow ahead of profit. If SE becomes established as a contributor to consolidated profit and logistics automation and semiconductors accumulate high-value-added projects, ROIC can improve again. Conversely, if only sales increase while inventories, trade receivables, and goodwill expand, the spread between ROIC and WACC will narrow further.
The Company itself also identifies a PBR ratio below 1x as an important management issue and is taking an integrated approach to earnings power, growth investment, capital efficiency, and shareholder returns. The Company and investors are closely aligned in recognizing the issue. Future valuation should be judged not only on achieving 2.2 billion yen in operating profit, but also on how much invested capital is required to generate that profit.
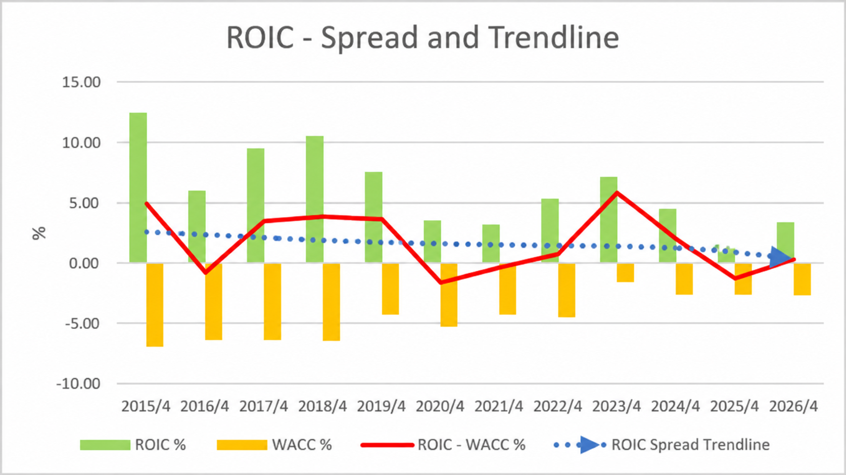
Figure 7 Long-term trend in the ROIC–WACC spread
Earnings yield trended downward in the first half of the 2020s; it recovered in 2026 as earnings improved.
The Equity Yield in our chart declined sharply from FY4/20 through FY4/25 after a temporary rebound in FY4/22, then recovered in FY4/26. This divergence stems from the gap between earnings and share price movements. Earnings fell sharply from EPS of 142.9 yen in FY4/23 to 96.9 yen in FY4/24 and 29.9 yen in FY4/25, while the share price did not decline by the same proportion. The substantial net-asset base, dividends, and share repurchases supported the share price downside, resulting in a lower historical earnings yield.
EPS recovered to 81.1 yen in FY4/26, and dividing the FY4/27 forecast EPS of 132.1 yen used in this report by the current share price gives a forecast earnings yield of 10.3%. Accordingly, the issue for the current share price is not whether it is cheap against past low earnings, but whether the current-year earnings recovery is achieved and can then be sustained. A forecast earnings yield above 10% while ROE remains in the 5% range is also the reverse side of a low share price and a large capital base. This again highlights the need to pursue earnings growth and capital allocation simultaneously.
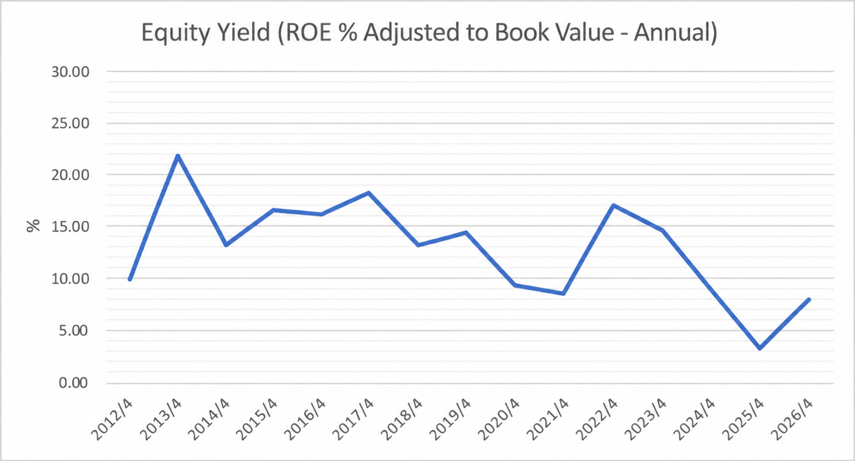
Figure 8 Long-term trend in Equity Yield
Capital allocation is advancing growth investment and shareholder returns simultaneously, while the equity ratio is moving toward the target.
The medium-term management plan targets an equity-to-asset ratio of around 50% and a total payout ratio of at least 50%. It sets out a plan to direct borrowings, cash on hand, and operating cash flow toward growth investment. At the end of 1Q FY4/27, FactSet shareholders’ equity was 20.30 billion yen and total assets were 37.96 billion yen, while the Company-disclosed equity-to-asset ratio had fallen to 53.5%. This is closer to the target range of 60% at the end of April 2026 and reflects a direction of securing growth funding while using borrowing moderately.
However, higher leverage does not mechanically raise ROE; ROIC on investments must exceed the cost of capital. If investments in SE, Robofull, and India convert into profit, the lower equity-to-asset ratio will improve capital efficiency. If profit does not accompany the investment and only working capital increases, the effect will be the opposite, so operating cash-flow trends need continuous monitoring.
Shareholder returns have improved: the annual dividend of 40 yen per share and share repurchases reinforce efforts to address the low PBR ratio.
The annual dividend for FY4/26 was 31 yen, with a payout ratio of 38.2%. For FY4/27, the Company plans a dividend of 40 yen and a payout ratio of approximately 30%. During the medium-term management plan period, the Company targets a total payout ratio of at least 50%; it repurchased 263,000 shares for approximately 250 million yen from March to September 2025 and 195,000 shares for approximately 200 million yen from December 2025 to May 2026, and canceled the acquired shares. The new authorization from June to November 2026 is capped at 230,000 shares and 200 million yen, of which 77,500 shares for 99 million yen had been acquired by the end of August.
Share repurchases are not a magic way to raise the PBR ratio directly, but reducing the share count with excess capital when shares trade at 0.5x PBR tends to favor BPS and future EPS for remaining shareholders. If the Company can continue shareholder returns while securing the funds needed for growth investment, this can support improved capital efficiency. More important than the repurchase amount in a single year is whether the total payout ratio policy and capital-structure policy will continue under the next medium-term management plan.
The shareholder base includes substantial stable holdings, while Fidelity is distinctive for a small-cap stock.
According to FactSet data, as of Sep. 9, 2026, shares outstanding totaled 8.606 million, institutional ownership was 10.17%, and free float was 54.7%. The largest shareholder was Art Gallery Fujimi Co., Ltd., with 1.685 million shares, or 19.58% of shares outstanding. In the Company’s major-shareholder table as of the end of April 2026, the stake was 20.13% using a denominator excluding treasury shares; the difference in percentages mainly reflects the denominator and the reference date.
The second-largest shareholder was Fidelity Management & Research at 9.11%, followed by the NADEX ESOP Trust at 4.94%, the employee shareholding association at 2.96%, Chairman Masataka Furukawa at 2.71%, and Yoshiaki Furukawa at 2.58%. A high proportion of stable shareholders tends to support long-term management, while the number of shares actually traded in the market can be limited. Trading by overseas institutional investors may therefore affect supply and demand in a way that is large relative to the Company’s market capitalization.
Public disclosures on Art Gallery Fujimi show that large-shareholding reports indicate joint holdings with members of the Furukawa family and state that the purpose of holding is to stabilize the Company’s shares. Some disclosures list NADEX Corporate Administration as the contact, making it natural to view Art Gallery Fujimi as a stable shareholder with close ties to the Furukawa family. However, we have not identified primary information confirming the company’s business activities or that it is an asset-management company, so this report makes no further assertions.
Table 6 Major shareholders: FactSet data as of Sep. 9, 2026
| Shareholder | Stake | Shares held | Implication |
| Art Gallery Fujimi Co., Ltd. | 19.58% | 1,685k | Stable holder; appears to have close ties to the Furukawa family |
| Fidelity Management & Research | 9.11% | 784k | Overseas institutional investor; held across multiple funds |
| NADEX ESOP Trust | 4.94% | 425k | Employee incentive scheme |
| NADEX treasury shares | 3.70% | 318k | FactSet figure as of end-Aug. 2026 |
| NADEX Employee Shareholding Association | 2.96% | 255k | Employee ownership |
| Masataka Furukawa | 2.71% | 233k | Chairman & Director |
| Yoshiaki Furukawa | 2.58% | 222k | Individual shareholder |
7. Drivers of the Share Price and Key Investment Focus Going Forward
Over the past five years, earnings and the share price have not moved in perfect alignment, and the market’s assessment of capital policy has become important.
On a year-end closing-price basis, the shares moved from 645 yen in 2020 to 821 yen in 2021, 868 yen in 2022, 1,123 yen in 2023, 900 yen in 2024, and 976 yen in 2025, before reaching 1,291 yen on Sep. 9, 2026. Through 2023, EPS and the share price moved broadly in line. From 2024 to 2025, however, the share price rebounded in 2025 despite a substantial deterioration in earnings. The strength of net assets, dividends, share repurchases, and expectations for an earnings recovery supported the downside of the share price, making the share price less dependent on a single year’s EPS.
After falling to 919 yen on Jun. 10, 2026, the shares rose to 1,393 yen on Jun. 15 following the Jun. 11 announcement of a substantial FY4/27 profit increase forecast and share repurchases. The short-term share-price move appears to reflect a simultaneous evaluation of earnings and capital policy. The 1Q results on Sep. 8 confirmed a return to ordinary profit, but full-year operating-profit progress was only 4%, and the share price fell to 1,289 yen on the day of the announcement. It closed at 1,291 yen the following day. The market appears to value sales growth while withholding strong conviction until second-half profit recognition is confirmed.
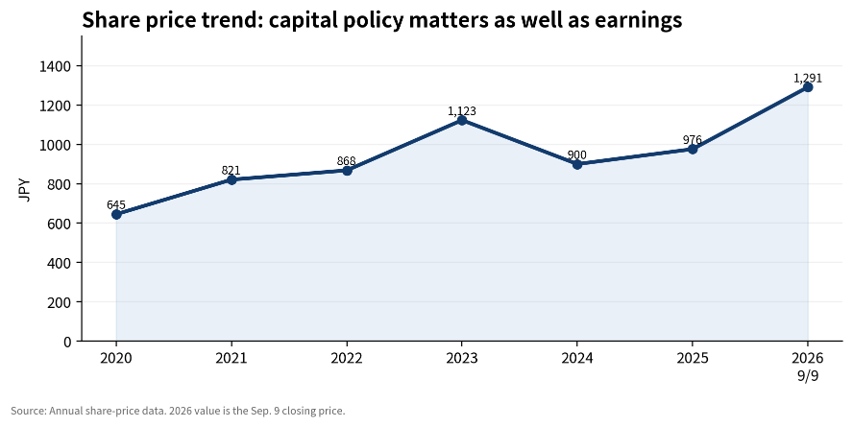
Figure 9 Annual share-price trend
Three upside drivers for the share price: operating margin, SE profit, and capital efficiency
The first upside driver is achievement of FY4/27 operating profit of 2.2 billion yen and an operating margin of 4.6%. Even if net sales reach 48.0 billion yen, a margin remaining in the 3% range would leave questions about the quality of the sales growth. Conversely, if the Company secures a margin in the high-4% range and the market judges that it can target the 5% range under the next plan, concerns about low ROE that underpin the current 0.50x PBR ratio would ease.
The second is greater visibility into SE’s profit contribution. SE reached 19% of the sales mix in 1Q, but standalone profit is unknown. If the North America segment margin improves and recurring revenue from monitoring, maintenance, and power management increases alongside construction sales, the business portfolio transformation will be easier to value more highly.
The third is ROIC and ROE. While investment in new businesses continues, there are periods when capital increases ahead of sales. If operating-profit growth exceeds the increase in invested capital, the spread between ROIC and WACC widens again, and forecast ROE approaches 8%; PBR is less likely to remain anchored in the 0.5x range. Share repurchases complement this improvement, but improved core-business profitability remains the main driver.
Downside factors are project profitability, a reaction to North American growth, domestic demand, and working capital.
The largest downside factor is an increase in low-margin projects while pursuing 48.0 billion yen in sales. SI, FA, and charging-facility construction all require careful management of design, construction, and outsourcing costs at the project level, and rapid sales growth makes cost control more difficult. If sales are concentrated around the interim and year-end periods, delays in acceptance or additional costs could have a significant impact on profit.
Because North America SE has expanded rapidly since FY4/26, its high year-on-year growth rates will eventually decline. U.S. EV policy, permitting for charger installation, grid connection, and construction costs affect demand and project profitability. In Japan, meanwhile, demand for automotive, machine-tool, and electrical equipment remains weak, and the segment posted lower sales and an operating loss in 1Q. Even if SE grows, a delayed earnings recovery in Japan would increase the burden on achieving consolidated operating profit of 2.2 billion yen.
Working capital is another item to monitor. The increase in total assets in 1Q is consistent with preparations for second-half projects, but if inventories and trade receivables remain high through fiscal year-end, they will pressure operating cash flow. FY4/26 FCF of 2.21 billion yen benefited materially from working-capital recovery, so we do not regard it as an annual normalized level. The key is whether earnings and operating cash flow can increase simultaneously.
Items to monitor in upcoming results
Table 7 Earnings monitoring items
| Item | Current status | Key point to monitor |
| Operating margin | FY4/27 plan: 4.6% | Achievement of 0.95 billion yen in 1H and progress toward 2.2 billion yen for the full year; prioritize margin over sales |
| Smart Energy | 1Q sales 1.82 billion yen | North America segment margin; mix of construction vs. monitoring/maintenance; impact on operating CF |
| Japan business | 1Q operating loss 0.03 billion yen | Demand recovery and project profitability in automotive, machine tools, and electrical equipment |
| Semiconductors | Sales mix not disclosed | Conversion from evaluation projects to mass production, equipment orders, gross profit |
| Logistics automation | Robofull consolidation started | Number and profitability of standardized-equipment installations; cross-selling |
| Working capital | 1Q total assets 37.96 billion yen | Whether inventories, contract liabilities, and trade receivables convert into sales and cash |
| ROIC / ROE | Simplified ROE 5.2% | Whether earnings growth exceeds growth in invested capital; whether the ROIC–WACC spread improves |
| Shareholder returns | 40 dividend; returns of at least 50% | Execution of share repurchases; return and capital-structure policy in the next medium-term plan |
Key investment focus for NADEX shares going forward
NADEX is not at a point where it has already transformed from a mature automotive-equipment-related company into a new growth company; rather, the transformation has only now become visible in consolidated sales. The fact that North America SE has risen above 10% of consolidated sales and to nearly 20% in 1Q is significant. Semiconductors, logistics automation, and India are also strategically consistent as extensions of the Company’s existing joining, FA, and SI technologies into other markets. The Company now has more potential growth drivers for corporate value than before.
At the same time, ROE and ROIC remain low, which helps explain the 0.50x PBR ratio. Our chart shows a narrowing spread between ROIC and WACC, while earnings yield declined through the first half of the 2020s. The FY4/26 cash-flow improvement benefited from working-capital recovery, and profitability should not be judged solely on FCF. For that reason, the current investment view focuses not on the low PBR ratio itself, but on whether margins and capital efficiency improve at the same time.
Against our estimated share-price valuation range of 1,550 yen to 2,100 yen and median of 1,890 yen, the current share price is 1,291 yen. Even allowing for some uncertainty over the FY4/27 earnings recovery, we view the current share price, which is below the lower end of all three methods, as a level that can be assessed positively for medium- to long-term investment. A significant rise in the share price does not require adding new themes. It comes down to fully achieving 2.2 billion yen in operating profit, making SE’s profit contribution visible and improving capital efficiency. We view the next one to two years as the period in which progress in monetization will connect corporate value and the share price.
Conclusion
The current share price remains cautious on the early results of the business-structure transformation. We believe the medium- to long-term valuation bias is upward, but the core points investors should confirm are not sales expansion itself, but establishment of an operating margin in the high-4% range, SE’s profit contribution, and improvement in capital efficiency.
Notes
- The share price is the Sep. 9, 2026 closing price of 1,291 yen. The year-to-date high is 1,393 yen and the year-to-date low is 919 yen.
- Forecast EPS is the 132.1 yen figure specified in this report. The latest BPS is 2,569.9 yen at the end of 1Q FY4/27 based on standardized FactSet data. Forecast ROE is 5.2%, calculated using the simplified method of dividing 133.4 by 2,569.9 yen. The forecast dividend is the Company’s 40 yen guidance.
- Market capitalization is 11.11 billion yen, calculated by multiplying 8.606 million shares outstanding by the 1,291 yen share price. PER, PBR, dividend yield, and earnings yield are calculated by us based on the assumptions above.
- Financial data generally refer to standardized FactSet data and may therefore differ in some respects from presentation items, reclassifications, rounding, and segment disclosures in Company materials. Company materials are given priority for business-level figures, KPIs, medium-term plans, and capital-allocation policies, supplemented as necessary by FactSet and our estimates.
- Valuation figures based on PBR, DCF, and ROIC are our estimates using specified assumptions and do not guarantee future share prices or corporate value. The DCF does not use FY4/26 FCF as-is, but normalizes it with reference to the past five years of FCF. The ROIC-based method is a reference valuation using normalized ROIC and a cost-of-capital assumption.
- We organized the long-term trends in ROIC, WACC, and Equity Yield based on FactSet data and GuruFocus. We used verifiable figures and did not fill gaps with estimates.
- We could not confirm English versions of the Company’s FY4/26 and 1Q FY4/27 results supplementary materials containing the same charts, so this report does not reproduce charts from Company materials and uses only charts prepared by us.
- For management information, priority was given to the Annual Securities Report filed on Jul. 27, 2026 and the Company website. FactSet data differ from the latest Company disclosures for some Board composition and shareholding figures, so we used the latest Company disclosures.9. This is a sponsored report prepared at the request of the subject company as an informational document. It does not solicit or recommend the purchase, sale, or any other investment action in any specific security. The views and estimates presented are based on information available as of the date of preparation and do not guarantee future results.
Key financial data
| Unit: million yen | 2022/4 | 2023/4 | 2024/4 | 2025/4 | 2026/4 | 2027/4 CE |
| Sales | 34,581 | 36,195 | 34,436 | 36,891 | 36,838 | 48,000 |
| EBIT | 1,210 | 1,934 | 1,002 | 763 | 1,119 | 2,200 |
| Pretax Income | 1,402 | 1,949 | 1,218 | 720 | 1,293 | |
| Net Profit Attributable to Owner of Parent | 935 | 1,331 | 875 | 252 | 660 | 1,050 |
| Cash & Short-Term Investments | 4,872 | 5,125 | 4,483 | 3,629 | 4,762 | |
| Total assets | 29,900 | 29,961 | 31,382 | 30,783 | 32,022 | |
| Total Debt | 1,268 | 736 | 1,525 | 352 | 96 | |
| Net Debt | -3,605 | -4,389 | -2,957 | -3,277 | -4,666 | |
| Total liabilities | 12,564 | 11,062 | 11,786 | 11,846 | 11,426 | |
| Total Shareholders’ Equity | 17,228 | 18,773 | 19,457 | 18,616 | 20,153 | |
| Net Operating Cash Flow | 921 | 730 | 42 | 2,028 | 2,773 | |
| Capital Expenditure | 575 | 282 | 243 | 613 | 841 | |
| Net Investing Cash Flow | -856 | 154 | -638 | -1,053 | -763 | |
| Net Financing Cash Flow | -607 | -937 | -370 | -1,896 | -977 | |
| Free Cash Flow | 440 | 504 | -167 | 1,628 | 2,208 | |
| ROA (%) | 3.27 | 4.45 | 2.85 | 0.81 | 2.10 | |
| ROE (%) | 5.63 | 7.39 | 4.58 | 1.32 | 3.40 | |
| EPS (Yen) | 100.6 | 142.9 | 96.9 | 29.9 | 81.1 | 132.1 |
| BPS (Yen) | 1,851.7 | 2,013.2 | 2,235.1 | 2,237.6 | 2,536.2 | |
| Dividend per Share (Yen) | 33.00 | 43.00 | 35.00 | 33.00 | 31.00 | 40.00 |
| Shares Outstanding (Million shares) | 9.61 | 9.61 | 9.61 | 9.06 | 8.80 |
Source: Calculated by Omega Investment based on FactSet’s standard criteria, rounded to the nearest whole number.
Share price
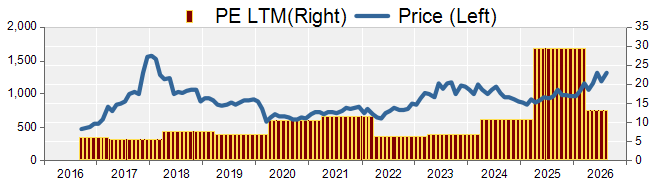
Key stock price data
Financial data (quarterly basis)
| Unit: million yen | 2025/5 | 2026/4 | 2027/4 | ||||||
| 1Q | 2Q | 3Q | 4Q | 1Q | 2Q | 3Q | 4Q | 1Q | |
| (Income Statement) | |||||||||
| Sales | 7,143 | 9,394 | 9,447 | 10,907 | 7,760 | 9,089 | 7,641 | 12,347 | 9,572 |
| Year-on-year | -12.4% | 18.2% | 31.2% | -1.7% | 8.6% | -3.2% | -19.1% | 13.2% | 23.4% |
| Cost of Goods Sold (COGS) | 5,822 | 7,719 | 7,641 | 8,802 | 6,406 | 7,205 | 5,965 | 9,986 | 7,898 |
| Gross Income | 1,321 | 1,675 | 1,806 | 2,105 | 1,354 | 1,884 | 1,676 | 2,362 | 1,675 |
| Gross Income Margin | 18.5% | 17.8% | 19.1% | 19.3% | 17.4% | 20.7% | 21.9% | 19.1% | 17.5% |
| SG&A Expense | 1,483 | 1,610 | 1,529 | 1,523 | 1,436 | 1,447 | 1,494 | 1,780 | 1,579 |
| EBIT | -162 | 65 | 277 | 582 | -83 | 438 | 183 | 582 | 96 |
| Year-on-year | -187.3% | -58.7% | -829.0% | -9.2% | -49.0% | 571.7% | -34.1% | -0.1% | -216.2% |
| Operating Income Margin | -2.3% | 0.7% | 2.9% | 5.3% | -1.1% | 4.8% | 2.4% | 4.7% | 1.0% |
| EBITDA | -0 | 243 | 462 | 753 | 104 | 603 | 365 | 766 | 277 |
| Pretax Income | -153 | -96 | 242 | 727 | -45 | 443 | 102 | 794 | 221 |
| Consolidated Net Income | -171 | -224 | 128 | 539 | -107 | 287 | -9 | 593 | 80 |
| Minority Interest | -1 | -1 | 0 | 23 | 22 | 49 | -10 | 43 | 68 |
| Net Income ATOP | -170 | -222 | 128 | 516 | -129 | 238 | 1 | 550 | 12 |
| Year-on-year | -171.6% | -441.6% | -1306.9% | -1.0% | -23.8% | -207.1% | -99.2% | 6.6% | -109.4% |
| Net Income Margin | -2.4% | -2.4% | 1.4% | 4.7% | -1.7% | 2.6% | 0.0% | 4.5% | 0.1% |
| (Balance Sheet) | |||||||||
| Cash & Short-Term Investments | 4,219 | 4,233 | 4,130 | 3,629 | 3,112 | 3,889 | 3,656 | 4,762 | 4,753 |
| Total assets | 30,558 | 29,712 | 31,477 | 30,783 | 28,708 | 29,935 | 29,651 | 32,022 | 37,957 |
| Total Debt | 648 | 288 | 1,128 | 352 | 108 | 48 | 93 | 96 | 1,221 |
| Net Debt | -3,571 | -3,945 | -3,001 | -3,277 | -3,003 | -3,840 | -3,562 | -4,666 | -3,532 |
| Total liabilities | 11,443 | 11,545 | 12,725 | 11,846 | 10,234 | 10,729 | 10,203 | 11,426 | 17,146 |
| Total Sharehjolders’ Equity | 18,952 | 18,007 | 18,580 | 18,616 | 18,131 | 18,806 | 19,056 | 20,153 | 20,299 |
| (Profitability %) | |||||||||
| ROA | 1.33 | 0.39 | 0.84 | 0.81 | 0.99 | 2.52 | 2.05 | 2.10 | 2.40 |
| ROE | 2.14 | 0.64 | 1.39 | 1.32 | 1.58 | 4.09 | 3.33 | 3.40 | 4.17 |
| (Per-share) Unit: | |||||||||
| EPS | -19.8 | -26.3 | 15.2 | 62.0 | -15.6 | 29.3 | 0.1 | 69.2 | 1.5 |
| BPS | 2,238.3 | 2,143.8 | 2,216.4 | 2,237.6 | 2,203.4 | 2,312.0 | 2,366.0 | 2,536.2 | 2,569.9 |
| Dividend per Share | 0.00 | 11.00 | 0.00 | 22.00 | 0.00 | 11.00 | 0.00 | 20.00 | 0.00 |
| Shares Outstanding (milion shares) | 9.06 | 9.06 | 9.06 | 9.06 | 9.06 | 9.06 | 8.80 | 8.80 | 8.61 |
Source: Calculated by Omega Investment based on FactSet’s standard criteria, rounded to the nearest whole number.
Financial data (full-year basis)
| Unit: million yen | 2017/4 | 2018/4 | 2019/4 | 2020/4 | 2021/4 | 2022/4 | 2023/4 | 2024/4 | 2025/4 | 2026/4 |
| (Income Statement) | ||||||||||
| Sales | 30,951 | 34,284 | 32,913 | 31,379 | 30,736 | 34,581 | 36,195 | 34,436 | 36,891 | 36,838 |
| Year-on-year | 2.2% | 10.8% | -4.0% | -4.7% | -2.1% | 12.5% | 4.7% | -4.9% | 7.1% | -0.1% |
| Cost of Goods Sold | 24,623 | 27,309 | 26,568 | 25,360 | 24,889 | 27,920 | 28,541 | 27,449 | 29,984 | 29,562 |
| Gross Income | 6,328 | 6,975 | 6,345 | 6,019 | 5,846 | 6,661 | 7,654 | 6,987 | 6,907 | 7,276 |
| Gross Income Margin | 20.4% | 20.3% | 19.3% | 19.2% | 19.0% | 19.3% | 21.1% | 20.3% | 18.7% | 19.8% |
| SG&A Expense | 4,622 | 4,944 | 4,783 | 5,085 | 5,219 | 5,451 | 5,720 | 5,985 | 6,146 | 6,160 |
| EBIT | 1,706 | 2,031 | 1,563 | 934 | 627 | 1,210 | 1,934 | 1,002 | 763 | 1,119 |
| Year-on-year | 42.5% | 19.0% | -23.1% | -40.2% | -32.8% | 92.8% | 59.9% | -48.2% | -23.9% | 46.7% |
| Operating Income Margin | 5.5% | 5.9% | 4.7% | 3.0% | 2.0% | 3.5% | 5.3% | 2.9% | 2.1% | 3.0% |
| EBITDA | 2,297 | 2,605 | 2,081 | 1,558 | 1,548 | 2,029 | 2,646 | 1,696 | 1,458 | 1,838 |
| Pretax Income | 1,741 | 2,136 | 1,610 | 981 | 897 | 1,402 | 1,949 | 1,218 | 720 | 1,293 |
| Consolidated Net Income | 1,238 | 1,462 | 1,137 | 643 | 557 | 947 | 1,336 | 885 | 273 | 763 |
| Minority Interest | 5 | 5 | 30 | 69 | -3 | 12 | 5 | 10 | 21 | 103 |
| Net Income ATOP | 1,233 | 1,457 | 1,107 | 574 | 560 | 935 | 1,331 | 875 | 252 | 660 |
| Year-on-year | 71.3% | 18.2% | -24.0% | -48.1% | -2.4% | 66.9% | 42.4% | -34.3% | -71.2% | 162.0% |
| Net Income Margin | 4.0% | 4.3% | 3.4% | 1.8% | 1.8% | 2.7% | 3.7% | 2.5% | 0.7% | 1.8% |
| (Balance Sheet) | ||||||||||
| Cash & Short-Term Investments | 4,045 | 6,756 | 6,233 | 6,203 | 5,196 | 4,872 | 5,125 | 4,483 | 3,629 | 4,762 |
| Total assets | 23,098 | 27,598 | 25,791 | 30,525 | 27,296 | 29,900 | 29,961 | 31,382 | 30,783 | 32,022 |
| Total Debt | 795 | 454 | 259 | 4,383 | 1,638 | 1,268 | 736 | 1,525 | 352 | 96 |
| Net Debt | -3,250 | -6,302 | -5,973 | -1,820 | -3,558 | -3,605 | -4,389 | -2,957 | -3,277 | -4,666 |
| Total liabilities | 9,832 | 13,267 | 10,676 | 15,224 | 11,185 | 12,564 | 11,062 | 11,786 | 11,846 | 11,426 |
| Total Shareholders’ Equity | 13,258 | 14,319 | 15,077 | 15,195 | 16,011 | 17,228 | 18,773 | 19,457 | 18,616 | 20,153 |
| (Cash Flow) | ||||||||||
| Net Operating Cash Flow | 556 | 5,078 | -156 | 972 | 1,480 | 921 | 730 | 42 | 2,028 | 2,773 |
| Capital Expenditure | 344 | 259 | 188 | 523 | 234 | 575 | 282 | 243 | 613 | 841 |
| Net Investing Cash Flow | -349 | -1,650 | -340 | -1,804 | 447 | -856 | 154 | -638 | -1,053 | -763 |
| Net Financing Cash Flow | -467 | -766 | -591 | 1,193 | -2,940 | -607 | -937 | -370 | -1,896 | -977 |
| Free Cash Flow | 264 | 4,866 | -295 | 526 | 1,300 | 440 | 504 | -167 | 1,628 | 2,208 |
| (Profitability ) | ||||||||||
| ROA (%) | 5.32 | 5.75 | 4.15 | 2.04 | 1.94 | 3.27 | 4.45 | 2.85 | 0.81 | 2.10 |
| ROE (%) | 9.73 | 10.57 | 7.53 | 3.79 | 3.59 | 5.63 | 7.39 | 4.58 | 1.32 | 3.40 |
| Net Margin (%) | 3.98 | 4.25 | 3.36 | 1.83 | 1.82 | 2.70 | 3.68 | 2.54 | 0.68 | 1.79 |
| Asset Turn | 1.34 | 1.35 | 1.23 | 1.11 | 1.06 | 1.21 | 1.21 | 1.12 | 1.19 | 1.17 |
| Assets/Equity | 1.83 | 1.84 | 1.82 | 1.86 | 1.85 | 1.72 | 1.66 | 1.60 | 1.63 | 1.62 |
| (Per-share) Unit: | ||||||||||
| EPS | 132.3 | 157.7 | 119.9 | 62.1 | 60.4 | 100.6 | 142.9 | 96.9 | 29.9 | 81.1 |
| BPS | 1,423.0 | 1,552.6 | 1,632.0 | 1,641.5 | 1,724.8 | 1,851.7 | 2,013.2 | 2,235.1 | 2,237.6 | 2,536.2 |
| Dividend per Share | 27.00 | 48.00 | 36.00 | 19.00 | 19.00 | 33.00 | 43.00 | 35.00 | 33.00 | 31.00 |
| Shares Outstanding (million shares) | 9.61 | 9.61 | 9.61 | 9.61 | 9.61 | 9.61 | 9.61 | 9.61 | 9.06 | 8.80 |
Source: Calculated by Omega Investment based on FactSet’s standard criteria, rounded to the nearest whole number.