2026-09-29
Home
Japanese

Omega Investment Co., Ltd.
FURYU (Investment report – Basic report)
| Share price (10/7) | ¥1,418 | Dividend Yield (27/3 CE) | 2.8 % |
| 52weeks high/low | ¥1,484/1,004 | ROE(26/3 act) | 9.0 % |
| Avg Vol (3 month) | 102.0 thou shrs | Operating margin (26/3 act) | 7.4 % |
| Market Cap | ¥40.12 bn | Beta (5Y Monthly) | 0.33 |
| Enterprise Value | ¥25.74 bn | Shares Outstanding | 28.296 mn shrs |
| PER (27/3 CE) | 15.0 X | Listed market | TSE Prime Market |
| PBR (26/3 act) | 1.6 X |
| Click here for the PDF version of this page |
| PDF version |
A comprehensive entertainment company that turns IP, photo stickers, and “kawaii” into corporate value.
Investment View
We believe FURYU is at a stage where investors should consider increasing exposure in a medium- to long-term equity portfolio. The Company is evolving from a photo sticker machine company into a comprehensive entertainment company that combines IP commercialization capabilities, customer touchpoints for young women through photo stickers, PiCTLINK membership monetization, overseas product sales, high-end hobby goods, anime, and games. The current share price of 1,378 yen implies a forecast PER of 14.6x based on the Company’s forecast EPS of 94.4 yen and a PBR of 1.54x based on actual BPS of 892.1 yen. Based only on the headline PER, it is difficult to say that the shares are extremely undervalued. However, after deducting net cash of approximately 13.4 billion yen at the end of FY3/2026, the net-cash-adjusted PER falls to approximately 9.2x. If progress is confirmed toward net sales of 60.0 billion yen, operating profit of 6.0 billion yen, and ROE of 15.0% or higher in FY3/2028, we believe there is significant room to reassess corporate value.
What matters in looking at FURYU is not only the profit recovery from FY3/2026 to FY3/2027, but also the shift in the quality of the business portfolio. The SEKAIKAN Business connects IP commercialization capabilities to growth. The GIRLS Trend Business converts customer touchpoints in photo stickers and PiCTLINK into strong earnings power. The FURYU New Business secures future IP supply and production capabilities. Rather than evaluating the shares solely on short-term profit growth, we would like to evaluate the process through which these businesses connect and lift margins and capital efficiency.
The first point supporting the investment view is growth in the SEKAIKAN Business. In FY3/2026, this business recorded net sales of 27.706 billion yen and operating profit of 2.337 billion yen, becoming the Company’s core business with 61.9% of consolidated net sales. Arcade prizes generated net sales of 19.624 billion yen, accounting for 43.8% of consolidated net sales of 44.767 billion yen and 70.8% of net sales in the SEKAIKAN Business, making them the largest product category. Therefore, to assess the Company’s net sales growth, investors should first monitor market growth in arcade prizes, IP adoption capabilities, the number of products launched, and order trends. Meanwhile, to assess the quality of profit growth, we would also like to confirm growth in overseas product sales and high-end hobby goods, the product mix, inventories, foreign exchange, and logistics costs.
The second point is the structure that supports GIRLS Trend Business profit and cash flow. In FY3/2026, net sales were 14.388 billion yen and operating profit was 3.589 billion yen, with an operating margin of 24.9%. Although total plays and the number of paid PiCTLINK members have declined, profit has grown through price unification and membership monetization. Investors should not focus on volume growth in the photo sticker market. Instead, the key points are the bottoming out of volume KPIs, maintaining unit prices, the sustainability of membership monetization, and expanding usage motivation through IP-based photo stickers and fan-activity photo stickers. The extent to which unit prices and membership monetization can offset a decline in volume will determine this business’s valuation.
The third point is loss management in the FURYU New Business. This business recorded net sales of 2.672 billion yen and an operating loss of 454 million yen in FY3/2026. At present, its contribution to overall profit is limited. Nonetheless, console games and anime production could grow as future sources of IP supply. Therefore, this business should not be viewed simply as an area to exit. Instead, investors should confirm the acceptable level of losses, the investment period, monetization criteria, and the potential for connection with the SEKAIKAN Business. If losses narrow and concrete results that lead to future IP commercialization become visible, the business will improve the Company’s overall margin and ROE.
| Business | Current role | Key evaluation indicators | Largest issue |
| SEKAIKAN Business | Growth engine | Net sales growth, margins | Profitability of overseas product sales and high-end hobby goods |
| GIRLS Trend Business | Profit and cash generation | Number of plays, members, unit prices | Whether volume decline can be offset by unit price improvement |
| FURYU New Business | Future source of IP supply | Loss amount, title results | Loss reduction and connection with other businesses |
The current share price of 1,378 yen implies a forecast PER of 14.6x based on the Company’s forecast EPS of 94.4 yen, a PBR of 1.54x based on actual BPS of 892.1 yen, and a dividend yield of 2.9% based on a forecast dividend of 40 yen. On a simplified basis, forecast ROE is 10.6%, calculated by dividing the Company’s forecast EPS of 94.4 yen by actual BPS of 892.1 yen for FY3/2026. The Company remains some distance from the ROE target of 15.0% or higher set out in the Medium-term Vision. Conversely, this indicates that room for improvement remains if margins, capital allocation, and loss reduction progress. After deducting net cash of approximately 13.4 billion yen, the PER adjusted for net cash is approximately 9.2x, suggesting that the operating business remains undervalued.
The fair value range considered in this report is 1,350 yen to 2,250 yen, with a midpoint of 1,800 yen, based on a composite of the PBR, DCF, and ROIC methods. Under the PBR method, the current share price is near the lower end of the range. Under the DCF and ROIC methods, upward room is easier to envisage if cash generation and capital efficiency improve. However, conditions must be met to justify the upper end of this range. It is necessary to confirm, on a quarterly basis, the operating margin of the SEKAIKAN Business, volume KPIs in the GIRLS Trend Business, loss reduction in the FURYU New Business, improvements in ROE and ROIC, and cash use.
Therefore, investing in the Company’s shares is not simply a bet on operating profit growth in FY3/2027. It is an investment that confirms whether the SEKAIKAN Business grows, the GIRLS Trend Business maintains high profitability, the FURYU New Business manages losses, and capital efficiency improves through net cash progress. If these three points improve, medium-term targets will become clearer, prompting a reassessment of equity value.
1. Corporate Profile and the Changes Investors Should Focus On
FURYU is an entertainment company that develops photo sticker machines, character merchandise, arcade prizes, overseas product sales, high-end hobby goods, games, anime, and fashion brands. Established in April 2007 through the transfer of all businesses from OMRON Entertainment Co., Ltd., the Company has grown from its beginnings in photo sticker machines. The Company’s philosophy is to create quality entertainment that brings happiness and fulfillment to people, and its current business development has expanded along this philosophy across photo stickers, characters, IP, content, and commercialization.
The first point investors should confirm when looking at the Company is that it is no longer simply a single photo sticker machine manufacturer. In the past, key valuation drivers were the installed base of photo sticker machines, the number of plays, and trends among young female users. Today, however, the SEKAIKAN Business accounts for more than half of net sales, with arcade prizes, overseas product sales, and high-end hobby goods driving growth. Photo stickers remain important and highly profitable, but their position has shifted. They are no longer the sole driver of consolidated net sales, but rather a business that supports profit through customer contact points and membership monetization.
In FY3/2026, consolidated net sales were 44.767 billion yen and operating profit was 3.315 billion yen. By business, the SEKAIKAN Business recorded net sales of 27.706 billion yen and operating profit of 2.337 billion yen. The GIRLS Trend Business recorded net sales of 14.388 billion yen and operating profit of 3.589 billion yen. The FURYU New Business recorded net sales of 2.672 billion yen and an operating loss of 454 million yen. Consolidated operating profit reflects the SEKAIKAN Business and the GIRLS Trend Business generating profit and absorbing losses in the FURYU New Business, along with company-wide costs. Without understanding this structure, it is difficult to grasp the Company’s earnings and share-price valuation correctly.
The Company’s business portfolio has changed significantly over the past decade. Net sales were 24.167 billion yen in FY3/2016, when GIRLS Trend-related businesses centered on photo stickers had a large presence. By contrast, net sales had expanded to 44.767 billion yen in FY3/2026, and the SEKAIKAN Business accounted for 61.9% of net sales. The way the Company’s business should be viewed has shifted from a company centered on photo sticker machines to one that uses its IP commercialization capabilities as a growth axis, while retaining photo stickers and PiCTLINK as highly profitable pillars.
This change is important for the investment view. Growth in the SEKAIKAN Business alone is not enough to fully reassess corporate value. This is because IP profitability, inventory, logistics costs, foreign exchange, regional profitability in overseas product sales, and the hit rate of high-end hobby goods affect margins. The GIRLS Trend Business also has a high operating margin, but if total plays and paid members continue to decline, questions will remain about medium-term earnings sustainability. The FURYU New Business could become a future source of IP supply, but it is currently loss-making. Therefore, the Company needs to be evaluated by separating the three elements of growth, profit, and future investment.
In this report, we evaluate the Company not as a simple collection of three businesses, but as a company in which each business has a different role. The SEKAIKAN Business is growth, the GIRLS Trend Business is profit and cash, and the FURYU New Business is a future source of IP supply. Each section separates facts based on Company materials, our evaluation, concerns, and the indicators to be confirmed next.
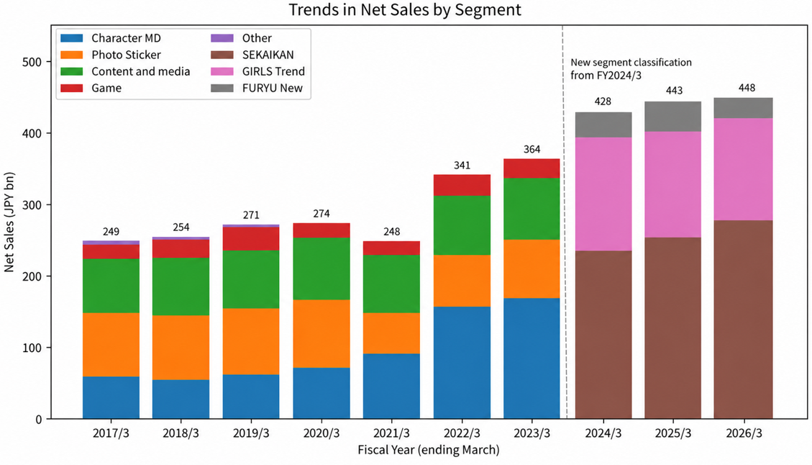
Figure 1. Long-term trend in net sales by business segment (Source: Prepared from FactSet Fundamentals. Segment classification changed from FY3/2024.)
2. Business Structure: Separating Growth, Earnings Power, and Future Investment
| Business | FY3/2026 net sales | FY3/2026 operating profit | Evaluation axis |
| SEKAIKAN Business | 27.706 billion yen | 2.337 billion yen | Net sales growth and operating margin improvement |
| GIRLS Trend Business | 14.388 billion yen | 3.589 billion yen | Bottoming out of volume KPIs and membership monetization |
| FURYU New Business | 2.672 billion yen | – 454 million yen | Loss reduction and role as a source of IP supply |
Source: Calculated by Omega Investment based on FactSet’s standard criteria, rounded to the nearest whole number.
2.1 SEKAIKAN Business: the Main Driver of Net Sales Growth; Margin Improvement Is the Key to Re-rating
The SEKAIKAN Business is the core business that drives the Company’s growth. In FY3/2026, net sales were 27.706 billion yen and operating profit was 2.337 billion yen, accounting for 61.9% of consolidated net sales. Sales were 19.624 billion yen for arcade prizes, 3.620 billion yen for overseas product sales, 2.867 billion yen for high-end hobby goods, and 1.593 billion yen for lottery. The Company explains that Japan’s amusement-facility prize-game market is strong and expanding, and that the CAGR of the Company’s arcade prize sales has substantially exceeded the market growth rate.
Arcade prizes are the largest product category supporting the Company’s net sales scale. Net sales of 19.624 billion yen in FY3/2026 accounted for 43.8% of consolidated net sales of 44.767 billion yen and 70.8% of SEKAIKAN Business net sales of 27.706 billion yen. Therefore, when assessing the Company’s net sales growth, investors first need to confirm market growth in arcade prizes, the adoption of major IPs, the number of products launched, and order trends. Arcade prizes drive net sales growth, while overseas product sales and high-end hobby goods boost the growth rate and margin. This is the structure we would like to emphasize.
The strength of the SEKAIKAN Business lies in planning capabilities that translate IP into products and a manufacturer mindset that covers product development, production, and sales. The Company lists its own strengths as planning capabilities to create “kawaii,” development capabilities to create superior products, PDCA driven by a manufacturer mindset, and IP acquisition and expression capabilities. This is not limited to manufacturing character prizes. It is the ability to understand the worldview of IP, translate it into products that fans want, and expand it into arcade prizes, figures, lottery, and overseas product sales.
On the other hand, the investment evaluation of the SEKAIKAN Business must be based on a more multi-faceted view than net sales growth alone. Arcade prizes have a large sales scale, but they are susceptible to fluctuations in IP demand, inventory, sales promotion, logistics, and foreign exchange. Overseas product sales have significant room for growth, but profitability may differ by region, including North America, China, and Hong Kong. High-end hobby goods tend to improve margins, while product hit rates and production management are also important. Therefore, the most important indicator for this business is operating margin, not net sales growth.
The Company’s FY3/2027 plan assumes net sales of 29.0 billion yen and operating profit of 2.8 billion yen for the SEKAIKAN Business. Compared with FY3/2026 results, the plan assumes a 4.7% increase in net sales and a 19.8% increase in operating profit, implying margin improvement. The Company’s assumptions include rolling out major character merchandise, expanding overseas product sales in North America and China, and maintaining margins on high-end hobby goods. Whether the Company achieves this plan will be directly linked to its operating profit target of 4.0 billion yen and, further, to the FY3/2028 target of 6.0 billion yen.
Three items should be confirmed in the next earnings results. First, whether growth in arcade prize sales is exceeding market growth. Second, whether overseas product sales and high-end hobby goods are contributing to margin improvement. Third, whether demand fluctuations by IP, inventories, logistics costs, and foreign exchange are pressuring operating margin. If the SEKAIKAN Business demonstrates both net sales growth and margin improvement, the Company’s valuation is likely to shift from the past view centered on photo sticker machines to a view of the Company as an IP commercialization company.
2.2 GIRLS Trend Business: Can Volume Decline Be Offset by Unit Prices and Membership Monetization?
The GIRLS Trend Business is highly profitable and supports the Company’s profit and cash flow. In FY3/2026, net sales were 14.388 billion yen and operating profit was 3.589 billion yen, for an operating margin of 24.9%. This exceeded the SEKAIKAN Business’s operating profit of 2.337 billion yen, making its contribution to consolidated profit significant. Sales were 6.116 billion yen for amusement arcades, 1.160 billion yen for directly managed shops, and 6.822 billion yen for PiCTLINK. Total plays were 27.87 million, and paid PiCTLINK members numbered 1.27 million.
This business is difficult to evaluate because volume KPIs and profit do not necessarily move in the same direction. Total plays and paid PiCTLINK members declined, but operating profit increased through price unification and the shift to premium membership. The Company says progress on price unification was about 98%. This indicates that the photo sticker business is shifting from a volume-dependent model to one monetized through customer touchpoints, unit prices, and membership.
However, the decline in volume KPIs cannot be dismissed. Photo stickers have been a business supported by a usage culture centered on junior and senior high school girls. If total plays and paid members continue to decline, the Company will face limits on maintaining profit through unit price improvement alone. The Company’s FY3/2027 plan assumes a total number of plays of 29.00 million and 1.27 million paid members. The Company expects a recovery from FY3/2026 as the bottom, but in the July 2026 monthly data, the cumulative number of plays from April to July was 96.1% of the prior-year level, July alone was 90.9% of the prior-year level, and the number of paid PiCTLINK members was 90.7% of the prior-year level. At this point, the focus is on confirming whether volume KPIs have bottomed out.
The re-rating point for this business lies in new initiatives that broaden the user base and usage motivation. The Company is seeking to acquire working adult users and convert them into repeat users through the 30th anniversary special project for photo stickers, while also acquiring free junior high school members. In addition, through IP-based photo stickers, fan-activity photo stickers, SUKELU factory, and character IP-based photo stickers through the Chinese subsidiary, the Company is trying to expand customer contact points from conventional photo stickers for junior and senior high school girls to university students and older users, fan-activity users, overseas users, and IP fans.
These initiatives also support the SEKAIKAN Business. FURYU has IP commercialization capabilities and, at the same time, customer contact points through the experiential medium of photo stickers. IP-based photo stickers and fan-activity photo stickers convert the worldview of characters and idols into experiential value; they are not merely measures to extend the life of photo sticker machines. If the Company can motivate customers to express affection for IP by taking photos, sharing them, and saving them, this may also drive PiCTLINK membership monetization and related merchandise sales.
That said, these new initiatives should not be overly incorporated at this stage. Investors should first confirm total plays, paid members, member unit prices, churn rates, and usage of IP-based photo stickers. If both the bottoming out of volume KPIs and unit price improvement can be confirmed, the GIRLS Trend Business can be evaluated not as a mature business, but as a business that maintains high margins while expanding customer contact points. Conversely, if volume decline continues and unit price improvement can no longer offset it, a cautious view is warranted on this business’s high profitability.
2.3 FURYU New Business: Conditions for Evaluating It as a Future Source of IP Supply
The FURYU New Business consists of console games, anime, fashion brands, and other businesses. In FY3/2026, net sales were 2.672 billion yen, and the operating loss was 454 million yen. Console game software generated net sales of 1.267 billion yen, anime generated 953 million yen, and other businesses generated 452 million yen. One-time losses also arose, including amortization expenses in games and an allowance for doubtful accounts in anime. The Company’s FY3/2027 plan assumes net sales of 3.0 billion yen and an operating loss of 200 million yen, with loss reduction as the premise.
At present, investors are likely to view this business harshly. This is because, while the SEKAIKAN Business and the GIRLS Trend Business are profitable, losses in the FURYU New Business depress the Company’s consolidated operating margin and ROE. In particular, the Company holds substantial net cash and has set a goal of improving capital efficiency. If the Company continues to invest in a loss-making business, it must clarify the investment period, monetization timing, and exit criteria.
On the other hand, it is not necessarily appropriate to view the FURYU New Business simply as loss-making. Anime production capabilities and game development and sales can become future sources of IP supply and points of connection with the SEKAIKAN Business. The Company explains that LAID-BACK CAMP SEASON 4 is scheduled to air in 2027 and that production will be handled by its in-house studio, FURYU Pictures Corporation. If the Company establishes a structure that lets it control the process from production through commercialization, it could create a vertically integrated earnings model spanning anime, games, character merchandise, high-end hobby goods, lottery, and overseas product sales.
When evaluating this business, we would emphasize loss management and connection value rather than net sales growth. Games and anime can differ greatly by title, making them difficult to evaluate based on short-term net sales alone. What matters is investment by title, amortization burden, monetization period, spillover to other businesses, and the accumulation of IP ownership and production capabilities. For Olu., it is also necessary to look not only at brand awareness and social media indicators, but also at inventory turnover, gross margin, repeat customers, and the criteria for continuing or exiting the business.
Therefore, the investment evaluation of the FURYU New Business should be conducted in two stages. In the first stage, investors should confirm whether losses narrow in line with the Company’s plan. If the operating loss improves to 200 million yen in FY3/2027, the burden on consolidated profit will lighten. In the second stage, investors should confirm how anime production capabilities and game titles connect to the SEKAIKAN Business. If in-house production or IP in which the Company is involved leads to commercialization, product sales, figures, and lottery, the business can be evaluated as a future source of IP supply.
What should be avoided most is prolonged losses. The Company has indicated a policy of selecting and concentrating on new businesses over one to two years. As investors, we would like to confirm the acceptable level of losses, profitability by title, the investment payback timeline, and exit criteria. If the FURYU New Business can reduce losses and make its role as a source of IP supply for the SEKAIKAN Business more concrete, we believe the market’s view of improvement in the Company’s overall margin and ROE will change.
| Product / Service | Sales scale | Profit contribution | Growth potential | Uncertainty |
| Arcade prizes | Large | Medium | High | IP, inventories |
| Overseas product sales | Medium | Medium to high | High | Foreign exchange, region |
| High-end hobby goods | Medium | High | Medium to high | Product hits |
| Photo stickers | Medium | High | Low to medium | Number of users |
| PiCTLINK | Medium | High | Medium | Member decline |
| Games and anime | Small | Currently negative | High | Titles, costs |
3. FY3/2026 Results and Progress in FY3/2027
In FY3/2026, net sales were 44.767 billion yen, operating profit was 3.315 billion yen, ordinary profit was 3.302 billion yen, and profit attributable to owners of parent was 2.061 billion yen. Operating profit increased 48.1% year on year, indicating progress in profit recovery. By business, the SEKAIKAN Business grew, the GIRLS Trend Business maintained high profitability, and these businesses absorbed the loss in the FURYU New Business. The Company plans net sales of 48.0 billion yen, operating profit of 4.0 billion yen, ordinary profit of 4.0 billion yen, and profit attributable to owners of parent of 2.5 billion yen in FY3/2027.
FY3/2026 results should be evaluated not only by the increase in operating profit. In the SEKAIKAN Business, overseas product sales and high-end hobby goods grew alongside arcade prizes. High-end hobby goods improved margins by focusing on high-gross-margin products. In the GIRLS Trend Business, progress on price unification and PiCTLINK membership monetization enabled profit growth despite declines in plays and members. In the FURYU New Business, losses remained, partly due to one-time losses, but the Company plans to reduce losses in FY3/2027.
In FY3/2027 1Q, net sales were 12.020 billion yen, operating profit was 1.074 billion yen, and the operating margin was 8.9%. Net sales increased 19.0% year on year, while operating profit increased 52.8%. Progress against the full-year plan was 25.0% for net sales and 26.8% for operating profit. The SEKAIKAN Business recorded net sales of 8.161 billion yen and operating profit of 866 million yen. The GIRLS Trend Business recorded net sales of 3.393 billion yen and operating profit of 841 million yen. The FURYU New Business recorded net sales of 464 million yen and an operating loss of 90 million yen. As of 1Q, we assess that the Company has made a smooth start toward its full-year operating profit plan of 4.0 billion yen.
At the same time, monthly data also show points that require attention. Cumulative net sales from April to July 2026 were 16.715 billion yen, 116.0% of the prior-year level. The SEKAIKAN Business recorded 11.209 billion yen, 122.6% of the prior-year level; the GIRLS Trend Business recorded 5.168 billion yen, 106.2% of the prior-year level; and the FURYU New Business recorded 335 million yen, 85.5% of the prior-year level. Net sales were strong for the SEKAIKAN Business, and the GIRLS Trend Business also increased sales. However, total plays from April to July were 8.46 million, 96.1% of the prior-year level; July alone was 2.20 million, 90.9% of the prior-year level; and the number of paid PiCTLINK members was 1.17 million, 90.7% of the prior-year level.
For this reason, in evaluating progress in FY3/2027, it is not sufficient to look only at consolidated net sales and operating profit. The operating profit progress rate in 1Q is favorable, and July monthly net sales were also solid. However, the volume KPIs for the GIRLS Trend Business still require confirmation. It remains to be seen how far they recover toward the Company’s assumptions of 29.00 million total plays and 1.27 million paid members in the second half. If total plays bottom out and membership stabilizes, the sustainability of profit from price unification and membership monetization will be confirmed.
The FY3/2027 plan focuses on the operating margin of the SEKAIKAN Business, KPIs for the GIRLS Trend Business, and loss reduction in the FURYU New Business. Net sales of 48.0 billion yen and operating profit of 4.0 billion yen appear to be on track as of 1Q, but in light of the FY3/2028 operating profit target of 6.0 billion yen, FY3/2027 will not merely be a year of profit growth, but a bridge year toward margin improvement and improved capital efficiency.
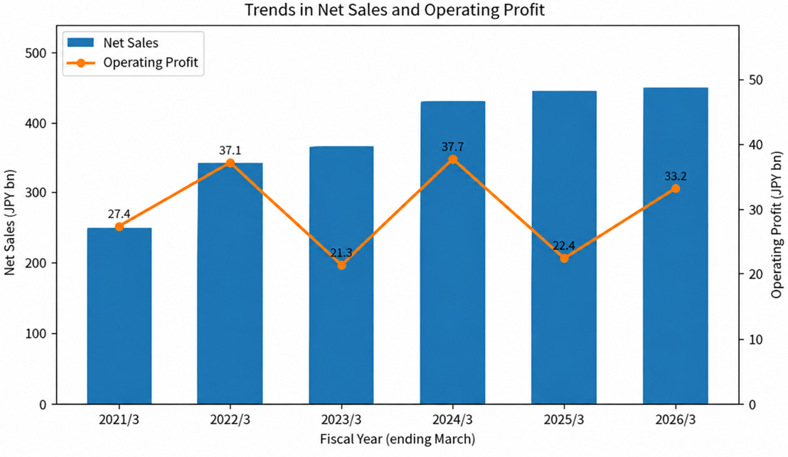
Figure 2. Trend in net sales and operating profit (Source: Prepared from FactSet Fundamentals and Company materials.)
4. Mechanism for Corporate Value Creation
If the Company’s corporate value creation could be summarized in one phrase, it would be its ability to convert IP, photo stickers, and “kawaii” into multiple earnings opportunities. In the SEKAIKAN Business, IP is converted into arcade prizes, overseas product sales, high-end hobby goods, and lottery. In the GIRLS Trend Business, the Company has customer contact points for young women through photo stickers and PiCTLINK. It expands these into photo-taking experiences, image storage, membership monetization, IP-based photo stickers, and fan-activity photo stickers. In the FURYU New Business, the Company creates future sources of IP supply through games and anime production. By connecting these three businesses, the Company can create corporate value without relying on the hit performance of a single product.
The Company lists its strengths as planning capabilities to create “kawaii,” development capabilities to create superior products, PDCA driven by a manufacturer mindset, and IP acquisition and expression capabilities. At the same time, it recognizes marketing, branding, overseas know-how, and limited proprietary IP as weaknesses. This self-assessment is important. With this understanding, the Company is pursuing collaboration with other companies, overseas product sales, IP acquisition, and in-house production capabilities.
The value of the SEKAIKAN Business lies in IP commercialization. Fans’ emotions toward works and characters take shape as prizes, figures, lottery, and product sales. As a manufacturer, the Company plans and develops products and supplies them to amusement facilities and sales channels. The products are not merely goods, but media that express the IP’s worldview. IP selection, modeling, cuteness, quality, sales timing, and price range all relate to value creation.
The value of the GIRLS Trend Business lies in its customer touchpoints. Photo stickers are not merely photo machines; they are experiences through which young women visualize friendships, self-expression, memories, and fan activity. PiCTLINK is a contact point that connects those experiences to digital storage, sharing, and monetization. Even when play counts are difficult to increase, profit can be maintained through unit pricing and membership monetization because these customer touchpoints retain value.
The value of the FURYU New Business lies in its potential as a future source of IP supply. With anime production capabilities, the Company cannot only commercialize external IP but also get involved from the production stage and link that involvement to commercialization, product sales, figures, lottery, and overseas expansion. The same applies to games. The key question is not only whether individual titles succeed, but whether IP and characters can be connected to the SEKAIKAN Business.
For this corporate value-creation mechanism to work, the businesses must be connected. If the SEKAIKAN Business grows only through commercialization of external IP, it will be susceptible to IP acquisition competition and licensing terms. If the GIRLS Trend Business remains standalone, it will be affected by changes in young users’ behavior. If the FURYU New Business continues to generate losses on a standalone basis, it may damage shareholder value. By connecting the three businesses through IP, experiences, commercialization, membership monetization, and production capabilities, the Company can create distinctive corporate value.
Therefore, it is necessary to confirm how the Company’s strategic axes of IP, photo stickers, and kawaii connect not only to net sales and operating profit but also to improvements in ROE and ROIC. If inter-business connections progress, IP acquisition, commercialization, customer contact points, and production capabilities will reinforce each other. Conversely, if each business operates separately and investment discipline in loss-making businesses remains weak, portfolio complexity will lead to a valuation discount.
5. Cash Flow, Net Cash, and Capital Allocation
One of the Company’s investment attractions is its high financial soundness. At the end of FY3/2026, cash and cash equivalents were 13.746 billion yen, and the equity ratio was 77.9%. Operating cash flow was 5.190 billion yen, investing cash flow was negative 2.134 billion yen, financing cash flow was negative 1.041 billion yen, and free cash flow was 3.601 billion yen. Substantial net cash and operating cash flow support the share price and indicate room to consider both growth investment and shareholder return.
However, it is not necessarily appropriate to mechanically deduct all net cash and conclude that the shares are undervalued. The Company needs to invest in expansion of the SEKAIKAN Business, high-end hobby goods, overseas product sales, anime production, games, IP-based photo stickers, M&A, and other areas. Cash is not merely surplus funds, but also funds that support growth investment, inventories, development, production, and overseas expansion. Therefore, PER adjusted for net cash should be used as a supplementary indicator and to confirm capital allocation discipline.
The Company indicates expected cash of 10.0 billion yen to 13.0 billion yen at the end of FY3/2028, operating cash flow of 15.0 billion yen over three years, shareholder return of 3.0 billion yen to 4.0 billion yen, capital expenditures of 6.0 billion yen to 7.0 billion yen, and a strategic investment bucket of 5.0 billion yen to 6.0 billion yen. The strategic investment bucket includes M&A, minority investments, share repurchases, and joint venture establishment. The Company’s M&A policy targets areas around the SEKAIKAN Business and emphasizes business synergies.
This capital allocation policy can be evaluated positively in terms of direction. It seeks to balance growth investment and shareholder return while maintaining financial soundness. On the other hand, investors will focus on how the strategic investment bucket is used. Unless investors can see where the Company will invest, the expected ROIC, the payback period, whether exit criteria exist, and the KPIs by which post-M&A synergies will be confirmed, it will be difficult to judge whether substantial cash will improve capital efficiency.
On shareholder return, the Company uses a DOE of 5% or a payout ratio of 40% as a reference and has set out a progressive dividend policy. The forecast dividend for FY3/2027 is 40 yen, and the dividend yield based on the current share price of 1,378 yen is 2.9%. The dividend yield has some investment appeal, but achieving ROE of 15.0% or higher will require comprehensive capital allocation that includes not only dividends but also growth investment and share repurchases.
From a capital-markets dialogue perspective, the Company’s shares raise questions about capital efficiency and capital allocation. The Company has substantial net cash, ample operating cash flow, and a PBR in the 1.5x range. Meanwhile, although the Company targets ROE of 15.0% or higher, current ROE is around 10%. The loss in the FURYU New Business, the use of the strategic investment bucket, and the pace of shareholder returns are likely to become points that investors want to confirm. The Company has already indicated its ROE target, progressive dividends, strategic investment bucket, and M&A policy. Going forward, the focus will be on the time frame over which these policies will be linked to enhancing corporate value.
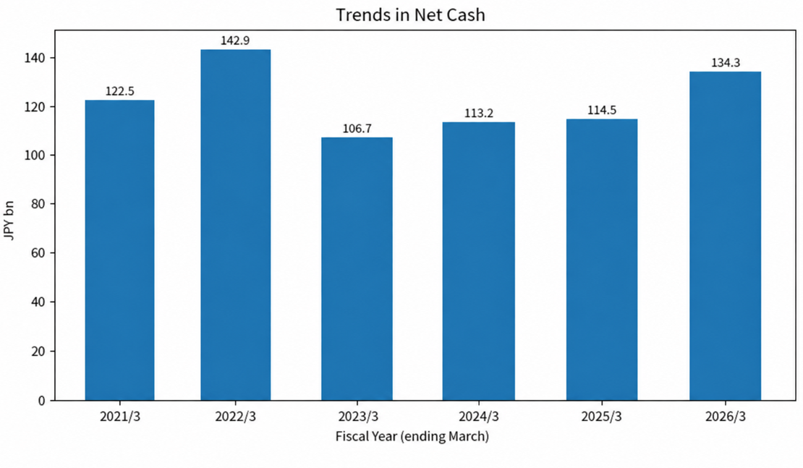
Figure 3. Trend in net cash (Source: Prepared from FactSet Fundamentals and Company materials.)
6. Share-price Valuation and Fair Value
We would like to consolidate the share-price valuation in one place. The current share price of 1,378 yen implies a forecast PER of 14.6x based on the Company’s forecast EPS of 94.4, a PBR of 1.54x based on actual BPS of 892.1, and a dividend yield of 2.9% based on a forecast dividend of 40. Based only on the headline PER, it is difficult to say the shares are extremely undervalued. However, after deducting net cash of approximately 13.4 billion yen at the end of FY3/2026, the net-cash-adjusted PER falls to approximately 9.2x. For a company with substantial cash, the operating-business valuation looks low.
We estimate fair value at 1,350 yen to 2,250 yen, with a midpoint of 1,800 yen, based on a composite of the PBR, DCF, and ROIC methods. Under the PBR method, applying a PBR of 1.5x to 2.2x to the actual BPS of 892 yen gives a reference range of 1,340 yen to 1,960 yen. A PBR of 1.5x is the lower end based on current ROE of around 10% and financial soundness, while a PBR of 2.2x is the upper end if progress toward an ROE of 15.0% or higher is confirmed. The current share price is near the lower end of this range.
Under the DCF method, using normalized free cash flow of 2.0 billion yen to 2.6 billion yen as the base and accounting for growth rates, discount rates, and net cash, we get a reference range of 1,600 yen to 2,300 yen. Free cash flow in FY3/2026 was 3.601 billion yen, but because it fluctuates by fiscal year due to working capital, investment, inventories, and production costs, the normalized level should be viewed conservatively. Under the DCF method, the Company’s cash generation capacity and net cash support the valuation.
Under the ROIC method, we evaluate the level of profitability generated by enterprise value relative to invested capital and use a reference range of 1,500 yen to 2,250 yen. If the SEKAIKAN Business improves margins, the GIRLS Trend Business maintains high profitability, and the FURYU New Business reduces losses, the valuation multiple is likely to rise as ROIC improves. Conversely, if the strategic investment bucket is used for low-return investments and improvement in the loss-making business is delayed, it will be difficult to justify the upper end under the ROIC method.
The conclusion differs somewhat by valuation method. Under the PBR method, the current share price is near the lower end and reflects financial soundness. Under the DCF method, there is relatively easy room to see upside because cash generation is evaluated. Under the ROIC method, the valuation approaches the upper end if capital efficiency improves. Overall, we believe the current share price has greater medium-term upside than downside. However, the conditions for that are clear.
Four conditions justify the upper end of the fair value range. First, the SEKAIKAN Business’s operating margin must improve. Second, the total number of plays and the number of paid members in the GIRLS Trend Business must bottom out, and profit must be maintained through unit prices and membership monetization. Third, losses in the FURYU New Business must narrow in line with the Company plan, and its meaning as a future source of IP supply must become visible. Fourth, net cash and the strategic investment bucket must be used in ways that improve ROE and ROIC.
Conversely, the current share price may also be unlikely to move toward the upper end of the fair value range. These include a case in which volume KPIs in the GIRLS Trend Business continue to deteriorate and the benefits of price unification run their course, a case in which net sales growth in the SEKAIKAN Business does not translate into profit because of inventories, foreign exchange, or logistics costs, a case in which losses in the FURYU New Business become prolonged, and a case in which the results of strategic investment do not become visible. Therefore, share-price valuation should be judged not merely by comparing multiples, but by combining business KPIs and capital allocation.
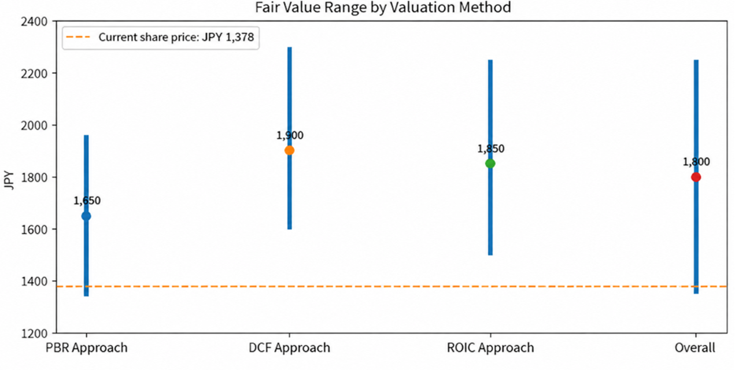
Figure 4. Concept for fair value range (Source: Our estimates.)
7. Shareholder Composition, Share-price Trend, and Room for Capital-market Dialogue
According to FactSet data, the Company’s shareholder composition has a high ownership ratio among internal stakeholders, while the institutional investor ratio is relatively limited. Total shareholder ownership is 58.60%, with institutional investors holding 12.21% and internal stakeholders holding 46.34%. The free float ratio is 53.7%, and institutional investors account for 22.8% of the free float, indicating room for further institutional investor involvement. Major shareholders include founder-family and officer-related holders, treasury shares, the employee shareholding association, Hikari Tsushin, Sumitomo Mitsui DS Asset Management, Nomura Asset Management, and GENDA.
The key point in assessing shareholder composition is that the Company is not simply a highly liquid large-cap stock. Because internal stakeholders hold a substantial stake and treasury shares exist, supply and demand in the share market are likely to form within a limited free float. This may increase short-term share-price volatility, while over the medium to long term, if institutional investors evaluate the Company’s transformation, it could support supply and demand.
To assess the share-price trend, it is necessary to separate what the Company’s market valuation already incorporates. We believe the current share price reflects some operating profit growth in FY3/2027, but does not fully reflect the medium-term targets of operating profit of 6.0 billion yen and ROE of 15.0% or higher in FY3/2028. The headline PER of 14.6x is not extremely low, but the PER adjusted for net cash of 9.2x suggests the market is valuing the Company’s business at a relatively low level.
Dialogue with the capital markets is likely to center on net cash, ROE, strategic investment, loss-making businesses, and shareholder returns. Substantial net cash improves financial soundness, but from a capital-efficiency perspective, it also depresses ROE. Because the Company has set a target ROE of 15.0% or higher, investors will want to confirm how it will allocate cash to growth investment, M&A, shareholder returns, and share repurchases.
If investors evaluate the Company through a capital-efficiency lens, simply demanding cash returns will not be sufficient. The Company needs growth investment, and there is room to invest in IP commercialization, overseas product sales, high-end hobby goods, anime production, IP-based photo stickers, and M&A. What matters is not whether cash is used, but clarifying which investments will increase shareholder value. If the Company shows expected ROIC, payback periods, exit criteria, and post-investment KPIs for the 5.0 billion yen to 6.0 billion yen strategic investment bucket, dialogue with the capital markets will become more constructive.
Therefore, a re-rating of the Company’s shares will require not only earnings progress but also the quality of dialogue with investors. The Company has already indicated medium-term targets, an ROE target, progressive dividends, a strategic investment bucket, and an M&A policy. Going forward, it is at the stage of disclosing the execution time frame and the indicators by which progress can be confirmed. If the market can understand both the change in the business portfolio and capital allocation discipline, the valuation of the Company’s shares may change.
8. Risks and Monitoring Items
Risks in the Company’s shares differ by business. The most important risk is that volume KPIs in the GIRLS Trend Business do not bottom out. Profit has improved through price unification and PiCTLINK membership monetization, but if total plays and paid members continue to decline, it will be difficult to maintain profit through unit price improvement alone. The Company’s FY3/2027 plan assumes 29.00 million total plays and 1.27 million paid members, and these need to be monitored monthly and quarterly.
The next important item is the operating margin of the SEKAIKAN Business. This business is the main driver of net sales growth, but its margin fluctuates depending on IP profitability, inventory, logistics costs, foreign exchange, regional profitability in overseas product sales, and the product hit rate of high-end hobby goods. Even if net sales grow, the Company’s medium-term target of operating profit of 6.0 billion yen will not become visible unless operating margin improves. Therefore, it is necessary to look not only at the net sales growth rate, but also at the operating margin and product mix.
The third item is loss reduction in the FURYU New Business. This business could become a future source of IP supply, but prolonged losses will depress the Company’s consolidated operating margin and ROE. The Company plans to improve the operating loss to 200 million yen in FY3/2027. As investors, we would like to confirm profitability by title, amortization burden, the possibility of recurrence of one-time losses, profitability of anime production, and inventory turnover and gross margin at Olu.
The fourth item is progress toward the 4.0 billion yen operating profit plan, ROE and ROIC, and the investment results from cash. As of 1Q, the operating profit progress rate was 26.8%, which appears smooth, but seasonality, product launch timing, sales promotion, foreign exchange, and production costs will affect the full-year result. ROE was 8.9% in FY3/2026, and 10.6% on a simplified basis using the Company’s forecast EPS and actual BPS, which remains some distance from the medium-term target of 15.0% or higher. ROIC will also be affected by inventories and investment in the SEKAIKAN Business, losses in the FURYU New Business, and M&A results.
Medium- to long-term themes include IP-based photo stickers and fan-activity photo stickers, anime production capabilities, and M&A and minority investments. Even if their short-term contribution to earnings is limited, these themes could strengthen connections between businesses. IP-based photo stickers connect IP commercialization capabilities in the SEKAIKAN Business with customer contact points in the GIRLS Trend Business. Anime production capabilities can serve as an IP supply source from the FURYU New Business to the SEKAIKAN Business. M&A and minority investments may complement overseas know-how and IP acquisition capabilities.
The priority order of monitoring items is as follows. First, the bottoming out of total plays and paid members in the GIRLS Trend Business. Second, the operating margin of the SEKAIKAN Business. Third, loss reduction in the FURYU New Business. Next, investors should confirm progress toward the 4.0 billion yen operating profit plan, ROE and ROIC, and the investment results from cash. Monitor IP-based photo stickers, anime production, and M&A as medium- to long-term themes. Do not give all items the same weight; separate items directly linked to the short-term investment view from items related to medium- to long-term corporate value.
9. Investment Stance
We maintain our view that exposure should be increased from a medium- to long-term perspective. The reason is that the Company is evolving from a company centered on photo sticker machines into a comprehensive entertainment company that combines IP commercialization capabilities, customer contact points through photo stickers, PiCTLINK membership monetization, overseas product sales, high-end hobby goods, anime, and games. We believe the equity market has not yet fully evaluated this change.
The core investment stance is to hold the shares while confirming growth and margin improvement in the SEKAIKAN Business, maintaining high profitability in the GIRLS Trend Business, reducing losses in the FURYU New Business, and improving capital efficiency through net cash. The current share price is near the lower end under the PBR method, while the DCF and ROIC methods suggest upside. However, that upside is conditional. Unless business KPIs and capital allocation progress accompany it, the share-price valuation is unlikely to change significantly from current levels.
Three conditions would make the investment view more positive. First, the operating margin of the SEKAIKAN Business must improve, and net sales growth must lead to profit growth. Second, the total number of plays and paid members in the GIRLS Trend Business must bottom out, and the effects of price unification and membership monetization must be sustained. Third, losses in the FURYU New Business must narrow, and its role as an anime production capability and source of IP supply must become visible. If these are confirmed, operating profit of 6.0 billion yen and ROE of 15.0% or higher in FY3/2028 will become more visible.
Conversely, there are also conditions under which the investment view should be reviewed. These include a case in which volume KPIs in the GIRLS Trend Business deteriorate significantly and cannot be offset by unit price improvement; a case in which net sales growth in the SEKAIKAN Business does not lead to margin improvement; a case in which losses in the FURYU New Business become prolonged; and a case in which the use of the strategic investment bucket does not lead to improvement in ROE and ROIC. In particular, because the Company has substantial net cash, failure in capital allocation can easily lead to a valuation discount.
The Company’s shares are a medium- to long-term investment target that evaluates changes in the business portfolio, not merely short-term earnings momentum. Over one to two years, achieving the FY3/2027 operating profit plan of 4.0 billion yen, volume KPIs in the GIRLS Trend Business, loss reduction in the FURYU New Business, and disclosure of capital allocation will become share-price factors. Over three to four years, the focus will be on achieving operating profit of 6.0 billion yen and ROE of 15.0% or higher in FY3/2028, the link between IP commercialization and production capabilities, and the profitability of overseas product sales and high-end hobby goods.
In conclusion, we believe the current share price of 1,378 does not fully reflect the change in the Company’s business structure and its net cash. Fair value is 1,350 yen to 2,250 yen, with a midpoint of 1,800 yen, and the current share price has greater medium-term upside than downside. However, rather than viewing the shares simply as undervalued, we would like to regard them as shares whose valuation should be raised, subject to confirming four points: the SEKAIKAN Business, the GIRLS Trend Business, the FURYU New Business, and capital allocation.
10. View on Management and Governance
When assessing the Company’s management and governance, we would like to confirm both the depth of business understanding and the ability to explain the business to the capital markets. FURYU’s business spans multiple domains: photo stickers, IP commercialization, figures, overseas product sales, games, and anime production. Each domain involves consumer sensibilities, IP negotiations, product development, production management, inventory, sales channels, and a digital membership base, making it difficult for outsiders to understand quickly. Therefore, management needs to explain capital efficiency and the business portfolio to investors while retaining a practical feel for existing businesses.
Company materials indicate that independent external directors make up at least one-third of the Board of Directors and that there are multiple female directors. This can be evaluated positively in formal terms. On the other hand, investors will focus on how effectively the Board oversees losses in the FURYU New Business, the strategic investment bucket, M&A, share repurchases, shareholder returns, and the ROE target of 15.0% or higher. The Company has entered a phase in which not only formal independence, but also effectiveness in capital allocation, will be tested.
In its Medium-term Vision, the Company sets out the goal of becoming a comprehensive entertainment company that brings smiles to people around the world. This direction itself is consistent with the Company’s business assets. The issue is how much capital the Company will invest in each business during implementation, how much profit it will recover from each business, and at what stage it will decide to exit or scale down. In particular, expanding the SEKAIKAN Business requires inventory and product development investment, while the FURYU New Business requires production and development expenses. If capital allocation discipline is weak, net sales growth may not translate into ROE improvement.
We expect management to enhance the Company’s corporate value by combining IP commercialization capabilities, customer touchpoints in photo stickers, anime production capabilities, and overseas expansion. Therefore, investors should not debate whether to prioritize growth investment or capital efficiency, but rather how growth investment will translate into higher ROE and ROIC. In earnings briefings from the next period onward, the Company should provide more specific explanations of how it uses the strategic investment bucket, post-investment KPIs, management criteria for loss-making businesses, and its thinking on share repurchases.
11. Appendix: Financial Data
The following are the key financial data used in this report’s analysis. The body of the report prioritizes the flow of the investment view, while detailed data are consolidated below. Figures are based mainly on FactSet Fundamentals, Company materials, and our estimates.
| Item | FY3/2024 | FY3/2025 | FY3/2026 | FY3/2027 Company plan |
| Net sales | 42.769 billion yen | 44.306 billion yen | 44.767 billion yen | 48.000 billion yen |
| Operating profit | 3.769 billion yen | 2.236 billion yen | 3.315 billion yen | 4.000 billion yen |
| Profit attributable to owners of parent | 2.491 billion yen | 1.627 billion yen | 2.061 billion yen | 2.500 billion yen |
| EPS | 94.2 yen | 61.5 yen | 77.8 yen | 94.4 yen |
| BPS | 826.9 yen | 846.9 yen | 892.1 yen | – |
| ROE | 11.86% | 7.35% | 8.95% | 10.6% (simplified) |
| Dividend | 39 yen | 39 yen | 40 yen | 40 yen |
Note: FY3/2027 ROE is calculated on a simplified basis by dividing the Company’s forecast EPS of 94.4 yen by actual BPS of 892.1 yen for FY3/2026, and differs from strict ROE.
Notes
The share-price-related indicators used in this report are a share price of 1,378 yen, forecast EPS of 94.4 yen, actual BPS of 892.1 yen, forecast ROE of 10.6%, and a forecast dividend of 40 yen. The share price is the value shown in FactSet materials as of August 11, 2026. Forecast EPS and the forecast dividend are Company forecasts, and actual BPS is based on FY3/2026 results.
As a rule, financial data refer primarily to FactSet standardized data. Therefore, net sales, operating profit, ordinary profit, profit, cash flow, balance sheet items, segment-related figures, and other items may differ in part from presentation items, reclassifications, rounding, and segment disclosures in Company materials. For net sales by business, operating profit, KPIs, the Medium-term Vision, and capital allocation policy, we first confirmed Company materials. We supplemented them as needed with FactSet data and our estimates.
Fair value, the PER adjusted for net cash, and valuation amounts based on the DCF method and ROIC method are our estimates based on certain assumptions. They are not intended to constitute an investment recommendation or to guarantee future share prices or the realization of corporate value. They may change depending on assumptions, earnings progress, market conditions, interest rates, the cost of capital, and changes in shareholder return policy.
Key financial data
| Unit: million yen | 2022/3 | 2023/3 | 2024/3 | 2025/3 | 2026/3 | 2027/3 CF |
| Sales | 34,058 | 36,401 | 42,769 | 44,306 | 44,767 | 48,000 |
| EBIT | 3,710 | 2,135 | 3,769 | 2,236 | 3,315 | 4,000 |
| Pretax Income | 3,688 | 2,168 | 3,709 | 2,266 | 3,179 | |
| Net Profit Attributable to Owner of Parent | 2,545 | 1,444 | 2,491 | 1,627 | 2,061 | 2,500 |
| Cash & Short-Term Investments | 14,662 | 10,800 | 11,489 | 11,733 | 13,753 | |
| Total assets | 28,199 | 25,963 | 28,412 | 28,148 | 30,336 | |
| Total Debt | 372 | 128 | 173 | 280 | 321 | |
| Net Debt | -14,290 | -10,673 | -11,316 | -11,453 | -13,432 | |
| Total liabilities | 6,948 | 5,810 | 6,550 | 5,724 | 6,708 | |
| Total Shareholders’ Equity | 21,251 | 20,153 | 21,863 | 22,424 | 23,628 | |
| Net Operating Cash Flow | 5,692 | 904 | 3,942 | 3,856 | 5,190 | |
| Capital Expenditure | 2,274 | 2,277 | 2,166 | 2,706 | 2,229 | |
| Net Investing Cash Flow | -2,275 | -2,335 | -2,252 | -2,603 | -2,134 | |
| Net Financing Cash Flow | -1,014 | -2,441 | -1,009 | -1,037 | -1,041 | |
| Free Cash Flow | 3,882 | -896 | 2,302 | 1,783 | 3,601 | |
| ROA (%) | 9.74 | 5.33 | 9.16 | 5.75 | 7.05 | |
| ROE (%) | 12.41 | 6.97 | 11.86 | 7.35 | 8.95 | |
| EPS (Yen) | 93.0 | 53.6 | 94.2 | 61.5 | 77.8 | 94.4 |
| BPS (Yen) | 776.7 | 762.2 | 826.9 | 846.9 | 892.1 | |
| Dividend per Share (Yen) | 52.00 | 38.00 | 39.00 | 39.00 | 40.00 | 40.00 |
| Shares Outstanding (Million shares) | 28.30 | 28.30 | 28.30 | 28.30 | 28.30 |
Source: Calculated by Omega Investment based on FactSet’s standard criteria, rounded to the nearest whole number.
Share price
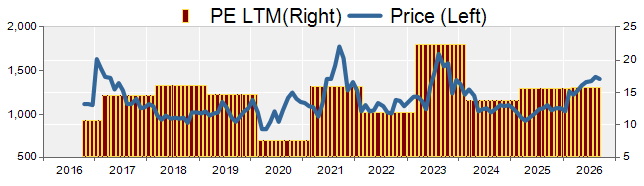
Key stock price data
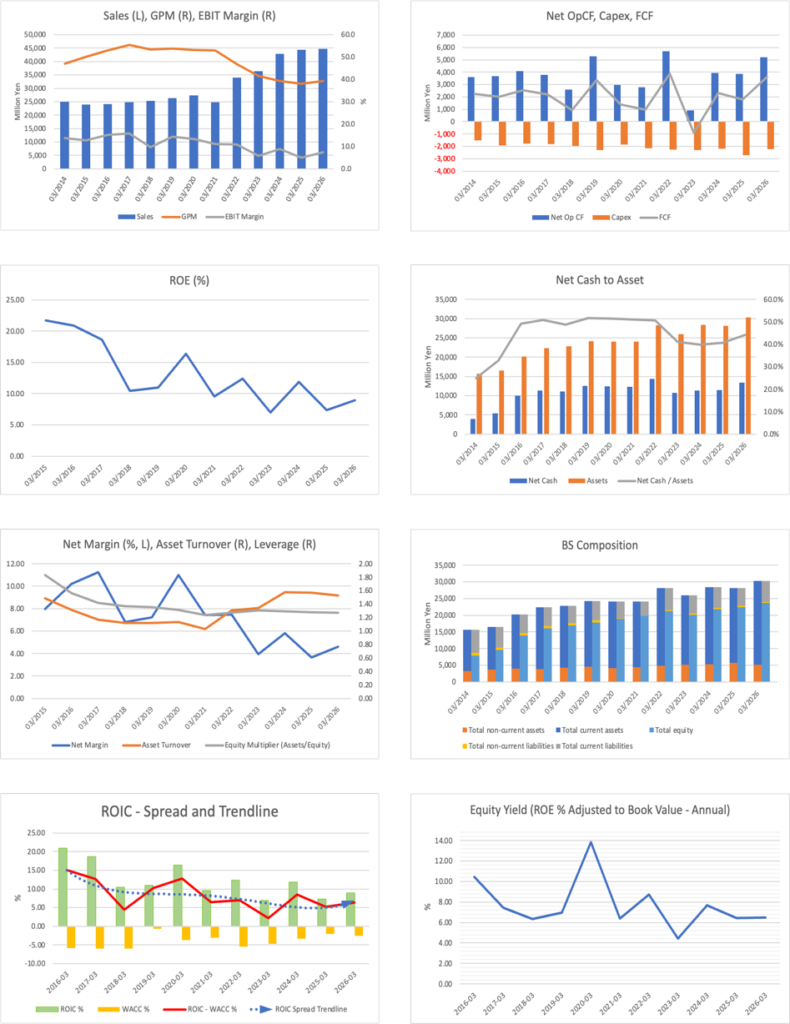
Financial data (quarterly basis)
| Unit: million yen | 2025/3 | 2026/3 | 2027/3 | ||||||
| 1Q | 2Q | 3Q | 4Q | 1Q | 2Q | 3Q | 4Q | 1Q | |
| (Income Statement) | |||||||||
| Sales | 10,046 | 11,529 | 12,099 | 10,631 | 10,105 | 11,378 | 11,173 | 12,112 | 12,020 |
| Year-on-year | 0.7% | 3.8% | 5.5% | 4.0% | 0.6% | -1.3% | -7.7% | 13.9% | 19.0% |
| Cost of Goods Sold (COGS) | 5,879 | 7,146 | 7,578 | 6,811 | 6,245 | 6,792 | 6,465 | 7,653 | 7,376 |
| Gross Income | 4,167 | 4,383 | 4,521 | 3,821 | 3,860 | 4,586 | 4,707 | 4,460 | 4,644 |
| Gross Income Margin | 41.5% | 38.0% | 37.4% | 35.9% | 38.2% | 40.3% | 42.1% | 36.8% | 38.6% |
| SG&A Expense | 3,518 | 3,726 | 3,773 | 3,635 | 3,157 | 3,493 | 3,591 | 4,056 | 3,570 |
| EBIT | 649 | 657 | 748 | 185 | 703 | 1,094 | 1,116 | 402 | 1,074 |
| Year-on-year | -50.7% | -41.0% | -31.1% | -28.0% | 8.3% | 66.5% | 49.2% | 116.8% | 52.8% |
| Operating Income Margin | 6.5% | 5.7% | 6.2% | 1.7% | 7.0% | 9.6% | 10.0% | 3.3% | 8.9% |
| EBITDA | 1,128 | 1,263 | 1,415 | 732 | 1,189 | 1,641 | 1,658 | 1,137 | 1,515 |
| Pretax Income | 652 | 700 | 749 | 165 | 704 | 998 | 1,091 | 387 | 1,069 |
| Consolidated Net Income | 436 | 464 | 506 | 222 | 463 | 663 | 747 | 188 | 681 |
| Minority Interest | 0 | 0 | 0 | 0 | 0 | 0 | 0 | 0 | 0 |
| Net Income ATOP | 436 | 464 | 506 | 222 | 463 | 663 | 747 | 188 | 681 |
| Year-on-year | -48.1% | -37.6% | -34.1% | 58.3% | 6.2% | 43.0% | 47.5% | -15.1% | 47.2% |
| Net Income Margin | 4.3% | 4.0% | 4.2% | 2.1% | 4.6% | 5.8% | 6.7% | 1.6% | 5.7% |
| (Balance Sheet) | |||||||||
| Cash & Short-Term Investments | 9,307 | 11,312 | 10,815 | 11,733 | 10,370 | 11,338 | 11,228 | 13,753 | 11,441 |
| Total assets | 26,812 | 27,265 | 28,114 | 28,148 | 27,198 | 27,649 | 28,325 | 30,336 | 28,682 |
| Total Debt | 7 | 7 | 7 | 280 | 10 | 10 | 9 | 321 | 33 |
| Net Debt | -9,300 | -11,305 | -10,808 | -11,453 | -10,359 | -11,328 | -11,218 | -13,432 | -11,408 |
| Total liabilities | 5,455 | 5,775 | 5,754 | 5,724 | 5,397 | 5,107 | 4,930 | 6,708 | 5,436 |
| Total Sharehjolders’ Equity | 21,358 | 21,490 | 22,360 | 22,424 | 21,800 | 22,542 | 23,394 | 23,628 | 23,247 |
| (Profitability %) | |||||||||
| ROA | 7.96 | 6.53 | 5.50 | 5.75 | 6.13 | 6.75 | 7.42 | 7.05 | 8.16 |
| ROE | 10.06 | 8.53 | 7.04 | 7.35 | 7.67 | 8.42 | 9.15 | 8.95 | 10.12 |
| (Per-share) Unit: JPY | |||||||||
| EPS | 16.5 | 17.5 | 19.1 | 8.4 | 17.5 | 25.0 | 28.2 | 7.1 | 25.7 |
| BPS | 807.8 | 811.6 | 844.5 | 846.9 | 823.3 | 851.1 | 883.2 | 892.1 | 877.7 |
| Dividend per Share | 0.00 | 0.00 | 0.00 | 39.00 | 0.00 | 0.00 | 0.00 | 40.00 | 0.00 |
| Shares Outstanding (million shares) | 28.30 | 28.30 | 28.30 | 28.30 | 28.30 | 28.30 | 28.30 | 28.30 | 28.30 |
Source: Calculated by Omega Investment based on FactSet’s standard criteria, rounded to the nearest whole number.
Financial data (full-year basis)
| Unit: million yen | 2017/3 | 2018/3 | 2019/3 | 2020/3 | 2021/3 | 2022/3 | 2023/3 | 2024/3 | 2025/3 | 2026/3 |
| (Income Statement) | ||||||||||
| Sales | 24,891 | 25,383 | 26,406 | 27,432 | 24,777 | 34,058 | 36,401 | 42,769 | 44,306 | 44,767 |
| Year-on-year | 3.0% | 2.0% | 4.0% | 3.9% | -9.7% | 37.5% | 6.9% | 17.5% | 3.6% | 1.0% |
| Cost of Goods Sold | 11,122 | 11,859 | 12,213 | 12,868 | 11,682 | 18,093 | 21,266 | 25,969 | 27,414 | 27,155 |
| Gross Income | 13,769 | 13,525 | 14,193 | 14,563 | 13,096 | 15,965 | 15,135 | 16,800 | 16,892 | 17,613 |
| Gross Income Margin | 55.3% | 53.3% | 53.8% | 53.1% | 52.9% | 46.9% | 41.6% | 39.3% | 38.1% | 39.3% |
| SG&A Expense | 9,848 | 11,071 | 10,407 | 10,925 | 10,360 | 12,255 | 13,000 | 13,029 | 14,653 | 14,297 |
| EBIT | 3,921 | 2,453 | 3,786 | 3,638 | 2,736 | 3,710 | 2,135 | 3,769 | 2,236 | 3,315 |
| Year-on-year | 6.9% | -37.4% | 54.3% | -3.9% | -24.8% | 35.6% | -42.5% | 76.6% | -40.7% | 48.2% |
| Operating Income Margin | 15.8% | 9.7% | 14.3% | 13.3% | 11.0% | 10.9% | 5.9% | 8.8% | 5.0% | 7.4% |
| EBITDA | 5,542 | 4,331 | 3,903 | 5,245 | 4,387 | 5,804 | 4,221 | 5,794 | 4,534 | 5,625 |
| Pretax Income | 3,901 | 2,467 | 2,907 | 3,756 | 2,671 | 3,688 | 2,168 | 3,709 | 2,266 | 3,179 |
| Consolidated Net Income | 2,798 | 1,726 | 1,901 | 3,021 | 1,845 | 2,520 | 1,444 | 2,491 | 1,627 | 2,061 |
| Minority Interest | 0 | 0 | 0 | 0 | 0 | -25 | 0 | 0 | 0 | 0 |
| Net Income ATOP | 2,798 | 1,726 | 1,901 | 3,021 | 1,845 | 2,545 | 1,444 | 2,491 | 1,627 | 2,061 |
| Year-on-year | 13.6% | -38.3% | 10.2% | 58.9% | -38.9% | 38.0% | -43.3% | 72.6% | -34.7% | 26.6% |
| Net Income Margin | 11.2% | 6.8% | 7.2% | 11.0% | 7.4% | 7.5% | 4.0% | 5.8% | 3.7% | 4.6% |
| (Balance Sheet) | ||||||||||
| Cash & Short-Term Investments | 11,694 | 11,471 | 12,776 | 12,706 | 12,256 | 14,662 | 10,800 | 11,489 | 11,733 | 13,753 |
| Total assets | 22,327 | 22,866 | 24,198 | 24,048 | 24,043 | 28,199 | 25,963 | 28,412 | 28,148 | 30,336 |
| Total Debt | 327 | 340 | 293 | 334 | 6 | 372 | 128 | 173 | 280 | 321 |
| Net Debt | -11,367 | -11,131 | -12,483 | -12,372 | -12,249 | -14,290 | -10,673 | -11,316 | -11,453 | -13,432 |
| Total liabilities | 6,237 | 5,983 | 6,376 | 5,054 | 4,278 | 6,948 | 5,810 | 6,550 | 5,724 | 6,708 |
| Total Shareholders’ Equity | 16,090 | 16,883 | 17,822 | 18,994 | 19,765 | 21,251 | 20,153 | 21,863 | 22,424 | 23,628 |
| (Cash Flow) | ||||||||||
| Net Operating Cash Flow | 3,770 | 2,609 | 5,288 | 2,952 | 2,795 | 5,692 | 904 | 3,942 | 3,856 | 5,190 |
| Capital Expenditure | 1,825 | 1,942 | 2,291 | 1,832 | 2,140 | 2,274 | 2,277 | 2,166 | 2,706 | 2,229 |
| Net Investing Cash Flow | -1,551 | -1,977 | -2,091 | -1,855 | -2,146 | -2,275 | -2,335 | -2,252 | -2,603 | -2,134 |
| Net Financing Cash Flow | -711 | -852 | -880 | -1,858 | -1,100 | -1,014 | -2,441 | -1,009 | -1,037 | -1,041 |
| Free Cash Flow | 2,198 | 930 | 3,358 | 1,382 | 970 | 3,882 | -896 | 2,302 | 1,783 | 3,601 |
| (Profitability ) | ||||||||||
| ROA (%) | 13.16 | 7.64 | 8.08 | 12.52 | 7.67 | 9.74 | 5.33 | 9.16 | 5.75 | 7.05 |
| ROE (%) | 18.67 | 10.47 | 10.96 | 16.41 | 9.52 | 12.41 | 6.97 | 11.86 | 7.35 | 8.95 |
| Net Margin (%) | 11.24 | 6.80 | 7.20 | 11.01 | 7.44 | 7.47 | 3.97 | 5.82 | 3.67 | 4.60 |
| Asset Turn | 1.17 | 1.12 | 1.12 | 1.14 | 1.03 | 1.30 | 1.34 | 1.57 | 1.57 | 1.53 |
| Assets/Equity | 1.42 | 1.37 | 1.36 | 1.31 | 1.24 | 1.27 | 1.31 | 1.29 | 1.28 | 1.27 |
| (Per-share) Unit: JPY | ||||||||||
| EPS | 98.9 | 61.0 | 67.2 | 108.5 | 67.4 | 93.0 | 53.6 | 94.2 | 61.5 | 77.8 |
| BPS | 568.6 | 596.7 | 629.8 | 694.2 | 722.4 | 776.7 | 762.2 | 826.9 | 846.9 | 892.1 |
| Dividend per Share | 30.00 | 30.00 | 30.00 | 40.00 | 36.00 | 52.00 | 38.00 | 39.00 | 39.00 | 40.00 |
| Shares Outstanding (million shares) | 28.30 | 28.30 | 28.30 | 28.30 | 28.30 | 28.30 | 28.30 | 28.30 | 28.30 | 28.30 |
Source: Calculated by Omega Investment based on FactSet’s standard criteria, rounded to the nearest whole number.