2026-10-08
Home
Japanese

Omega Investment Co., Ltd.
Itoki (Company note – Basic)

| Share price (9/17) | ¥2,531 | Dividend Yield (26/12 CE) | 3.6 % |
| 52weeks high/low | ¥3,695/2,201 | ROE(25/12 act) | 17.7 % |
| Avg Vol (3 month) | 229.7 thou shrs | Operating margin (25/12 act) | 8.9 % |
| Market Cap | ¥135.11 bn | Beta (5Y Monthly) | 0.67 |
| Enterprise Value | ¥136.93 bn | Shares Outstanding | 53.382 mn shrs |
| PER (26/12 CE) | 11.2 X | Listed market | TSE Prime |
| PBR (25/12 act) | 2.0 X |
| Click here for the PDF version of this page |
| PDF version |
An Office AI company that designs tomorrow’s ‘work’
Continuing to transform with the tailwind of stronger customer investment in human capital
Summary
◇Itoki Corporation (hereinafter, the Company) is a leading office furniture manufacturer founded in Osaka in 1890. It is characterized by its high design quality and integrated manufacturing and sales system. The Company’s mission is ‘We Design Tomorrow. We Design WORK-Style.’ Beyond manufacturing and selling furniture, it advocates Office 3.0, the DX of offices, and promotes a fully integrated strategy ranging from spatial design to services that support productivity improvement. It is also steadily strengthening its earnings base in the logistics and research facilities domains.
◇Leadership of President Koji Minato and improvement in performance and corporate value: Under Koji Minato, who has led the Company as President and Representative Director since March 2022, profitability has improved significantly, and the share price has also risen substantially. Expectations remain strong for his continued leadership.
◇Business overview: The Company’s main businesses are the Workplace Business and the Equipment & Public Works-Related Business.
・Workplace Business: Provides services including the manufacture and sale of office furniture, office repairs, assembly and construction, office space design, and project management for office relocation. The Company is expanding its business scale and adding value by rolling out proposals and consulting services nationwide that help improve office productivity. It is also promoting Office 3.0, which uses data to support office operations. In FY12/2025, net sales were 111.5 billion yen, operating profit was 10.9 billion yen, and the operating profit margin was 9.9%.
・Equipment & Public Works-Related Business: Provides logistics solutions such as warehousing and automated logistics system equipment, equipment for research facilities, and environmental and spatial construction for public facilities. It boasts the No. 1 track record in deliveries of small- and mid-sized shuttle-type automated warehouses and similar systems. In FY12/2025, net sales were 40.5 billion yen, operating profit was 2.4 billion yen, and the operating profit margin was 6.1%.
◇Medium-term management plan ‘RISE TO GROWTH 2026’: The medium-term management plan announced in February 2024 positions 2024-2026 as a ‘high-profitability phase’ to enhance sustainable growth potential. Specifically, it consists of the priority strategy ‘7 Flags’ and ESG strategies based on the concept of ‘Tech x Design based on PEOPLE.’ The financial targets for FY12/2026 are net sales of 167.5 billion yen, operating profit of 16.0 billion yen, an operating profit margin of 9.6%, and ROE of 18.5% (> assumed cost of capital of 9-10%). The plan fully responds to current stock market demands.
◇Performance trends reflecting the results of reforms: Business performance has been progressing steadily. In FY12/2025, net sales were 153.6 billion yen (up 11.0% YoY), operating profit was 13.6 billion yen (up 35.8% YoY), the operating profit margin was 8.9%, and ROE was 17.7%, meaning that the numerical targets of the medium-term management plan have been almost achieved. The Company’s FY12/2026 forecast is net sales of 167.5 billion yen and operating profit of 16.0 billion yen, bringing overachievement of the medium-term management plan targets into view.
◇Share price trends and points of interest: The Company’s share price rose from 347 yen at the end of March 2022, when President Minato took office, to 2,565 yen most recently in September 2026, while PBR increased from below 1x to around 2.1x. This was driven by the Company steadily capturing customers’ growing investment appetite for offices and other facilities with a focus on profitability, resulting in continued business expansion in line with the medium-term management plan. Going forward, in addition to the FY12/2026 results, attention will focus on the next medium-term management plan from FY2027 onward. Expectations include completing a business model that supports customers’ productivity improvement by advancing the Office 3.0 domain; thereby further raising profitability and reducing earnings volatility in the Workplace Business; horizontally deploying the successful model of that business to factory offices and research facilities; establishing new earnings bases such as multi-purpose disaster prevention shelter doors and semiconductor cleaning equipment; global expansion; AI-driven management; and improvement in employee engagement and productivity.
Table of contents
| Summary | 1 |
| Key financial data | 2 |
| Company profile | 3 |
| History | 4 |
| Group overview / Production structure / Business diagram | 7 |
| Business overview | 9 |
| Workplace business | 9 |
| Equipment & Public Works-Related business | 17 |
| Growth strategy | 19 |
| Medium-term management plan RISE TO GROWTH 2026 | 19 |
| Financial results | 23 |
| Full-year results for FY12/2025 | 23 |
| FY12/2026 full-year forecast | 25 |
| Stock information, etc. | 25 |
| Share price trend | 28 |
| Share price observation | 29 |
| Major shareholders, Shareholding by ownership, Shareholder return policy | 30 |
| Corporate governance and the top management | 31 |
| Sustainability | 34 |
| Financial data | 36 |
Key financial data
| Unit: million yen | 2021 | 2022 | 2023 | 2024 | 2025 | 2026 CE |
| Sales | 115,905 | 123,324 | 132,985 | 138,460 | 153,682 | 167,500 |
| EBIT (Operating Income) | 2,561 | 4,582 | 8,524 | 10,078 | 13,686 | 16,000 |
| Pretax Income | 1,523 | 8,372 | 8,378 | 10,071 | 14,099 | |
| Net Profit Attributable to Owner of Parent | 1,166 | 5,294 | 5,905 | 7,183 | 9,382 | 11,200 |
| Cash & Short-Term Investments | 17,451 | 26,976 | 24,795 | 22,482 | 21,629 | |
| Total assets | 103,898 | 115,288 | 117,437 | 120,521 | 130,724 | |
| Total Debt | 20,091 | 19,487 | 17,308 | 37,924 | 34,627 | |
| Net Debt | 2,640 | -7,489 | -7,487 | 15,442 | 12,998 | |
| Total liabilities | 58,818 | 65,374 | 62,434 | 71,174 | 73,908 | |
| Total Shareholders’ Equity | 44,931 | 49,871 | 54,960 | 49,260 | 56,709 | |
| Net Operating Cash Flow | 2,774 | 5,804 | 6,321 | -1,000 | 8,942 | |
| Capital Expenditure | 2,110 | 4,145 | 3,316 | 6,036 | 6,017 | |
| Net Investing Cash Flow | -1,170 | 4,923 | -4,012 | -7,107 | -3,847 | |
| Net Financing Cash Flow | -2,658 | -1,426 | -4,148 | 5,905 | -5,941 | |
| Free Cash Flow | 664 | 1,659 | 3,005 | -4,146 | 5,193 | |
| ROA (%) | 1.12 | 4.83 | 5.08 | 6.04 | 7.47 | |
| ROE (%) | 2.63 | 11.17 | 11.27 | 13.79 | 17.71 | |
| EPS (Yen) | 25.8 | 117.0 | 130.3 | 147.0 | 190.2 | 226.7 |
| BPS (Yen) | 993.9 | 1,101.3 | 1,212.0 | 1,001.1 | 1,147.8 | |
| Dividend per Share (Yen) | 15.00 | 37.00 | 42.00 | 55.00 | 75.00 | 90.00 |
| Shares Outstanding (Million shares) | 45.66 | 45.66 | 45.66 | 53.38 | 53.38 |
Source: Omega Investment from company materials
Company profile
Itoki is one of the four largest manufacturers of office furniture in Japan. It is a long-established company with a history of more than 130 years since its foundation in 1890.
With a mission statement of “We Design Tomorrow. We Design WORK-Style”, the Company not only manufactures and sells office furniture but also provides consulting on working styles and space design, offering the value of creating spaces, environments, and places for workers. The Company has long been committed to designing, and its products are renowned for design excellence.
The two business segments are.
Workplace business: mainly manufactures and sells office furniture, but as stated in its mission statement, the Company advocates the creation of ‘working environments’ tailored to how customers work. In recent years, the Company has actively responded to the needs of a growing number of ways of working, such as working from home and in dispersed locations, in addition to working “collectively” in an office. Moreover, the Company provides consulting services and other total solutions.
Main products and services; office furniture (desks and workstations, tables, office and conference chairs, system storage furniture, lockers), manufacture and sale of construction materials for office space construction, interior decoration work, office space design, project management for office relocation, etc., office repair and maintenance services, telework furniture, study furniture.
Equipment & Public Works-Related business: provides logistics-related facilities, which have proliferated in recent years, as well as research facility equipment for pharmaceutical companies, universities and research institutions, and equipment for public facilities.
Main products and services: Logistics equipment (shuttle cart automated warehouse systems (SAS)), storage shelves / special doors/office security systems/research facility equipment/powder machinery and equipment/semiconductor cleaning equipment, environmental and spatial construction for public facilities, etc.
The composition of sales by region is as follows: Japan, 146,593 million yen (95%); Asia, 6,419 million yen (4%); with domestic sales accounting for over 90%.
History (See the history table on the following page)
1890-1949: from popularising inventions and patents to selling and manufacturing office equipment.
The Company’s origins date back to December 1890, when founder Kiichiro Itoh founded Itoh Ki Shoten in Osaka’s Koraibashi district to promote his inventions and patents and to handle imports. In 1903, the Company began importing and selling paper clips and staples. Both are commonly used in offices today but trace their origins back more than 100 years when the Company started to sell them. Later, in 1908, the Itoki Shoten Engineering Department was established. It started producing office equipment such as hand-carry safes and simple stationery. In the sense that the Company began its business by importing, selling and repairing foreign products after the opening of Japan to the outside world in the Meiji era, and later took on the challenge of domestic production and expanded its business, it has something in common with other Japanese manufacturing companies that are now world leaders, such as Seiko Group Corporation (Hattori Watch Shop) and Brother Industries (Yasui Sewing Machine Shop).
In 1910, the Company began importing and selling English typewriters, thermal bottles, etc. In 1913, it launched the independently developed ‘Zeni-ai-ki’ (money recording and disbursing machine). In 1925, it began manufacturing its steel-made furniture, including lockers. In 1937, it expanded into Tokyo, opening a Tokyo branch in Gofukubashi, Chuo-ku.
1950-1969: Steel furniture creates modern offices. Highly regarded in terms of design.
After the war, demand for office furniture surged as Japan’s economy grew rapidly; in 1955, the Company began manufacturing and selling steel desks. The Company’s steel furniture subsequently paved the way for various types of desks. In 1960 it established three major systems for filing, slip accounting and office layout. In response to the demand for office rationalisation during the period of high economic growth, the Company offered filing and slip accounting systems, as well as ‘office layout’, a functional arrangement of furniture, office equipment and supplies centred on desks, thereby establishing the Itoki brand in office systematisation.
Furthermore, in 1962, the Company expanded into the field of home and student desks. In 1967, the Company adopted the catchphrase ‘Good Design, Good System’, establishing its image as a design company.
Meanwhile, as its business expanded, the Company listed its shares on the Second Section of the Osaka Securities Exchange in October 1961 and on the Second Section of the Tokyo Stock Exchange in September 1962.
1970-1989: office planning, promoting the New Office.
In the 1970s, the Company began technical cooperation with overseas companies and introduced state-of-the-art office systems to Japan. Beyond the mere supply of office furniture, the Company had come to offer ‘office planning’. In 1976, 14 of its products were selected for the G-Mark, and the Company’s reputation for design continued to grow. Since then, many products have been awarded the G Mark every year. In 1977, the Company launched a research equipment and furniture system in cooperation with the Swiss company Vivo. With this, the Company entered the current Equipment / Public business field.
In 1984, local subsidiaries were established in Singapore and the USA. The Company also developed its business with an eye on overseas markets. In 1985, the Company adopted its CI, which is still used today. In 1987, the Company was listed on the First Section of the Tokyo Stock Exchange and the Osaka Securities Exchange.
1990 to present: over 100 years in business and creating offices for the 21st century.
Even after 100 years in business, the Company continues to provide products and services that meet the demands of the times. In 1994, the Company began selling free-access floors to meet the needs of the times. It also focuses on quality control, and in 1998 it was registered for ISO 9001 certification. In 2001, the Company completed the accreditation of all its offices.
In 2005, the manufacturing division Itoki Crebio and the sales division Itoki merged and changed the Company name to Itoki Corporation. The integration of manufacturing and sales enabled quicker management decisions and rationalisation of the group in the face of accelerating global trends.
Since then, the Company has developed and marketed various new products in response to the demands of the times. The Company offers ergonomically designed office chairs and office furniture; in 2017, the FLIP FLAP (chair) won the international design award Red Dot Design Award.
In 2018, offices in the metropolitan area were consolidated in Nihonbashi, and ITOKI TOKYO XORK was established. It advocates a comprehensive work style strategy that maximizes workers’ abilities and intends to conduct various demonstrations as a place to practize the next generation of work styles, and to disseminate the various knowledge and know-how generated from these experiments to society.
Itoki Shoten was founded in December 1890 in Higashi-ku, Osaka.
In 1908 the Itoki Shoten Craft Department was established, and office equipment production began.
In April 1950, the Company was spun off from Itoki Shoten and established Itoki Kosakusho Co. in Izumio, Taisho-ku, Osaka.
The main changes since then have been as follows.

Source: company’s annual securities report
Management leadership in the spotlight
A recent development of note is the current management team and management structure.
The current President and CEO, Koji Minato, joined the Company in September 2021 and assumed his current position in March 2022. He joined NTT in 1994 and holds an MBA from USC. He has since served as general manager of Sun Microsystems and (after Oracle acquired Sun Microsystems) vice-president of Oracle Japan, an unusual background for a top corporate executive.
He is expected to appropriately guide the Company in light of technological trends, such as the shift to IoT in the office, and to utilise his management experience in foreign-owned companies to activate internal human resources and improve financial performance.
Since he was appointed President, his performance has fully met these expectations in terms of financial results, qualitative aspects, and share price. In other words, since he took office, business performance has expanded steadily, employee engagement has improved, and the share price rose from 347 yen at the end of March 2022 to 2,565 yen in September 2026, while PBR increased from below 1x to around 2.1x. Expectations for his leadership continue to rise.
President Minato’s approach
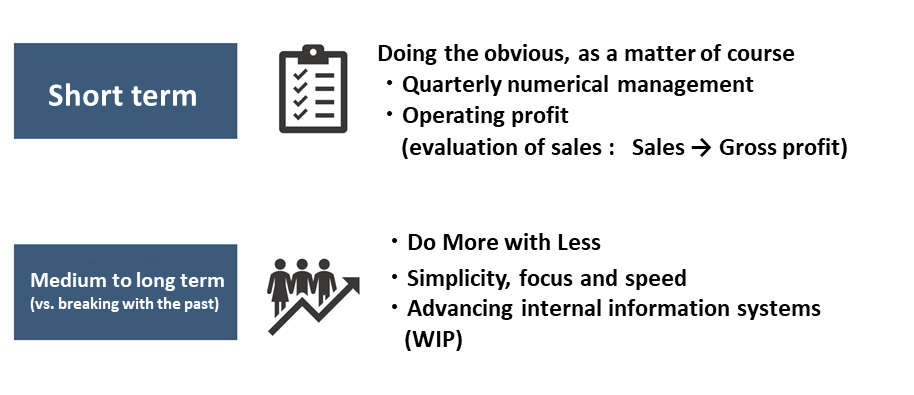
Source: Omega Investment from company materials
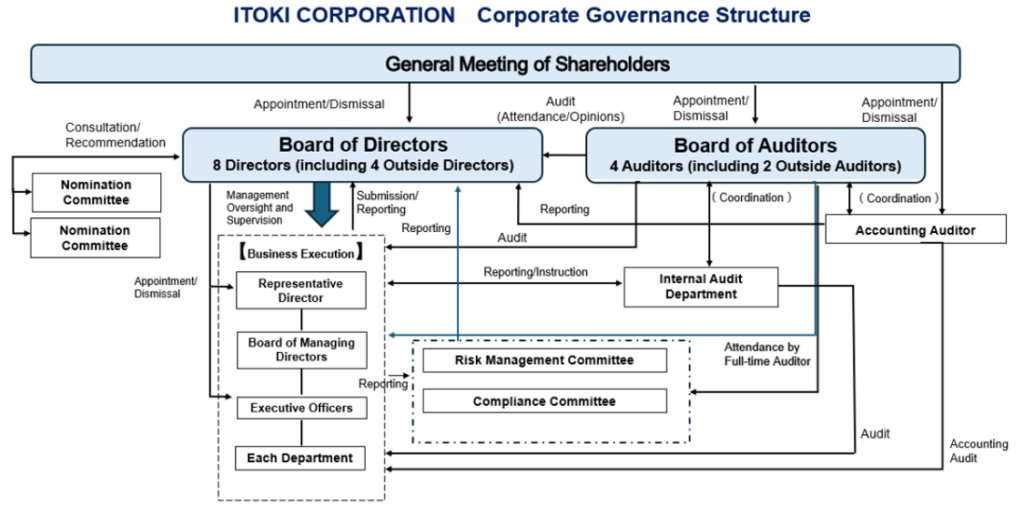
Corporate governance reform is also progressing. The Company has an Audit & Supervisory Board, and four of its eight directors are independent outside directors. It has also established voluntary Nomination and Compensation Committees, with outside directors constituting a majority and serving as committee chairs. In addition, the company is implementing a president succession development plan. (Details provided later.)
Production structure
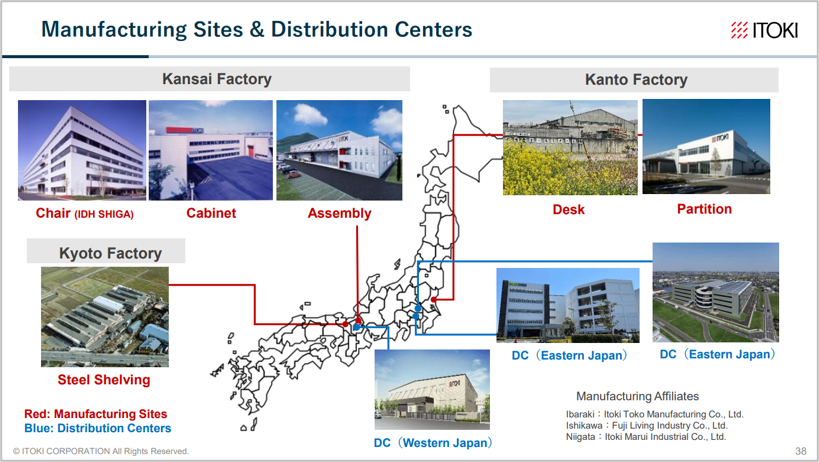
Source: Company materials
Group overview
As seen in the history, the Company was founded in Osaka, but its current head office is in Chuo-ku, Tokyo (relocated in 2018). the Company group comprises 31 consolidated subsidiaries, six non-consolidated subsidiaries (see next section). Since the 2000s, the Company has been actively expanding overseas, particularly in ASEAN and China, acquiring local companies and establishing subsidiaries and affiliates in each region.
Production structure
The Company’s production system is based at its domestic plants. This is because the Company’s primary market is the domestic market, and office furniture is bulky in volume due to its storage characteristics, so it is not cost-effective to produce it overseas and import it at high transport costs.
The current main plant is the Shiga Plant, which manufactures chairs, desks, cabinets, and other products for the Workplace business. It employs about 300 people. In September 2022, the Assembling Process Centre (AP Centre) was opened at the same site, which started full operation in January 2023. The AP Centre is working to reduce the cost ratios by centrally managing the Company’s products’ storage, assembly, and shipping. The centre will also relocate the production line for the system streamer SAS-R, whose demand is increasing rapidly in the logistics market, to meet growing demand. The Neyagawa plant, one of the Company’s main plants for many years, was closed in 2022, with its production consolidated at the Shiga plant. the Company sold the idle land of the plant for 6.5 billion yen and is working on improving asset efficiency.
Business diagram
See the next page for a diagram of the business structure. The Company and its group companies are involved in manufacturing, sales, construction, interior decoration, installation, and maintenance services.
Overseas office furniture manufacturers often specialise only in manufacturing and sales and rarely provide interior design, construction, or workplace design. In Japan, consulting companies and office design firms are generally engaged between the office furniture provider and the client for large-scale projects to provide work style design and workplace design. However, in recent years, office furniture manufacturers have also started to offer a comprehensive service from upstream to construction and delivery of office furniture, starting with small and medium-sized projects, to obtain fees commensurate with the proposal’s value.
Major consolidated subsidiaries
| Company name | Business activities |
| Itoki All Steel Co., Ltd. | Manufacture of counters, large top desks, wall storage furniture, desk panels, etc. |
| Fuji Living Industry Co., Ltd. | Manufacture of meeting and amenity chairs. |
| Itoki Market Space Inc. | Sales of shop fixtures/store planning |
| Itoki Toko Manufacturing Co., Ltd. | Manufacture of steel doors, safety deposit boxes, various types of shielding doors, fire-resistant walls, nuclear radiation shielding doors, etc. |
| Itoki Marui Industry Co., Ltd. | Manufacture of steel office machinery and equipment |
| Sanko Facilities Inc. | Sales of office equipment, furniture, fixtures and incidental goods, construction work, design management |
| Itoki Dot Design Co., Ltd. | Space design and construction specializing in small- and medium-sized offices |
| Itoki Shared Value Co., Ltd. | Office space sharing business, office furniture rental and reuse business, etc. |
| Shin Nihon System Technology Corporation | Provision of IT solution services. |
| Dalton Corporation | Design, manufacture and sale of research and education equipment; design and sale of powder processing machinery; design and sale of high-tech plant systems. |
| Soar Co., Ltd. | Office furniture sales, delivery, installation, and general freight transportation services. |
| Tarkus Interiors Pte Ltd | Singaporean interior decoration company, made a subsidiary in 2016. |
| Novo Workstyle Asia Limited | Regional business headquarters for Asia, in Hong Kong, established 2017. |
| Novo Workstyle CO., Limited | Established in Jiangsu Province, China, to supply manufacturing components. |
| ITOKI SYSTEMS (SINGAPORE) PTE., LTD | Singapore subsidiary, sales of office furniture, proposals and logistics systems. |
| ITOKI CHINA HOLDINGS Co., Ltd. | Holding company for Chinese operations. Under the umbrella of Novo Workstyle Co. Offices in Beijing, Shanghai, Suzhou, Shenzhen, etc. |
| 16 other companies |

Source: Omega Investment from company materials
Business overview
Workplace business
A core business accounting for 73% of consolidated net sales: focusing on proposal-based sales nationwide, with profitability improving
In FY12/2025, the Company’s Workplace Business recorded net sales of 111.5 billion yen, operating profit of 10.9 billion yen, and an operating profit margin of 9.9%. Net sales increased 9.1% YoY, operating profit increased 36.7% YoY, and the operating profit margin rose 2.0 percentage points YoY, achieving both sales growth and improved profitability. The profit margin has steadily improved over the past five years, indicating that the management policy of emphasizing added value and profitability is becoming firmly established.
Sales by region were 104,953 million yen (94.1% of the total) in Japan, 6,287 million yen (5.6%) in Asia and 289 million yen (0.3%) in others, indicating that the domestic business is currently the main focus. However, the Company is also looking to expand overseas markets.
Since the launch of steel desks in 1955, the Company’s office furniture business has successively developed and provided products to meet office needs in line with Japan’s economic growth and corporate business expansion. the Company has made a significant contribution to developing the Japanese economy.
In the Workplace business, the aim is not just to sell office furniture but to provide higher added value by proposing workplace design and obtaining commensurate value. In the past, it was challenging to differentiate office furniture on a stand-alone basis, leading to price competition, which in turn led to significant discounts together with non-office fixtures and fittings, which sometimes resulted in a decline in profitability. Although the Company’s office furniture was originally well-designed and had won many G Marks (see figure above, next page), it could be said that the Company needed to receive more compensation commensurate with the value it provided. As mentioned above, recent efforts to review the operating structure and culture (shift from sales-oriented to profit-oriented), generate revenue commensurate with enhanced customer value, and sell higher-value-added products and services are bearing fruit.
Workplace business revenue and profit trends
| Workplace business /Financial year | 2020/12 | 2021/12 | 2022/12 | 2023/12 | 2024/12 | 2025/12 |
| Net sales | 83,032 | 80,561 | 85,945 | 94,546 | 102,261 | 111,530 |
| YoY | -3.0% | 6.7% | 10.0% | 8.2% | 9.1% | |
| Segment profit | 1,273 | 1,914 | 2,579 | 6,226 | 8,047 | 10,998 |
| YoY | 50.4% | 34.7% | 141.4% | 29.2% | 36.7% | |
| Profit margin | 1.5% | 2.4% | 3.0% | 6.6% | 7.9% | 9.9% |
Source: Omega Investment from company materials
The office furniture market could add value as new ways of working evolve.
Japan’s office furniture market: market size of 850 billion yen, with stable growth.
The Japan Office and Institutional Furniture Association (JOIFA), which has 136 member companies in the office furniture industry, publishes statistics and surveys as an industry association, but does not make the data publicly available.
Therefore, as a reference, figures for the four major office furniture companies, including the Company, were extracted from segment information and aggregated into a graph (differences in segment definitions among companies and differences in fiscal periods were ignored; Itoki and KOKUYO use December-period figures, OKAMURA uses FY3/2026 figures, and UCHIDA YOKO uses figures through FY7/2025).
Within the total of the four companies, shares in FY2025 were: the Company 13%, KOKUYO 20%, OKAMURA 22%, and UCHIDA YOKO 7%. KOKUYO and OKAMURA each hold nearly one-third of the market, while the Company ranks third and UCHIDA YOKO fourth; however, the Company’s share has been gradually increasing. In addition, the total value of the four companies has been growing steadily about 7%.
In practice, when including sales of companies other than the four, the market size is estimated to be around 850 billion yen annually (of which approximately 500 billion yen is office furniture alone, with the remainder including consulting and construction), based on Omega Investment’s estimates from the sales size of JOIFA member companies and Itoki materials.
Office furniture business sales of the four major office furniture companies
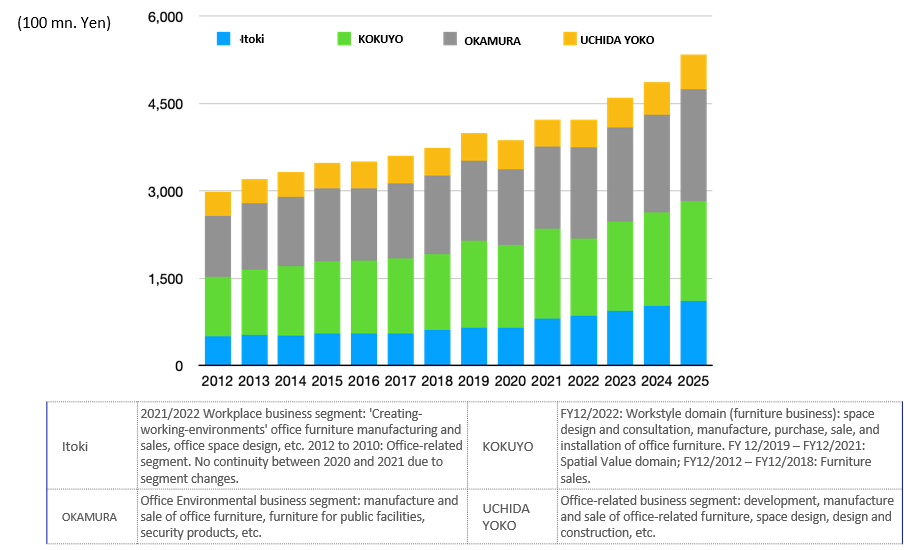
Source: Prepared by Omega Investment from the annual reports of the companies.
Office building market outlook: Supply of large office buildings in Tokyo’s 23 wards is expected to decline slightly, but the renewal market remains active.
Demand for office furniture is influenced by the supply of new office buildings as well as trends in office renewals.
First, regarding the supply of new office buildings, according to Mori Building’s ‘Tokyo 23 Wards Large Office Building Market Trend Study 2026,’ supply is expected to decline in 2026 and 2027, and average annual supply over the next five years is projected to fall below the long-term average for 1986-2025.
Supply of large office buildings in the 23 wards of Tokyo (Mori Building survey)
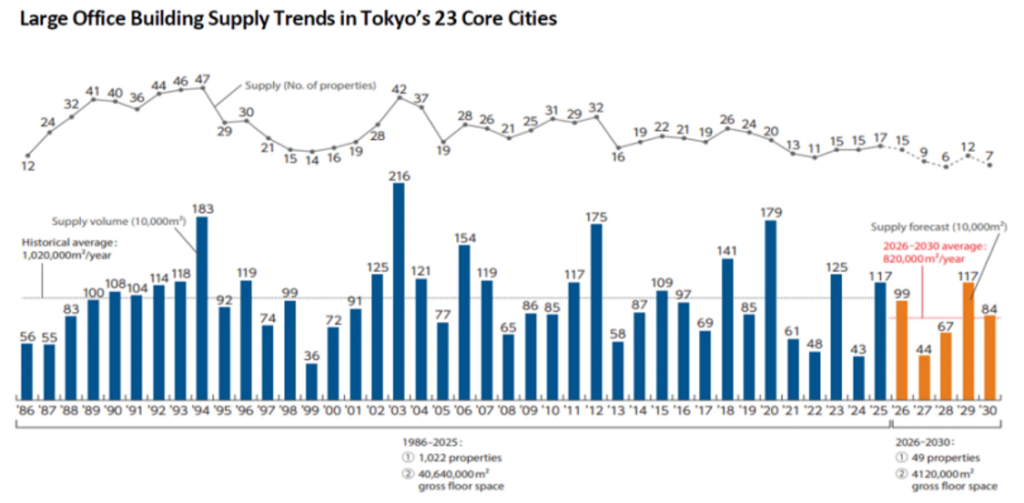
Source: Omega Investment, based on Mori Building’s ‘Tokyo 23 Wards Large Office Building Market Trend Study 2026’.
However, what is important for this business are renewal projects, particularly those outside Tokyo.
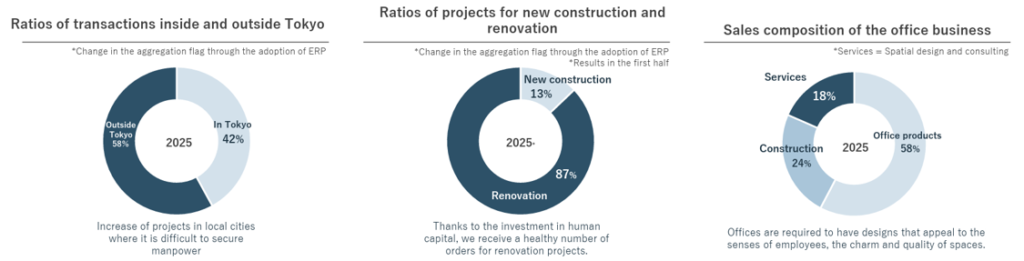
Starting with services such as space design and consulting, projects that also encompass construction and office product sales in an integrated manner allow the Company to deliver optimal office proposals tailored to each customer, while also contributing positively to profitability. Accordingly, the Company has been focusing its business development on renewal projects and projects outside the Tokyo metropolitan area. In particular, it has increased the number of space design designers from 120 to 180 over the past four years. As shown below, these efforts have borne fruit, with renewal projects now accounting for more than 80% of the total and the proportion of projects outside Tokyo steadily rising.
Structure of Itoki’s Workplace business
Source: Company materials
Recent developments in the office furniture market: new business opportunities due to the increasing sophistication of office needs.
In recent years, office needs have undergone a significant transformation. With the introduction of remote work due to the spread of infectious diseases and the subsequent return to the office, the role of the office is changing from what it used to be. This is expected to mean new business opportunities for office furniture companies. Background includes.
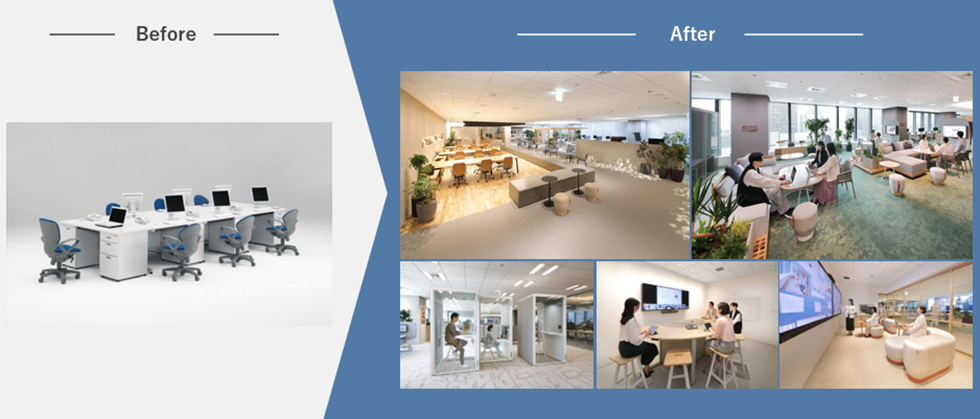
- Reform of work style: the Japanese economy has been stagnant for a long time. As the era of high growth, when productivity could be increased mainly in the manufacturing sector, ended and the proportion of tertiary industry increased, it became difficult to increase productivity, particularly among white-collar workers. Against this backdrop, there are indications that productivity should be improved through reforms in how people work. To achieve this, the internal organization of Japanese companies needs to change, and the composition of corporate offices is undergoing a significant transformation from the old fixed-seat-based office environment (see figure, next page).
- Advances in IT and networking: the way work is carried out in a company has changed significantly over the last 10-20 years due to IT development. The office must respond to the evolution of hardware, software, networks, etc. The change has been within the scope of Itoki’s Office 2.0, which the Company has advocated. In the future, Office 3.0, or the DX orientation of the office, will determine competition for superiority between companies.
- The office as a place for new value creation: as indicated in 1), how people work will change significantly. The pandemic disease has triggered the introduction of remote work, but at the same time, it is still essential to have places where people meet face-to-face and communicate with each other. In the future, it will be crucial to maximize workers’ abilities by combining the central office as a place to share experiences with remote work, which is a flexible way of working at a high level.
- Attracting high value-added human resources: human resources are the biggest asset for future growth in all companies, but IT and other creative personnel need more supply. To retain such talented people, it is essential to have a great office environment and space.
Evolution of office spaces
Source: Company materials
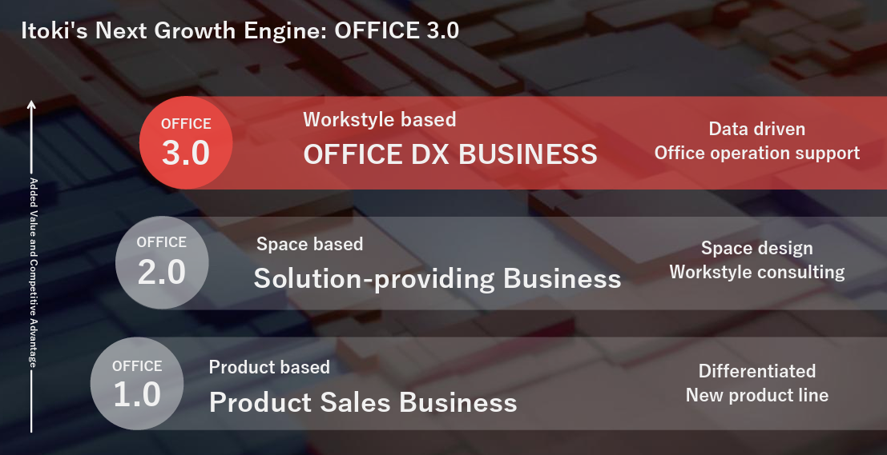
The Company’s approach: multiplying Office 1.0, 2.0 and 3.0 to increase corporate value.
The figure below shows the Company’s response to the changes in the office furniture and office space markets described above. The Company is currently developing Office 2.0, which extends upstream from Office 1.0, its office furniture manufacturing and sales business, to office design and construction, and has steadily raised added value. It is not stopping there and is actively developing Office 3.0, which realizes office DX. By installing sensors on office furniture and in various locations throughout offices and collecting and analyzing data, the Company can provide high-value-added office operation support services that support customers’ human capital management.
The Company’s proposed Office 3.0 concept
Source: Company materials
As a place to practice its own office renewal and Office 3.0, the Company consolidated its Tokyo head office in Nihonbashi in 2018. It opened ‘ITOKI TOKYO XORK,’ which also serves as a showroom (currently ITOKI DESIGN HOUSE). Since its opening, customer visits have continued uninterrupted and have led to business discussions. Accordingly, the Company plans to open ITOKI DESIGN HOUSE locations in Fukuoka and Osaka as well. ITOKI DESIGN HOUSE SHANGHAI in Shanghai is also scheduled to relocate this autumn.
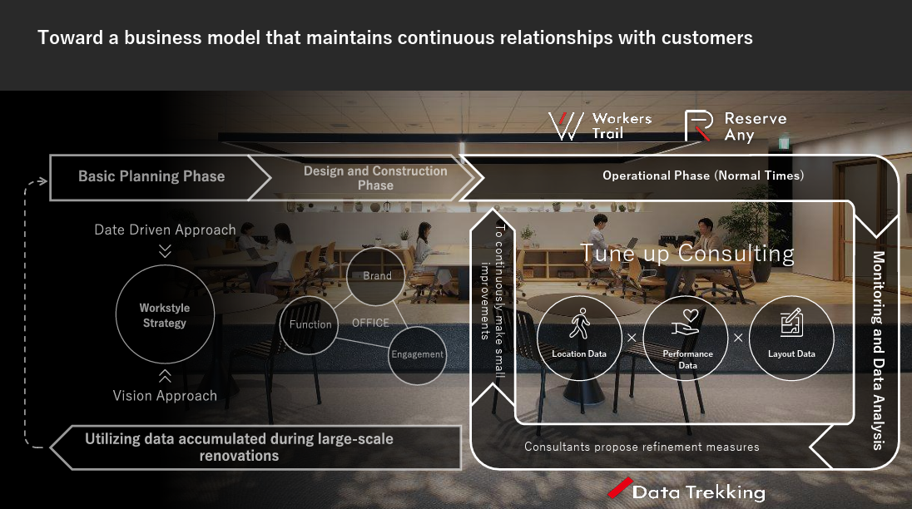
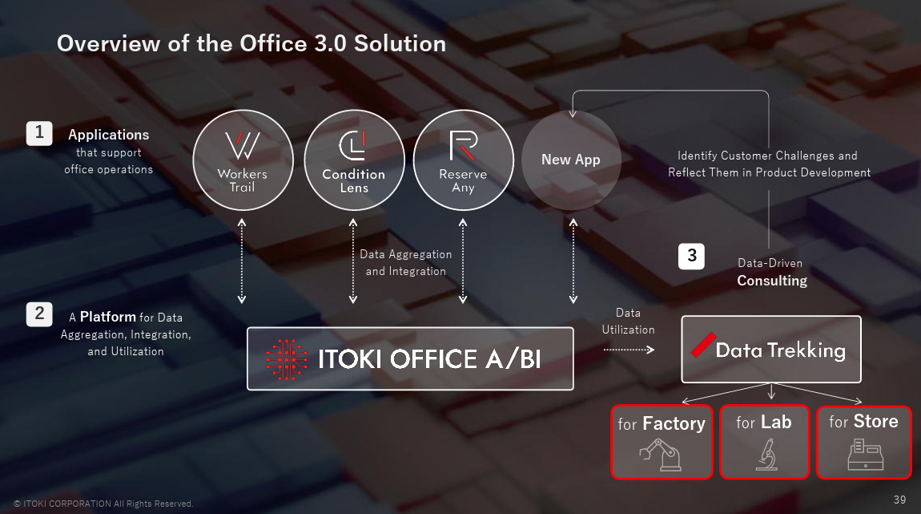
As a specific Office 3.0 service, the Company launched the ‘Data Trekking’ service on February 14, 2024, based on its proprietary ‘ITOKI OFFICE A/BI PLATFORM.’ This system accumulates and analyzes space utilization data, organizational survey data, layout data, customer-specific indicator data, and other information. Data is acquired through services including ‘Workers Trail,’ which visualizes ‘work’ using beacon-based location information, and ‘Condition Lens,’ a proprietary cloud-based organizational survey developed by Itoki that visualizes the performance and condition of individuals and organizations. The Company’s consulting team analyzes the data using its independently developed dashboard-type ‘Office Data Map’ and works in coordination with office designers.
These developments capture customers’ individual needs and can improve office productivity, increase customer satisfaction, retain customers, and generate recurring revenue, making future developments highly noteworthy. The number of orders also appears to be increasing steadily.
Office 3.0 business model
Source: Company materials
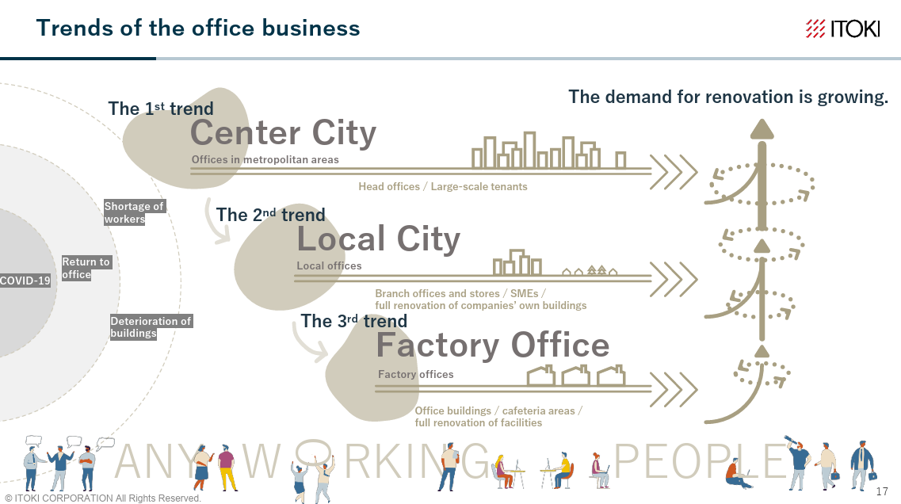
Accelerating horizontal deployment of the successful model
The Company has responded to customers’ moves to strengthen investment in workplaces as part of investment in human capital by developing Office 1.0, 2.0, and 3.0. It has expanded earnings by broadly handling office renewal projects in regional cities. It is now seeking to deploy this successful model more broadly to offices within factories, stores, and research facilities belonging to the Equipment & Public Works-Related Business. This efficiently broadens the Company’s business base, and further growth is expected. The Company is also working to further advance its business model through the use of AI agents.
Source: Company materials
Overview of Office 3.0 solutions
Source: Company materials
Peer competition:
As discussed, the office furniture market is controlled by four major players: the Company, KOKUYO (TSEP: 7984), OKAMURA (TSEP: 7994), and UCHIDA YOKO (TSEP: 8057) which together account for about 60 percent of the market. All but Okamura have a history of more than 100 years, while Okamura also has a long track record of more than 70 years. Regarding the companies’ businesses, most sales for Itoki Corporation and Okamura come from office furniture, fixtures, and fittings for commercial facilities. Kokuyo, on the other hand, as is well known, also generates a large proportion of its sales from stationery-related products. For Uchida Yoko, public-related (e.g., education-related ICT) and information-related (e.g., software licensing) sales account for 80% of its sales.
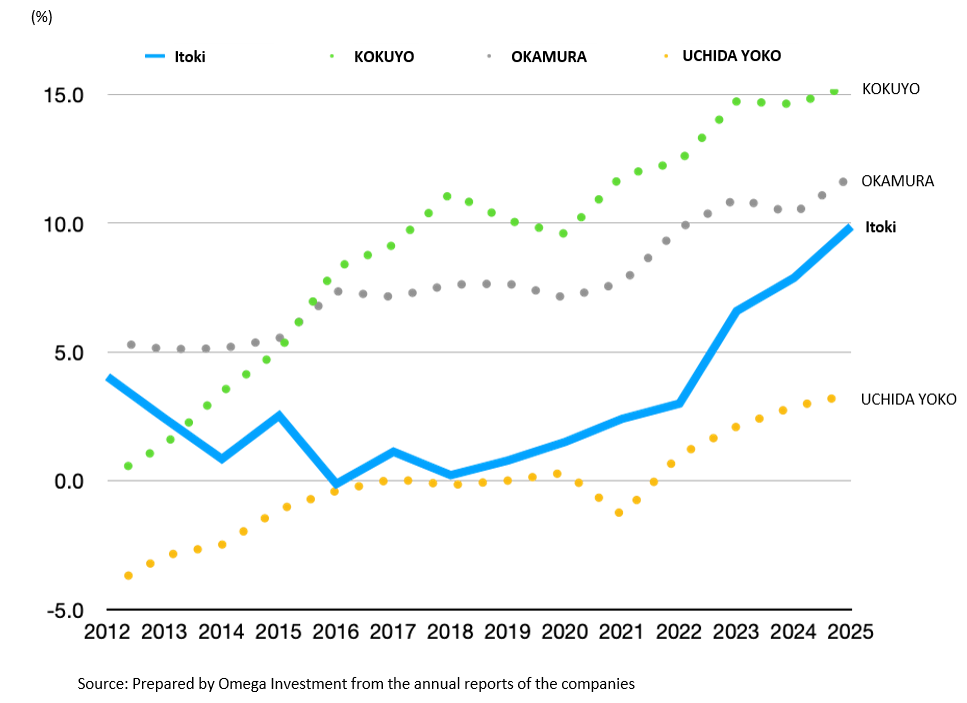
The following graph compares the profitability of each company’s office furniture business. Although the definitions of each company’s segments are not necessarily identical, the graph provides a rough indication of each company’s earnings power. In recent years, profit margins have improved across all companies; KOKUYO and OKAMURA, which have high market shares, maintain high margins; and although Itoki ranks third, it has steadily improved its margin and substantially narrowed the gap with the top two. As the industry shifts toward an emphasis on profitability, the Company’s efforts in value-added proposals, securing profits, and proactively capturing regional projects are steadily bearing fruit.
Four office furniture companies, operating profit margin trends in office furniture-related businesses
Source: Prepared by Omega Investment from the annual reports of the companies
Equipment / Public business
Logistics-related facilities, research facility equipment and other unique products.
In FY12/2025, the Company’s Equipment & Public Works-Related Business recorded net sales of 40,569 million yen (up 17.3% YoY), operating profit of 2,493 million yen (up 34.3% YoY), and an operating profit margin of 6.1% (up 0.7 percentage points YoY).
Net sales by region were 40,233 million yen in Japan, 132 million yen in Asia, and 203 million yen in other regions, with the domestic market again accounting for the majority.
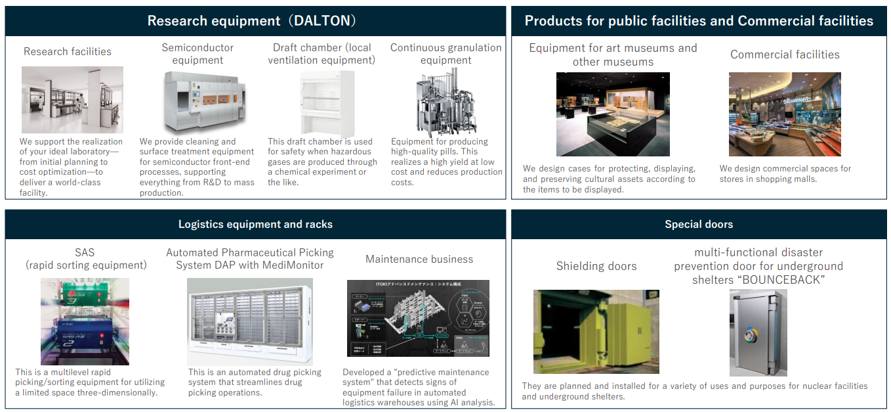
Equipment product range
Source: Company materials
Equipment / Public business revenue and profit trends
| Equipment & Public Works-Related business /Financial year |
2020/12 | 2021/12 | 2022/12 | 2023/12 | 2024/12 | 2025/12 |
| Net sales | 31,602 | 33,488 | 35,667 | 36,839 | 34,572 | 40,569 |
| YoY | 6.0% | 6.5% | 3.3% | -6.2% | 17.3% | |
| Segment profit | 1,225 | 974 | 1,482 | 1,906 | 1,857 | 2,493 |
| YoY | -20.5% | 52.2% | 28.6% | -2.6% | 34.2% | |
| Profit margin | 3.9% | 2.9% | 4.2% | 5.2% | 5.4% | 6.1% |
Source: Omega Investment from company materials
The Equipment & Public Works-Related business dates to 1914, when the Company began selling vent-type safes. Since then, the Company has manufactured and sold a variety of warehouse-related fixtures and fittings and, since the 1980s, has been an industry pioneer in developing and supplying a range of automated warehouse equipment. Based on its experience producing safe doors, the Company also produced and launched special large doors for nuclear power facilities. The Company has continued developing numerous industry firsts, including developing secure locking systems. In recent years, there has been an extreme need for automation equipment for warehouse and distribution systems.
The main customers for logistics equipment are the automotive industry and equipment manufacturers. The main customers for public facilities products are museums, art galleries and libraries. Sales of logistics equipment depend on economic trends and corporate earnings. Still, they are expected to grow, as reducing logistics costs is an ongoing and vital management issue in the manufacturing industry. On the other hand, sales of public facilities are affected by budget execution by public offices and local authorities.
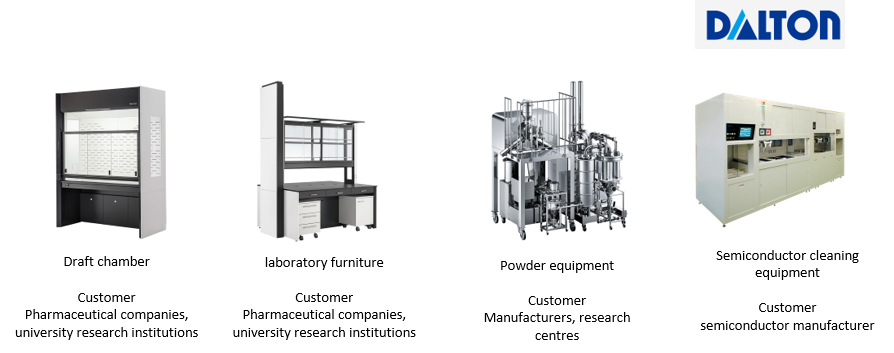
In the same segment, research equipment is another product to note. Dalton Corporation, which the Company invested in in 2011 and became a wholly owned subsidiary in 2017, manufactures and sells these products. Dalton Corporation was founded in 1939 as a manufacturer and distributor of scientific instruments and glassware for analysis (the Company was called San-Ei Seisakusho when it was founded). It established a scientific research facilities division, which developed and sold products used in various research facilities; in 1996, it acquired a powder and granular equipment manufacturer and expanded into powder machinery; in 2014, it introduced the Uni-X Lab Series of draft chambers and laboratory tables.
Dalton Corporation research facility equipment
Source: Omega Investment from company materials
The demand environment overall appears favorable. Customers for research facility equipment include pharmaceutical companies, universities, and research institutions, and sales are affected by trends in R&D expenditures and capital investment by pharmaceutical companies and by scientific research funding at universities. Pharmaceutical companies, the largest customers, are actively investing in R&D expenditures to develop new drugs. Meanwhile, although the continuing decline in research budgets at Japanese universities is a concern, robust research investment budgets at major pharmaceutical customers are expected to continue, and sales of the Company’s research facility equipment are therefore expected to expand.
Among the Company’s initiatives, LAB 1.0, 2.0, and 3.0 deserve particular attention, as they transplant the successful model of the Workplace Business to Dalton. As competition among customers to recruit research personnel intensifies, the Company is expanding its designer workforce and taking other steps to combine product sales with spatial design and workstyle consulting, and to support research facility operations further using data. Attention is also increasing on developing multi-purpose disaster prevention shelter doors, semiconductor cleaning equipment, and other products.
Growth strategy
◇ Medium-term management plan RISE TO GROWTH 2026: ‘High-profitability phase’ in progress.
On 13 February 2024, the Company announced its medium-term management plan, RISE TO GROWTH 2026, covering 2024-2026. It is positioned as a ‘high-profitability phase’ to enhance sustainable growth.
As mentioned earlier, the nature of the workplace, including the office, and its productivity improvements are attracting increasing attention. The thinking style of management at client companies is changing from a one-dimensional view of the office as a cost to a view of the office as an object of human capital investment that pursues investment effects. Furthermore, office DX and the IoT of office equipment are expected to advance. The Company holds the mission “We Design Tomorrow. We Design WORK-Style”, hoping that this transformation in workplace needs will lead to a long-term leap forward for the Company.
This medium-term management plan is based on the “Tech x Design based on PEOPLE” concept and consists of the vital strategy “7 Flags” and ESG strategies.
The Company’s financial targets for FY2026 are sales of 150 billion yen (up 13% from FY12/2023), operating profit of 14 billion yen (up 64%), operating profit margin of 9% (up 3 percentage points), and ROE of 15% (up 4 percentage points). These are more focused on improving profitability than increasing revenue and show the Company’s ambition to become an industry leader in terms of profitability by 2026.
Operating profit is expected to increase by a cumulative +5.5 billion yen from the FY2023, of which +4.8 billion yen is planned to be covered by increased earnings from the Workplace business. More specifically, the profit plan is based on the effects of improvements through enhanced customer value, cost reductions in production and logistics, improved profitability overseas, group synergies and increased revenues. It is set as a must-achieve target rather than a challenging target.
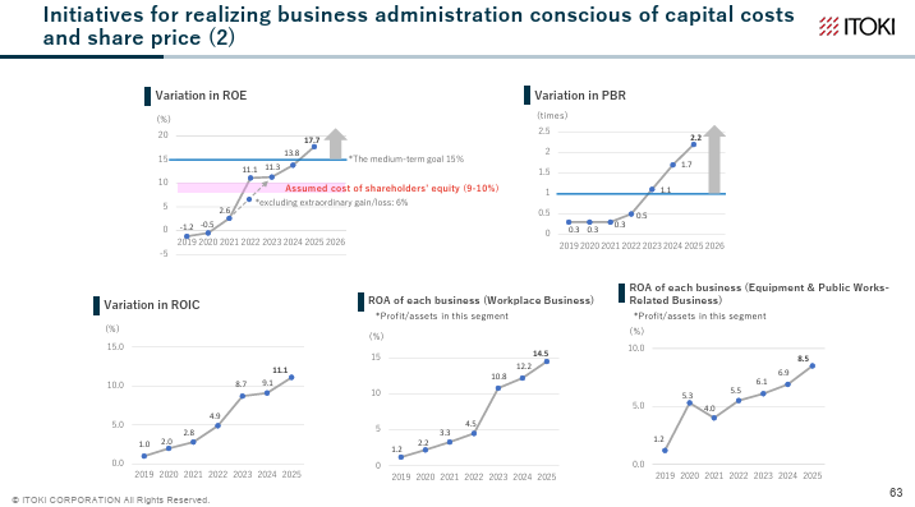
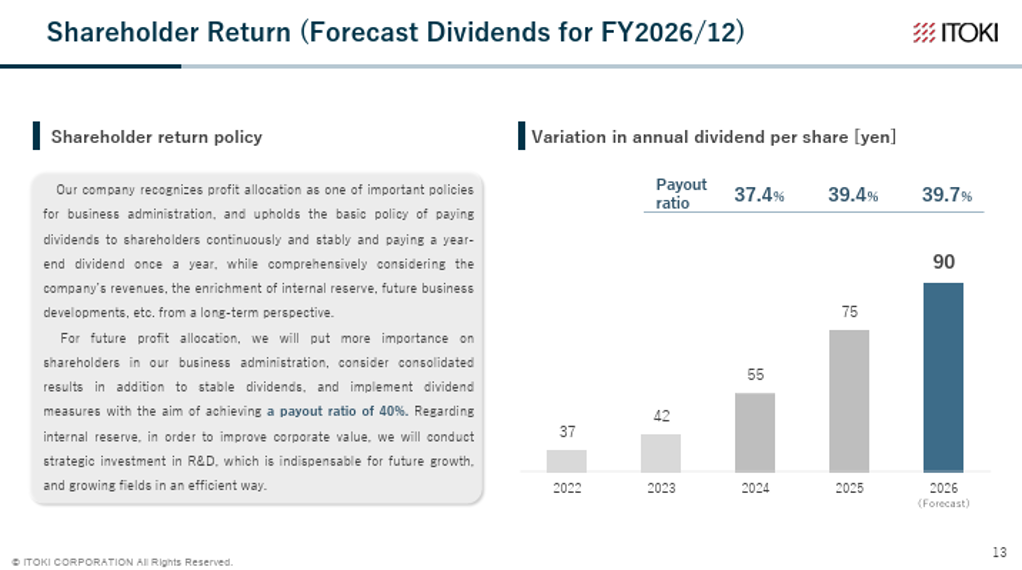
The Company’s message to the stock market is to maximize shareholder value and improve PBR by reducing the cost of capital while aiming to achieve ROE in excess of the assumed 9-10% cost of equity capital. Regarding shareholder returns, the Company will raise its dividend payout ratio by 10 percentage points to 40%. This is more than sufficient to meet the current expectations of the stock market.
The details of the plan will be discussed later in this report. Still, it can be said that it is a broadly well-developed plan that includes strengthening the core business base, seeding new office-related businesses, developing specialized facility areas, strengthening the earnings structure on a consolidated basis, human capital, and financial strategies. The company achieved its revenue target one year ahead of schedule in FY12/25 and subsequently revised its financial targets for FY12/26, the final year of its medium-term management plan, to sales of 167.5 billion yen and operating profit of 16.0 billion yen.
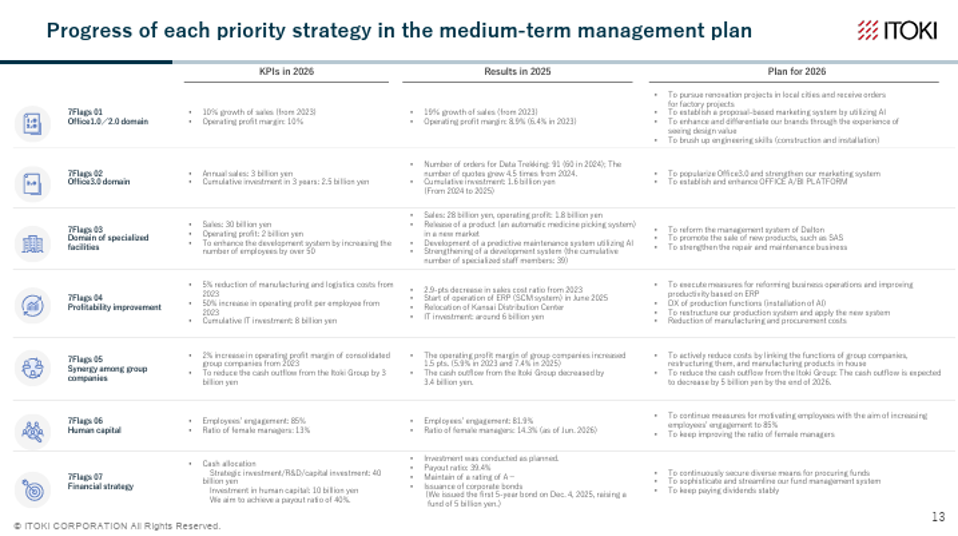
The following is a summary of these seven priority measures and their KPIs.
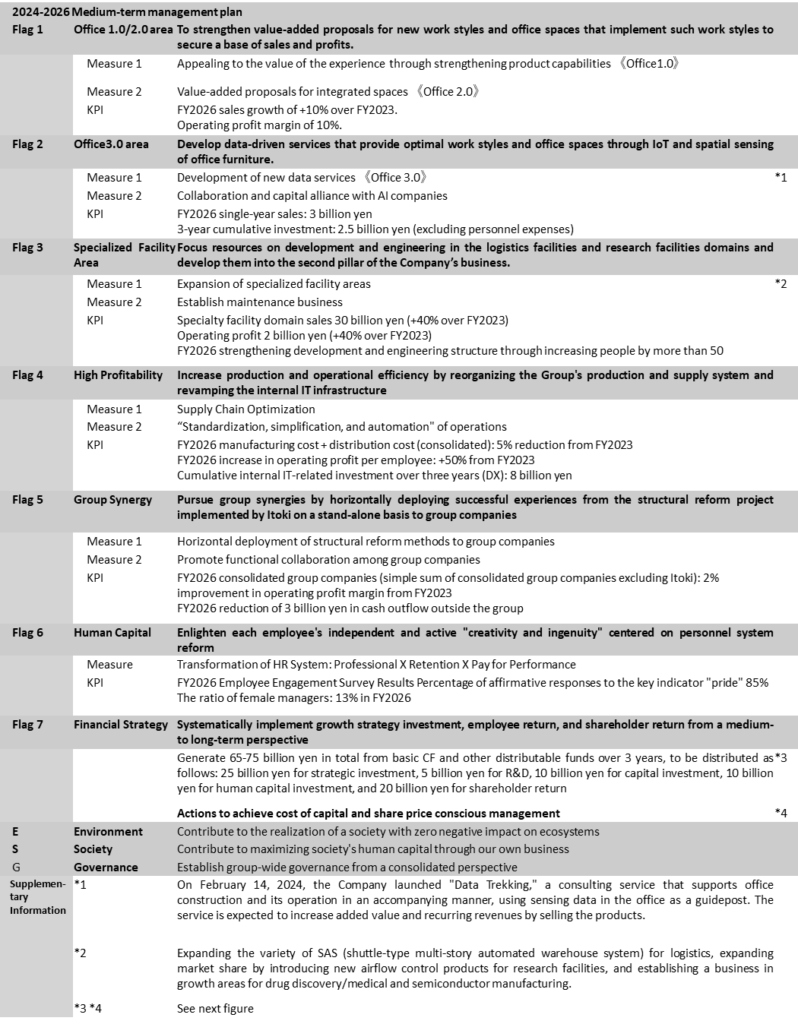
Source: Omega Investment from company materials
Supplementary Information: Allocate the results of improved profitability to reinvestment in line with the medium- to long-term strategy and strengthen shareholder returns.
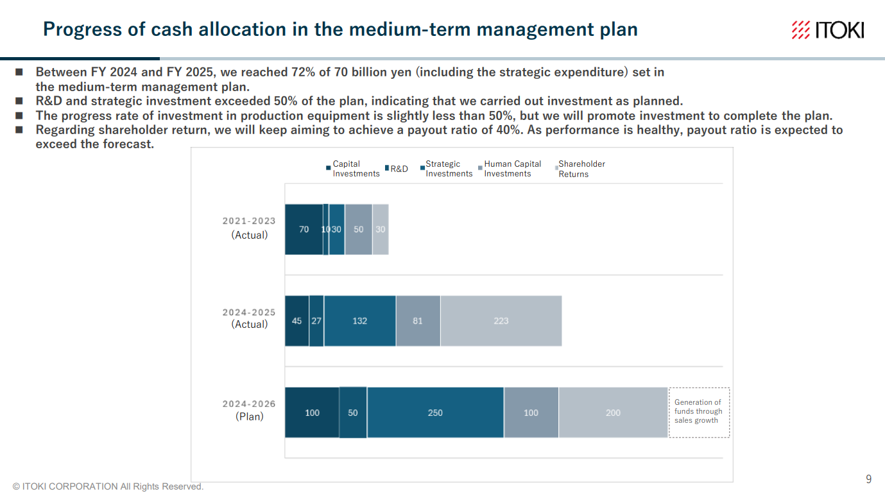
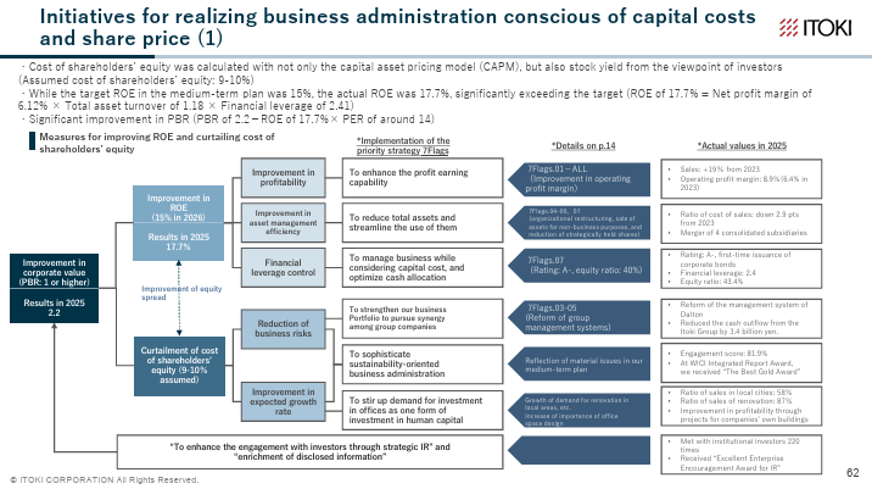
Source: Company materials
Financial results
FY12/2025 financial results
◇Profitable structure firmly established. Record-high profit and higher dividend.
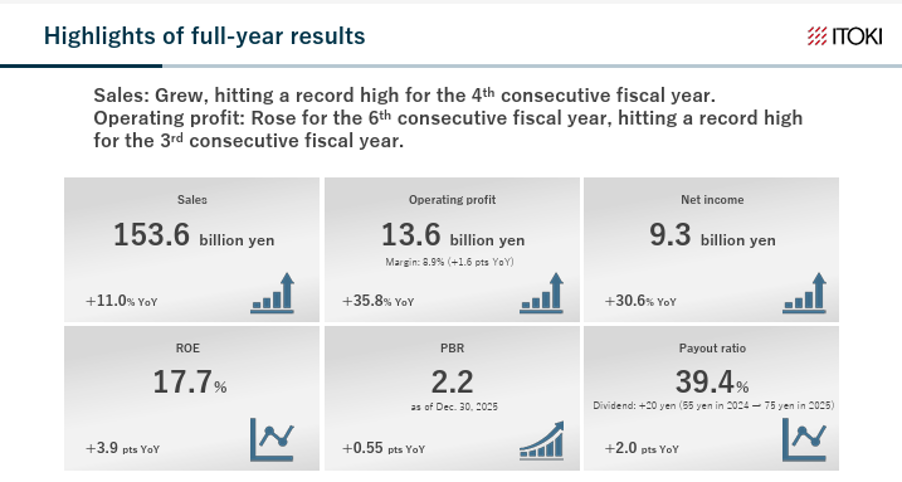
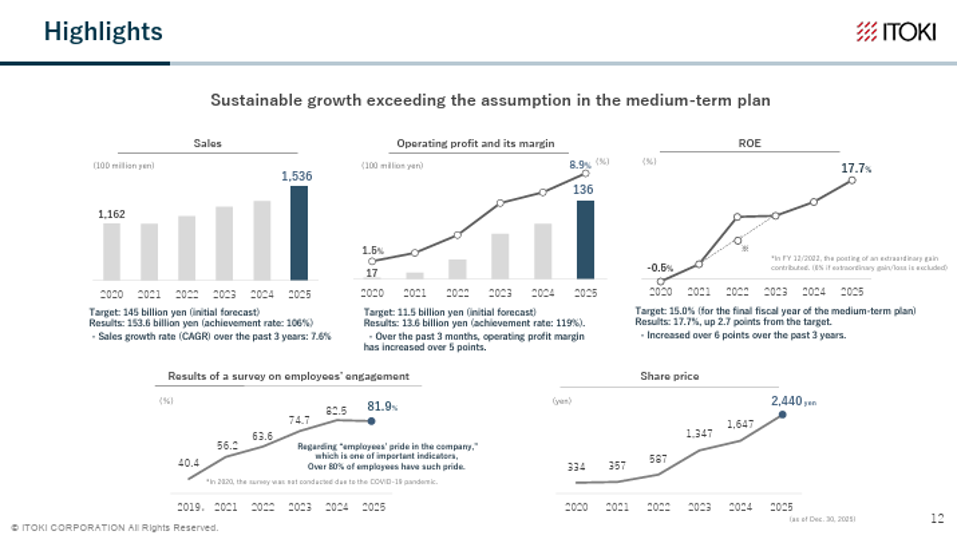
In FY12/2025, net sales were 153.6 billion yen (up 11.0% YoY), operating profit was 13.6 billion yen (up 35.8% YoY), the operating profit margin was 8.9%, and ROE was 17.7%, showing steady growth. As described above, net sales increased in the Workplace Business, driven by office renewal projects, and operating profit rose significantly due to higher sales and improved margins from enhanced customer value. Net sales have increased for four consecutive fiscal years and reached record highs for four consecutive fiscal years, while operating profit has increased for six consecutive fiscal years and reached record highs for three consecutive fiscal years.
The final targets of the medium-term management plan (FY12/2026 net sales of 167.5 billion yen, operating profit of 16.0 billion yen, operating profit margin of 9.6%, and ROE of 18.5%) are largely being achieved.
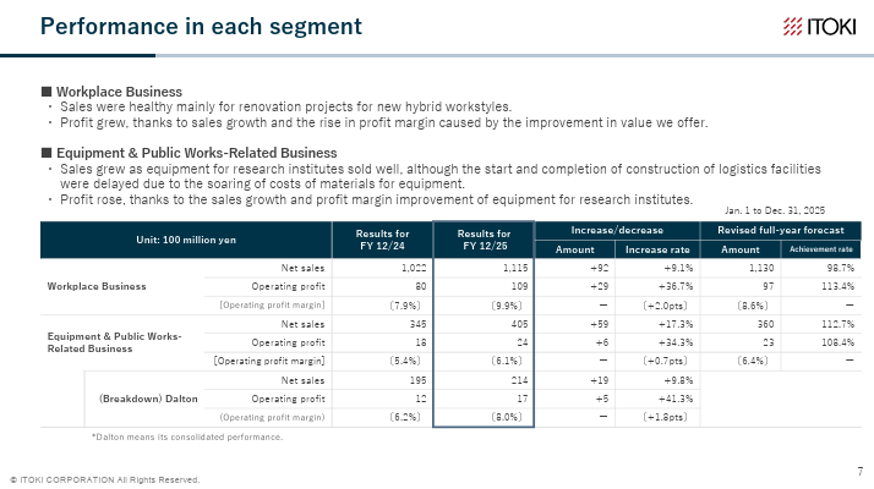
By segment, the Workplace Business led overall performance with increases in both revenue and profit. At the same time, the Equipment & Public Works-Related Business also contributed to increases in both revenue and profit. Profit margins also improved in both businesses.
Progress on the priority strategies is also steady.
Source: Company materials
◇ FY12/2026 Company forecast: continued revenue and profit growth; Upward revision of full-year earnings forecast
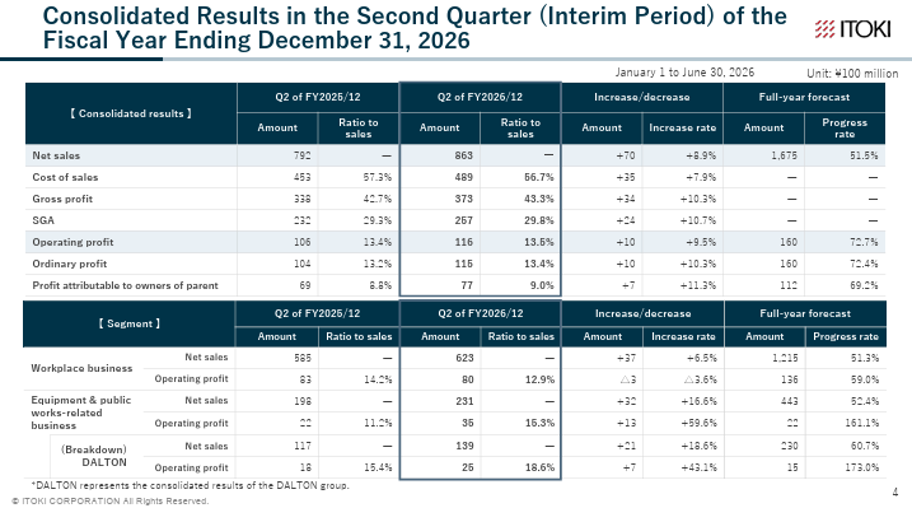
The FY12/2026 2Q (interim) results have already been announced, and performance is progressing steadily. The full-year earnings forecast announced at the beginning of the fiscal year has been maintained.
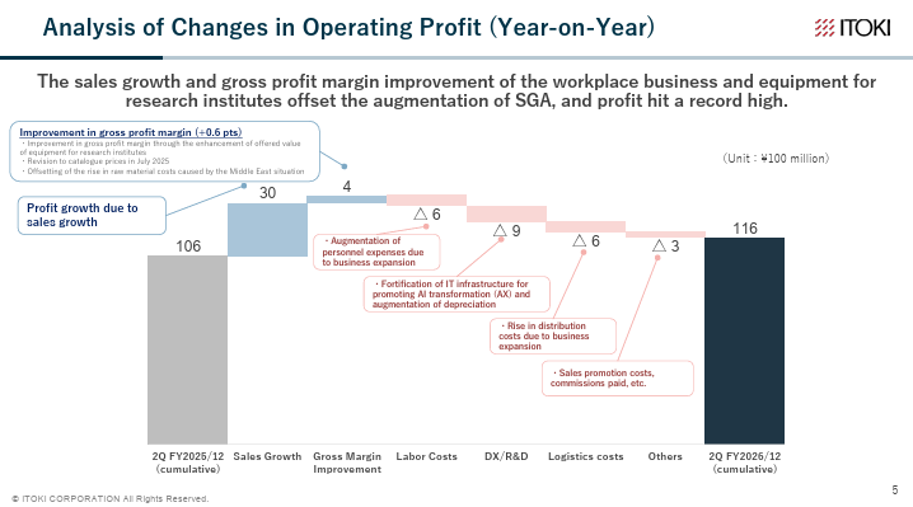
In 2Q (interim) FY12/2026, net sales were 86.3 billion yen (up 8.9% YoY), operating profit was 11.6 billion yen (up 9.5% YoY), and ordinary profit was 11.5 billion yen (up 10.3% YoY). Net profit was 7.7 billion yen (up 11.3% YoY), with the operating profit margin improving further in addition to increases in both revenue and profit. In the Workplace Business, the Company steadily captured renewal projects and regional projects, and value-added offerings in offices based on spatial design proved effective. In the Equipment & Public Works-Related Business, equipment for research facilities performed strongly. The Workplace Business recorded higher revenue but lower profit due to a planned increase in SG&A expenses. In contrast, the Equipment & Public Works-Related Business recorded increases in both revenue and profit, with a further improvement in its profit margin.
Source: Company materials
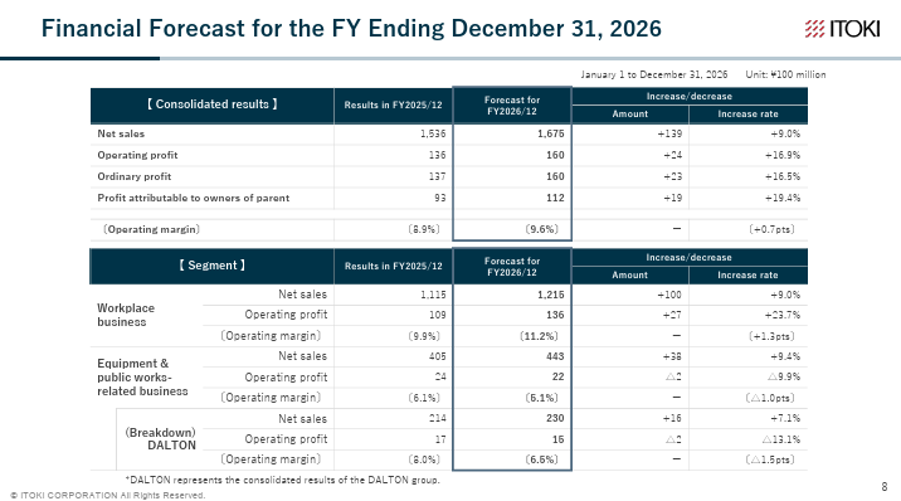
The initial full-year earnings forecast for FY12/2026 remains unchanged. Net sales are forecast at 167.5 billion yen (up 9.0% YoY), operating profit at 16.0 billion yen (up 16.9% YoY), ordinary profit at 16.0 billion yen (up 16.5% YoY), and profit attributable to owners of parent at 11.2 billion yen (up 19.4% YoY), meaning that the Company will aim to exceed the medium-term management plan’s final targets of net sales of 150.0 billion yen, operating profit of 14.0 billion yen, and an operating profit margin of 9%.
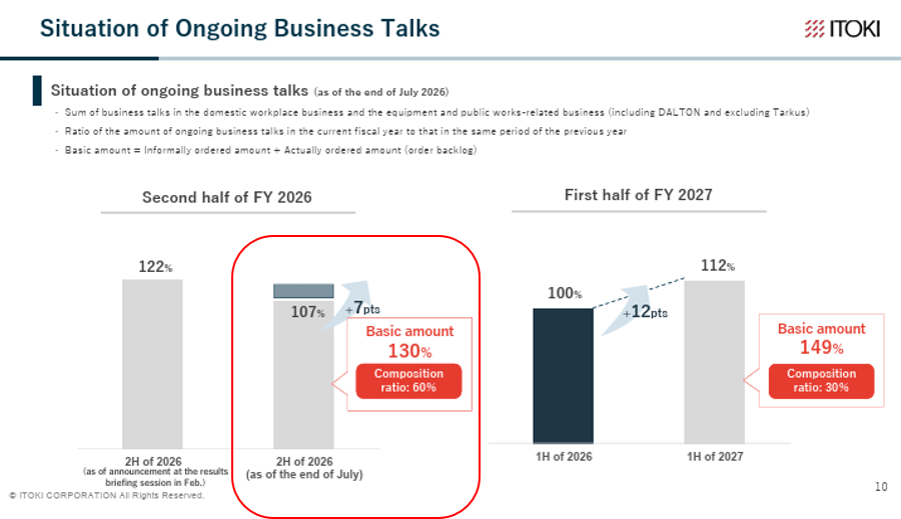
Although the hurdle for the second-half profit forecast may appear high at first glance, confidence in achieving it is considered sufficiently high at present. First, we refined the deal pipeline value for greater accuracy during the first half. As a result, it was up 7% YoY as of the end of July, and additional projects with a high probability of realization are also visible. Therefore, there is little concern about confidence in achieving the net sales forecast. Business talks for the first half of FY2027 are also progressing steadily.
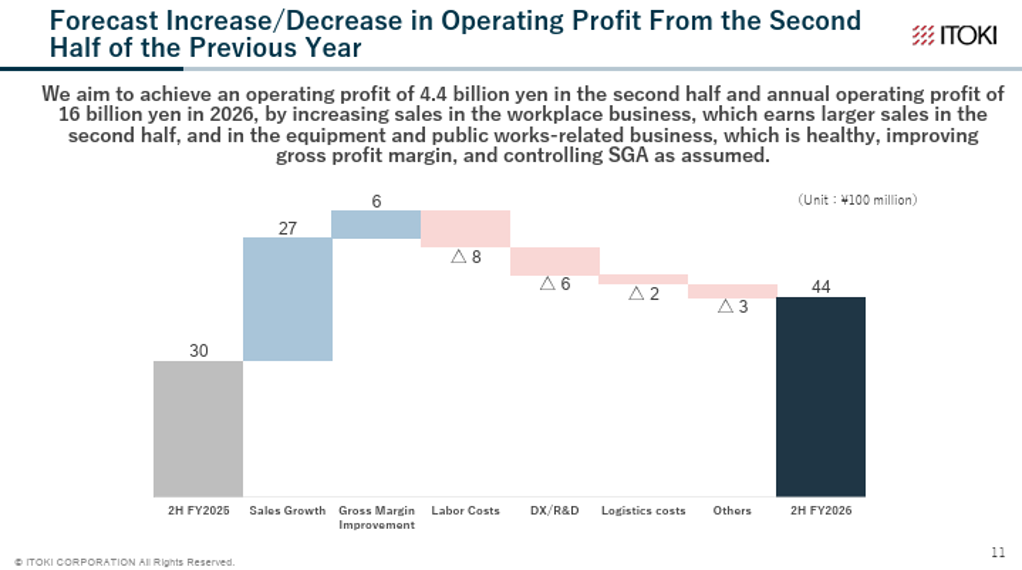
The second-half operating profit forecast is 4.4 billion yen, representing an assumed YoY increase of 1.4 billion yen. Confidence in achieving this is also considered sufficiently high, given the high degree of confidence in achieving the net sales forecast and the effect of higher sales; the implementation of price revisions and price pass-through for temporary increases in raw material prices and other costs; and, with respect to personnel expenses, the running-off of the impact of higher bonus accruals in the same period of the previous year.
Source: Company materials
◇ Share price trends and points of interest: expectations for the next medium-term management plan are rising
The Company’s share price rose from 347 yen at the end of March 2022, when President Minato took office, to 2,565 yen most recently in September 2026, while PBR increased from below 1x to around 2.1x. This was driven by customers increasingly recognizing investment in offices and other facilities as part of investment in human capital and becoming more proactive. At the same time, the Company has steadily captured this demand while raising added value, resulting in continued business expansion in line with the medium-term management plan.
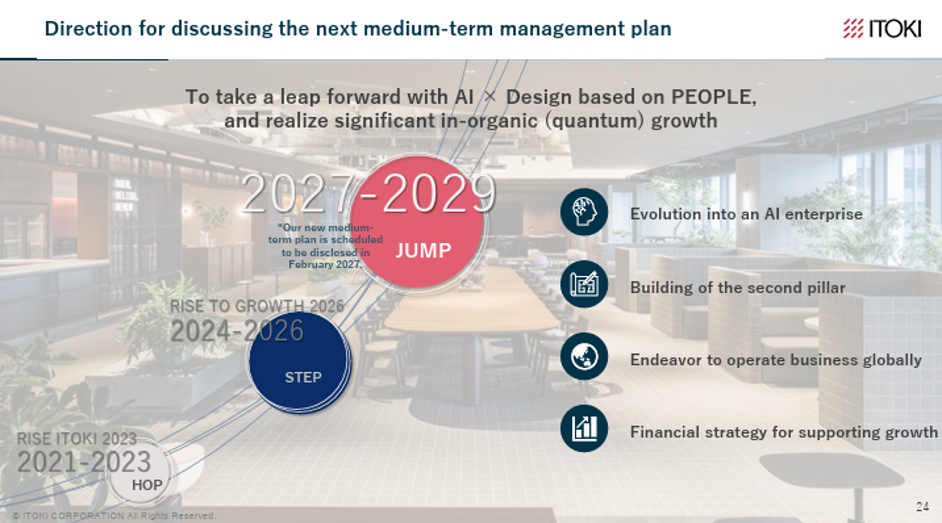
Going forward, in addition to the FY12/2026 results, attention will focus on the next medium-term management plan from FY2027 onward. Multifaceted progress is expected, including completing a business model that supports customers’ productivity improvement by advancing the Office 3.0 domain; thereby further raising profitability and reducing earnings volatility in the Workplace Business; horizontally deploying the successful model of that business to factory offices and research facilities; establishing new earnings bases such as multi-purpose disaster prevention shelter doors and semiconductor cleaning equipment; advancing global expansion; spreading AI-driven management; and improving employee engagement and productivity.
If the Office 3.0 concept is proven and its horizontal deployment and overseas expansion can also be incorporated, it would become appropriate to regard the Company as ‘a partner that continuously improves customers’ workplace productivity.’ At that point, the basis for share price valuation may also need reconsideration. The next medium-term management plan therefore warrants considerable attention.
Source: Company materials
Valuations
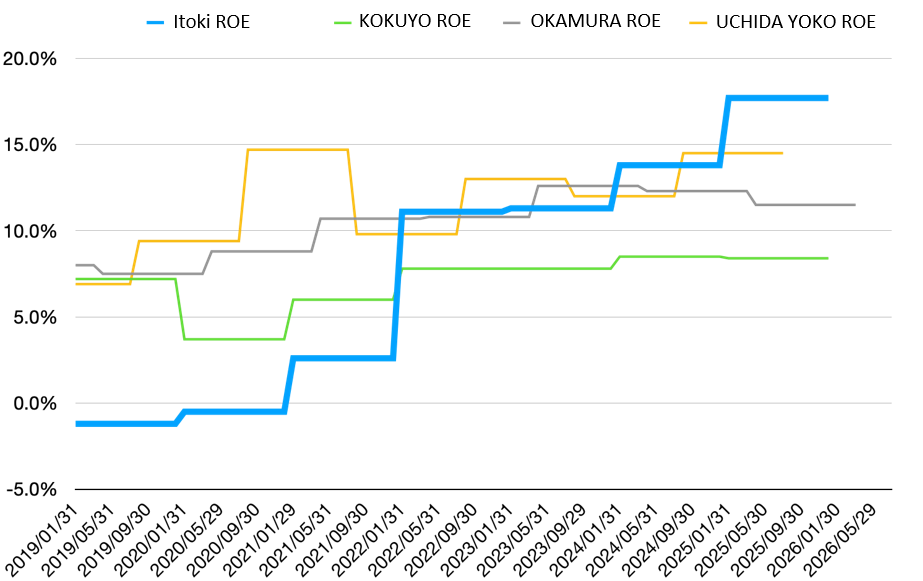
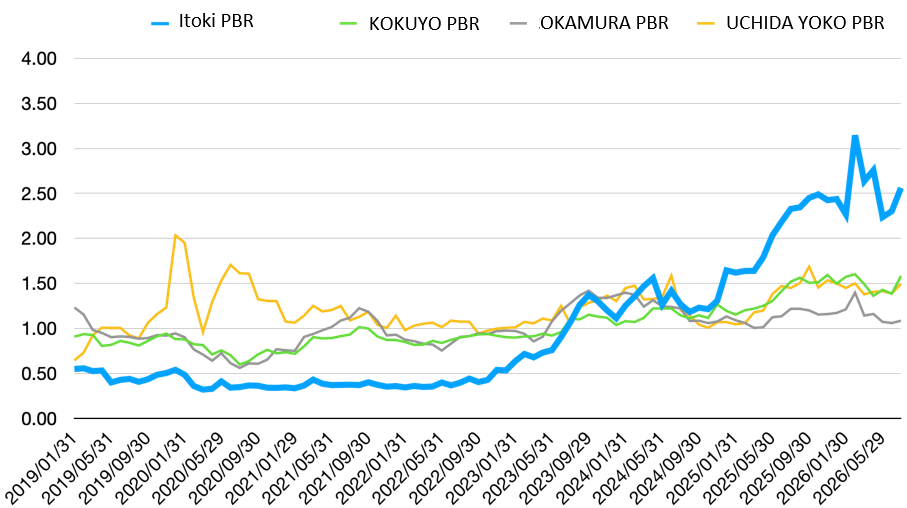
The charts below plot the ROE and PBR trends of the Company and three industry peers over the past seven years.
As shown, the Company’s ROE has now risen to the top among competitors, and its PBR is also the highest. The current share price appears to reflect a strong market valuation of progress under the current medium-term management plan and management’s capabilities, along with its strong focus on shareholder value.
In the new medium-term management plan, attention is likely to focus on the growth strategy and the setting of a new ROE target.
Source: prepared by Omega Investment based on financial data from various companies.
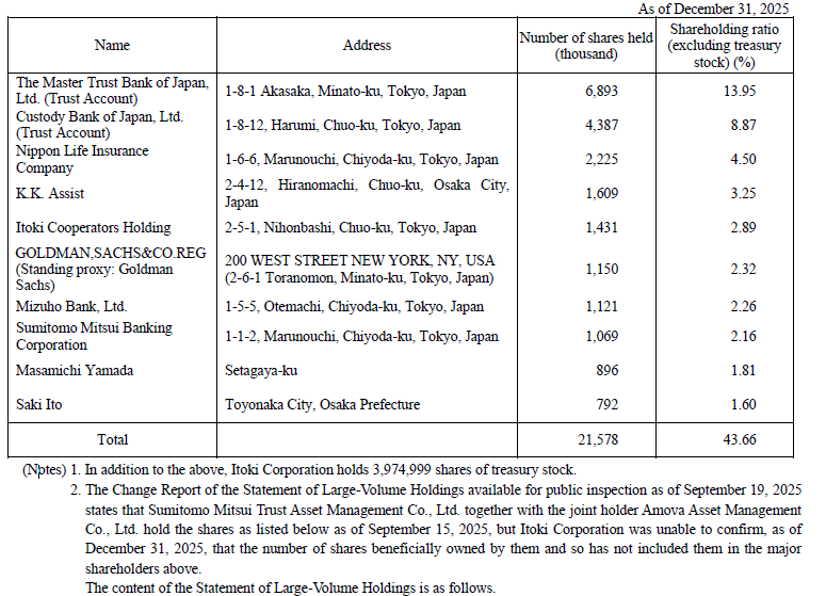
Major shareholders
Source: Annual Securities Report of the Company
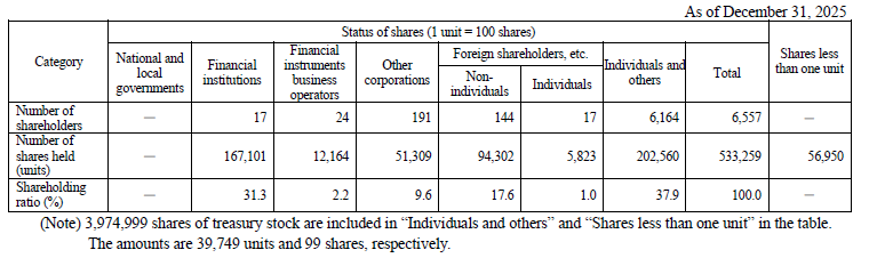
Shareholding by ownership
Source: Annual Securities Report of the Company
Corporate governance and top management
The Company has a board of auditors with eight directors, four of whom are outside directors and designated as independent directors, two full-time auditors, and two part-time auditors (all are independent officers). The Company has also adopted an executive officer system to separate management oversight from business execution.
In addition, in February 2026, the Company established voluntary Nomination and Compensation Committees to strengthen governance further. The Nomination Committee consists of six members, is chaired by an outside director, and has only two internal directors. The Compensation Committee has five members, is chaired by an outside director, and includes only one internal director.
The Board of Directors’ diversity has also improved. Outside directors account for 50% (4 of 8), female directors for 37.5% (3 of 8), outside directors with corporate management experience for 50% (2 of 4), and outside Audit & Supervisory Board Members for 50% (2 of 4), with the ratio of female directors having increased.
The Company’s corporate governance structure
Source: Omega Investment from company materials
List of directors and officers
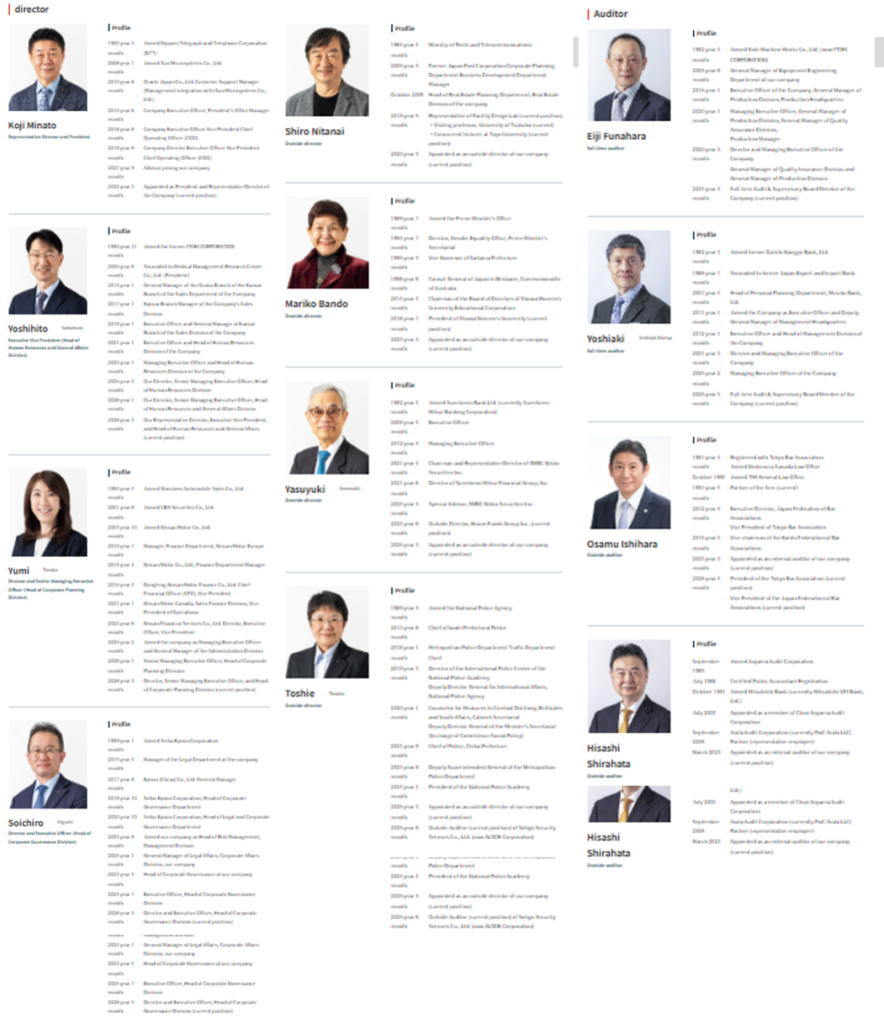
Source: company materials
Skills matrix for directors
Skills matrix for directors and Audit Supervisory Board members
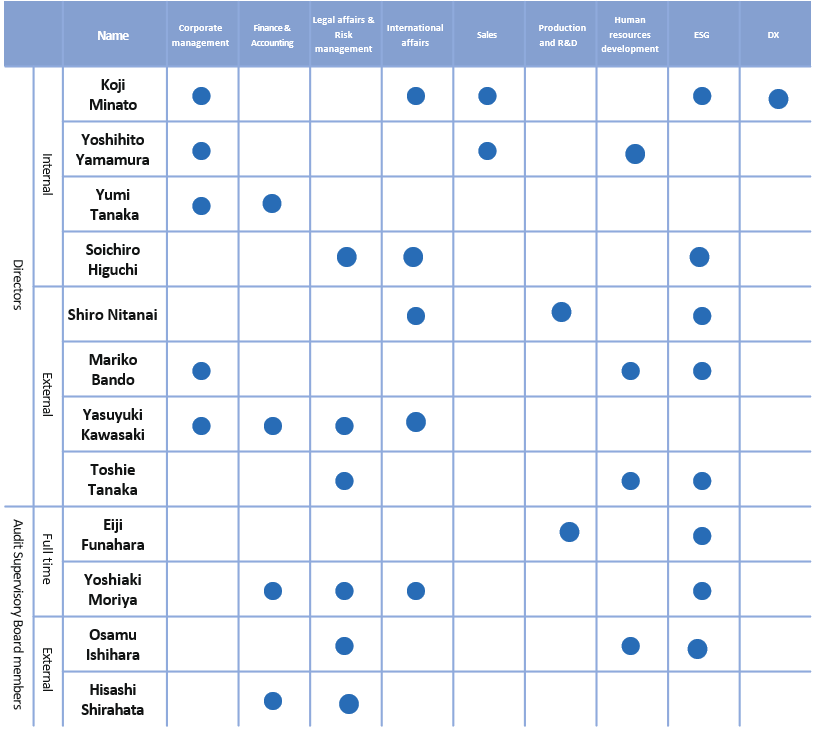
Source: Company materials
Sustainability
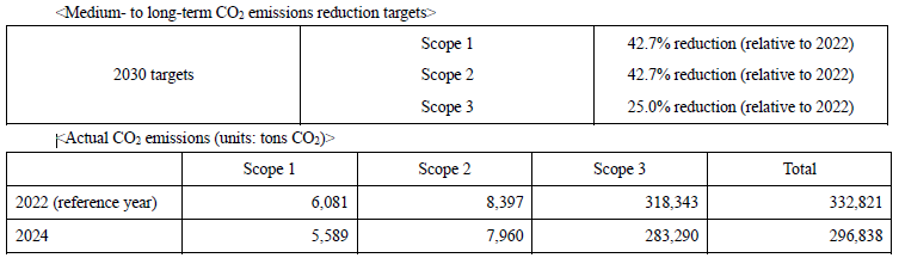
As the Company is a manufacturing company, CO2 emissions are inevitable in office furniture and logistics equipment production. Therefore, the Company is highly aware of the SDGs and ESGs and has prepared an integrated report since 2021. In addition, the ESG DATA BOOK was published in 2022. It details the Company’s evaluation of its materiality, KPI performance and other information.
Particularly noteworthy is that it has developed a medium-term environmental plan regarding the environment, which communicates concrete and quantitative progress for each year. For greenhouse gas emissions, the plan sets out reduction targets not only for Scope 1 and 2 but also for Scope 3. Besides CO2 emissions, the plan also includes quantitative analyses of the introduction of renewable energy, carbon offsets, biodiversity, environmental accounting, etc.
With respect to the SDGs, the Company has defined the following materiality issues, which are linked to its medium-term management plan 7 Flags as well as its ESG strategy.
The Company’s approach to materiality
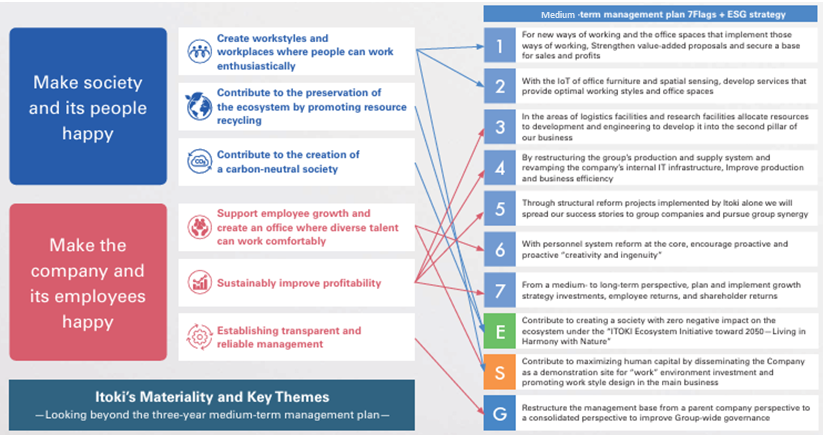
Source: Company materials
Human Capital Strategy
The Company is developing an environment that supports the growth and challenges of each employee, and is promoting a human resource strategy that leverages expertise and diversity. The specific framework and performance indicators are as follows.
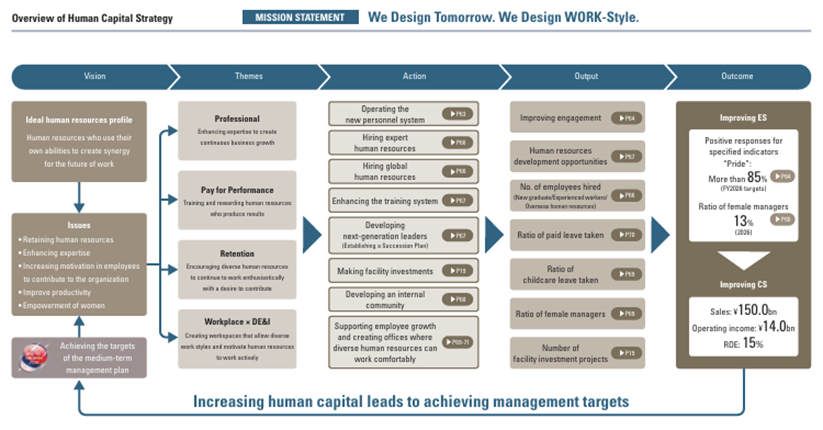
Source: Company materials
Some of the progress is as follows.
First, on reducing CO2 emissions, only data through 2024 have been disclosed so far, and disclosure of 2025 data is awaited.
CO2 emissions
Source: Company materials
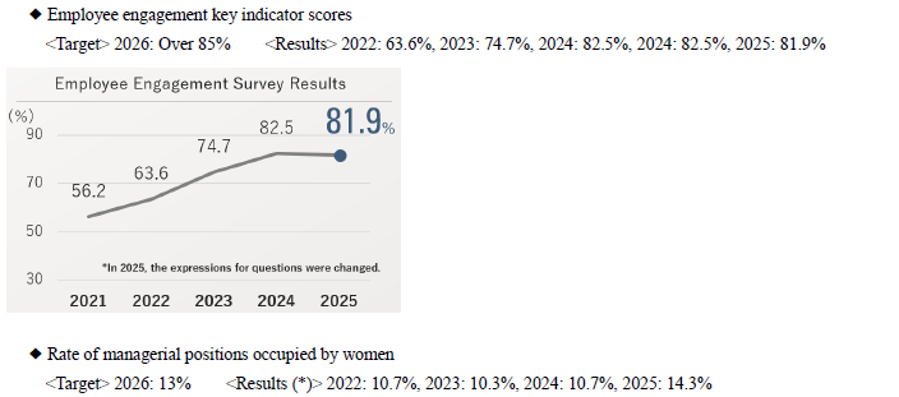
Next, human capital and diversity are progressing steadily against the targets.
Human capital and diversity
Source: Company materials
Financial data (quarterly basis)
| Unit: million yen | 2024/12 | 2025/12 | 2026/12 | ||||||
| 2Q | 3Q | 4Q | 1Q | 2Q | 3Q | 4Q | 1Q | 2Q | |
| (Income Statement) | |||||||||
| Sales | 31,592 | 29,613 | 36,337 | 42,744 | 36,500 | 33,214 | 41,224 | 47,224 | 39,092 |
| Year-on-year | 1.2% | 3.3% | 0.6% | 4.5% | 15.5% | 12.2% | 13.4% | 10.5% | 7.1% |
| Cost of Goods Sold (COGS) | 19,888 | 17,644 | 21,182 | 23,993 | 21,381 | 19,671 | 23,825 | 26,255 | 22,696 |
| Gross Income | 11,704 | 11,969 | 15,155 | 18,751 | 15,119 | 13,543 | 17,399 | 20,969 | 16,396 |
| Gross Income Margin | 37.0% | 40.4% | 41.7% | 43.9% | 41.4% | 40.8% | 42.2% | 44.4% | 41.9% |
| SG&A Expense | 10,878 | 11,029 | 12,883 | 11,328 | 11,915 | 12,556 | 15,327 | 12,879 | 12,852 |
| EBIT (Operating Income) | 826 | 940 | 2,272 | 7,423 | 3,204 | 987 | 2,072 | 8,090 | 3,544 |
| Year-on-year | -62.8% | 428.1% | 69.0% | 22.9% | 287.9% | 5.0% | -8.8% | 9.0% | 10.6% |
| Operating Income Margin | 2.6% | 3.2% | 6.3% | 17.4% | 8.8% | 3.0% | 5.0% | 17.1% | 9.1% |
| EBITDA | 1,582 | 1,684 | 3,166 | 8,189 | 4,055 | 2,373 | 3,236 | 9,193 | 4,657 |
| Pretax Income | 1,328 | 1,035 | 1,702 | 7,257 | 3,208 | 1,132 | 2,502 | 8,063 | 3,342 |
| Consolidated Net Income | 985 | 725 | 1,409 | 4,910 | 2,045 | 711 | 1,734 | 5,537 | 2,215 |
| Minority Interest | 1 | 11 | 25 | -6 | 2 | 10 | 11 | -1 | 5 |
| Net Income ATOP | 985 | 714 | 1,383 | 4,916 | 2,044 | 699 | 1,723 | 5,538 | 2,210 |
| Year-on-year | -30.2% | 253.5% | 38.9% | 19.9% | 107.5% | -2.1% | 24.6% | 12.7% | 8.1% |
| Net Income Margin | 3.1% | 2.4% | 3.8% | 11.5% | 5.6% | 2.1% | 4.2% | 11.7% | 5.7% |
| (Balance Sheet) | |||||||||
| Cash & Short-Term Investments | 28,513 | 30,536 | 22,482 | 24,296 | 25,288 | 21,847 | 21,629 | 21,128 | 22,733 |
| Total assets | 120,701 | 120,935 | 120,521 | 132,329 | 126,248 | 123,538 | 130,724 | 137,216 | 130,144 |
| Total Debt | 41,566 | 42,881 | 37,924 | 44,114 | 41,268 | 37,467 | 35,063 | 42,072 | 36,883 |
| Net Debt | 13,053 | 12,345 | 15,442 | 19,818 | 15,980 | 15,620 | 13,434 | 20,944 | 14,150 |
| Total liabilities | 73,584 | 73,305 | 71,174 | 80,689 | 72,262 | 68,583 | 73,908 | 78,052 | 68,175 |
| Total Shareholders’ Equity | 47,068 | 47,571 | 49,260 | 51,562 | 53,908 | 54,864 | 56,709 | 59,060 | 61,863 |
| (Profitability %) | |||||||||
| ROA | 5.41 | 5.85 | 6.04 | 6.16 | 7.34 | 7.40 | 7.47 | 7.42 | 7.93 |
| ROE | 12.51 | 13.41 | 13.79 | 16.43 | 17.94 | 17.66 | 17.71 | 18.09 | 17.57 |
| (Per-share) Unit: JPY | |||||||||
| EPS | 20.0 | 14.5 | 28.1 | 99.9 | 41.4 | 14.1 | 34.9 | 112.1 | 44.7 |
| BPS | 956.6 | 966.8 | 1,001.1 | 1,047.9 | 1,091.1 | 1,110.4 | 1,147.8 | 1,195.4 | 1,250.5 |
| Dividend per Share | 0.00 | 0.00 | 55.00 | 0.00 | 0.00 | 0.00 | 75.00 | 0.00 | 0.00 |
| Shares Outstanding (million shares) | 53.38 | 53.38 | 53.38 | 53.38 | 53.38 | 53.38 | 53.38 | 53.38 | 53.38 |
Source: Omega Investment
Financial data (full-year basis)
| Unit: million yen | 2016 | 2017 | 2018 | 2019 | 2020 | 2021 | 2022 | 2023 | 2024 | 2025 |
| (Income Statement) | ||||||||||
| Sales | 101,684 | 108,684 | 118,700 | 122,174 | 116,210 | 115,905 | 123,324 | 132,985 | 138,460 | 153,682 |
| Year-on-year | -4.5% | 6.9% | 9.2% | 2.9% | -4.9% | -0.3% | 6.4% | 7.8% | 4.1% | 11.0% |
| Cost of Goods Sold | 65,071 | 70,012 | 77,479 | 80,712 | 74,536 | 74,186 | 77,575 | 80,744 | 83,259 | 88,870 |
| Gross Income | 36,613 | 38,672 | 41,221 | 41,462 | 41,674 | 41,719 | 45,749 | 52,241 | 55,201 | 64,812 |
| Gross Income Margin | 36.0% | 35.6% | 34.7% | 33.9% | 35.9% | 36.0% | 37.1% | 39.3% | 39.9% | 42.2% |
| SG&A Expense | 33,862 | 35,761 | 39,336 | 40,776 | 40,089 | 39,158 | 41,167 | 43,717 | 45,123 | 51,126 |
| EBIT (Operating Income) | 2,751 | 2,911 | 1,885 | 686 | 1,585 | 2,561 | 4,582 | 8,524 | 10,078 | 13,686 |
| Year-on-year | -33.6% | 5.8% | -35.2% | -63.6% | 131.0% | 61.6% | 78.9% | 86.0% | 18.2% | 35.8% |
| Operating Income Margin | 2.7% | 2.7% | 1.6% | 0.6% | 1.4% | 2.2% | 3.7% | 6.4% | 7.3% | 8.9% |
| EBITDA | 5,316 | 5,551 | 4,615 | 4,436 | 5,603 | 6,148 | 7,821 | 11,417 | 13,185 | 17,853 |
| Pretax Income | 2,918 | 3,401 | 3,083 | 938 | 1,277 | 1,523 | 8,372 | 8,378 | 10,071 | 14,099 |
| Consolidated Net Income | 1,850 | 2,442 | 1,744 | -579 | -355 | 933 | 5,181 | 5,907 | 7,223 | 9,400 |
| Minority Interest | -56 | 40 | 19 | -28 | -119 | -233 | -113 | 1 | 39 | 17 |
| Net Income ATOP | 1,907 | 2,402 | 1,725 | -550 | -235 | 1,166 | 5,294 | 5,905 | 7,183 | 9,382 |
| Year-on-year | -57.9% | 26.0% | -28.2% | -131.9% | -57.3% | -596.2% | 354.0% | 11.5% | 21.6% | 30.6% |
| Net Income Margin | 1.9% | 2.2% | 1.5% | -0.5% | -0.2% | 1.0% | 4.3% | 4.4% | 5.2% | 6.1% |
| (Balance Sheet) | ||||||||||
| Cash & Short-Term Investments | 19,839 | 19,977 | 16,529 | 17,030 | 18,246 | 17,451 | 26,976 | 24,795 | 22,482 | 21,629 |
| Total assets | 95,681 | 102,451 | 108,710 | 108,778 | 105,096 | 103,898 | 115,288 | 117,437 | 120,521 | 130,724 |
| Total Debt | 19,931 | 17,892 | 16,834 | 22,166 | 21,742 | 20,091 | 19,487 | 17,308 | 37,924 | 34,627 |
| Net Debt | 92 | -2,085 | 305 | 5,136 | 3,496 | 2,640 | -7,489 | -7,487 | 15,442 | 12,998 |
| Total liabilities | 50,275 | 54,997 | 61,200 | 62,940 | 60,901 | 58,818 | 65,374 | 62,434 | 71,174 | 73,908 |
| Total Shareholders’ Equity | 44,949 | 46,863 | 46,857 | 45,370 | 43,812 | 44,931 | 49,871 | 54,960 | 49,260 | 56,709 |
| (Cash Flow) | ||||||||||
| Net Operating Cash Flow | 5,072 | 3,565 | 1,384 | 3,586 | 4,561 | 2,774 | 5,804 | 6,321 | -1,000 | 8,942 |
| Capital Expenditure | 1,641 | 1,333 | 3,477 | 3,226 | 1,729 | 2,110 | 4,145 | 3,316 | 6,036 | 6,017 |
| Net Investing Cash Flow | -4,044 | -2,971 | -3,094 | -3,221 | -1,152 | -1,170 | 4,923 | -4,012 | -7,107 | -3,847 |
| Net Financing Cash Flow | -2,571 | -706 | -2,463 | 0 | -2,267 | -2,658 | -1,426 | -4,148 | 5,905 | -5,941 |
| Free Cash Flow | 3,663 | 2,342 | -1,924 | 635 | 2,832 | 664 | 1,659 | 3,005 | -4,146 | 5,193 |
| (Profitability ) | ||||||||||
| ROA (%) | 1.97 | 2.42 | 1.63 | -0.51 | -0.22 | 1.12 | 4.83 | 5.08 | 6.04 | 7.47 |
| ROE (%) | 4.21 | 5.23 | 3.68 | -1.19 | -0.53 | 2.63 | 11.17 | 11.27 | 13.79 | 17.71 |
| Net Margin (%) | 1.87 | 2.21 | 1.45 | -0.45 | -0.20 | 1.01 | 4.29 | 4.44 | 5.19 | 6.11 |
| Asset Turn | 1.05 | 1.10 | 1.12 | 1.12 | 1.09 | 1.11 | 1.13 | 1.14 | 1.16 | 1.22 |
| Assets/Equity | 2.14 | 2.16 | 2.25 | 2.36 | 2.40 | 2.36 | 2.31 | 2.22 | 2.28 | 2.37 |
| (Per-share) Unit: JPY | ||||||||||
| EPS | 40.1 | 52.7 | 37.8 | -12.1 | -5.2 | 25.8 | 117.0 | 130.3 | 147.0 | 190.2 |
| BPS | 986.8 | 1,028.9 | 1,027.4 | 995.8 | 970.4 | 993.9 | 1,101.3 | 1,212.0 | 1,001.1 | 1,147.8 |
| Dividend per Share | 13.00 | 13.00 | 13.00 | 13.00 | 13.00 | 15.00 | 37.00 | 42.00 | 55.00 | 75.00 |
| Shares Outstanding (million shares) | 52.14 | 52.14 | 45.61 | 45.66 | 45.66 | 45.66 | 45.66 | 45.66 | 53.38 | 53.38 |
Source: Omega Investment