2026-10-23
Home
Japanese

Omega Investment Co., Ltd.
KENKO Mayonnaise (Investment report – Basic)
| Share price (10/13) | ¥2,016 | Dividend Yield (27/3 CE) | 3.5 % |
| 52weeks high/low | ¥2,365/1,803 | ROE(26/3 act) | 7.2 % |
| Avg Vol (3 month) | 32.6 thou shrs | Operating margin (26/3 act) | 4.5 % |
| Market Cap | ¥33.22 bn | Beta (5Y Monthly) | 0.03 |
| Enterprise Value | ¥20.46 bn | Shares Outstanding | 16.476 mn shrs |
| PER (27/3 CE) | 10.2 X | Listed market | TSE Prime |
| PBR (26/3 act) | 0.7 X |
| Click here for the PDF version of this page |
| PDF version |
A stage to focus on earnings improvement potential and share price undervaluation, backed by stable earnings.
Investment conclusion
The Company’s shares should be positioned as a stock to be evaluated over a medium- to long-term horizon, given its stable demand base in the domestic commercial-use food market and potential improvements in profit margins and capital allocation. At the current share price of 2,033 yen, the forecast PER is 10.3 times, the actual PBR is 0.70 times, the equity yield based on forecast EPS is 9.7%, and the forecast dividend yield is 3.4%. FY 3/2027 is planned as a year of higher sales and lower profit, and the burden of raw material prices and fixed costs remains. Therefore, looking only at short-term profit growth, this is not a strong phase. However, the share price valuation is low relative to the business’s stability, and we believe it does not fully reflect a re-rating if profit margins and capital efficiency improve. The current share price is attractive as a medium- to long-term investment candidate, assuming improvements in the earnings structure continue.
This view is based on the stability of the domestic business, which supports long-term sales. After its establishment in 1958, the Company began manufacturing and selling KENKO Mayonnaise AS, a mayonnaise for commercial-use salads, in 1961, and in 1977 it launched Long-life salads, salads that can be stored refrigerated and kept for extended periods, ahead of the industry. Since then, building on Mayonnaise and Dressings, it has expanded into Processed Egg products and then into Salads and Delicatessen, including potato salad. Its current earnings base is centered on Japan, and the Company supplies products to a broad range of customers, including restaurants, mass retailers, convenience stores, bread, and school lunches. Through long-standing business relationships, customers have incorporated the quality, taste, shelf life, and ease of use of its commercial-use products into their menus and cooking processes. We believe this has built a business base where demand is unlikely to fall significantly due to economic cycles alone.
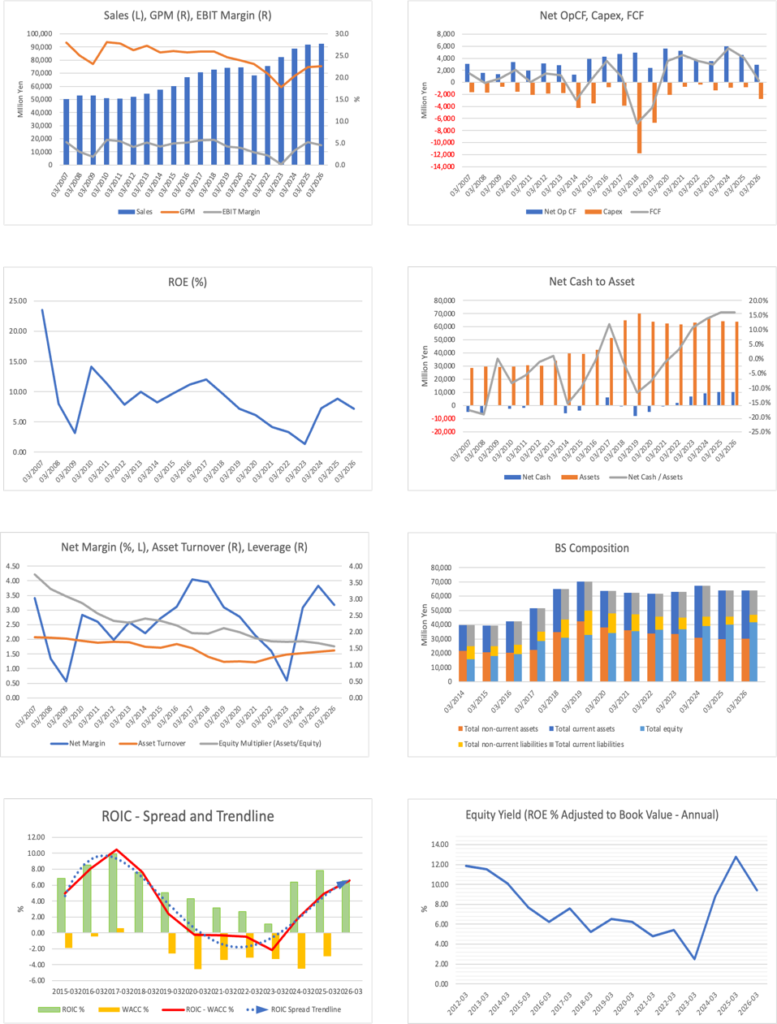
Long-term performance also supports this view. Net sales have expanded from 68.502 billion yen in FY 3/2021, which was affected by the COVID-19 pandemic, to 75.647 billion yen in FY 3/2022, 82.363 billion yen in FY 3/2023, 88.724 billion yen in FY 3/2024, 91.703 billion yen in FY 3/2025, and 92.354 billion yen in FY 3/2026. Even amid headwinds such as declining restaurant demand, rising egg prices, and higher logistics and personnel costs, net sales have recovered and expanded over the long term. Although Japan’s population decline is a long-term constraint, demand for labor savings, simplified cooking processes, and standardized quality in ready-made meals and restaurants is likely to continue. The Company’s potato salad for commercial use, mayonnaise, dressings, sauces, and Processed Egg products align well with this demand, and domestic sales are likely to be viewed as stable growth rather than rapid growth going forward.
The Company’s long-term issue is not whether it can maintain sales, but how far it can convert stable sales into profit and cash. In FY 3/2026, net sales were 92.354 billion yen, operating profit was 4.155 billion yen, and profit attributable to owners of parent was 2.926 billion yen. Net sales increased 0.7% YoY, but operating profit declined 14.3%. According to the factors behind changes in operating profit presented by the Company, price increases were a positive factor of 2.718 billion yen. By comparison, raw material impact was a negative factor of 1.979 billion yen, fixed costs, etc. were a negative factor of 652 million yen, sales volume was a negative factor of 463 million yen, and logistics costs were a negative factor of 358 million yen. We view this as a phase in which price pass-through and profitability correction were still catching up with higher raw material costs and upfront expenses, rather than demand collapsing. Likewise, the past decline in profit margins was influenced more by raw material prices, time lags in price increases, production efficiency, and fixed costs than by weakness in domestic demand.
In 1Q FY 3/2027, net sales were 23.323 billion yen, up 2.9% YoY, marking a record high for a first quarter. Operating profit was 726 million yen, down 4.7%, but the core Seasoning and Processed Foods Business recorded net sales of 18.892 billion yen, up 4.5%, and segment profit of 545 million yen, up 6.8%. Salads and Delicatessen, Mayonnaise and Dressings, and Processed Egg products all posted higher sales, and price increases and improved production efficiency through factory restructuring supported profit. In contrast, the Delicatessen-related Business recorded lower sales and lower profit. Looking only at companywide profit, improvement is still in progress, but the return to higher sales and higher profit in the mainstay business, which is the core of profit, is an important change in assessing medium- to long-term earnings stability.
Through the review of its Medium- to Long-Term Management Plan, KENKO Vision 2035, the Company has set out a transition to a Global Food Solution Company. It has outlined sales expansion in existing businesses through customer-in and co-creation, an increase in the overseas sales ratio, a shift from DX to BX, an IT strategy, and a transition to cash-based management. The FY 2035 consolidated net sales target of 200.0 billion yen is a major target, but in the investment conclusion, based on the stability of the domestic business, we would like to focus on whether the Company can consistently achieve the Phase 1 targets of an EBITDA margin of 7.0% or more and ROIC of 6.0% or more. Because the domestic earnings base is unlikely to collapse significantly, improving profit margins through factory restructuring, IT investment, overseas expansion, and a review of the business portfolio is likely to increase corporate value.
Financial factors also support medium- to long-term investment. At the end of 1Q FY 3/2027, cash and deposits were 12.489 billion yen and interest-bearing debt was 3.163 billion yen, resulting in net cash of 9.326 billion yen. Against a market capitalization of approximately 33.499 billion yen calculated from the share price of 2,033 yen and shares outstanding of 16.476 million shares, net cash is equivalent to approximately 27.8%. The forecast PER after net cash adjustment is 7.4 times, and the multiple attached to business earnings is low. The Company has adopted DOE as an indicator for shareholder returns and incorporated ROIC and cash-based management into its management plan. If it can allocate cash generated by its stable domestic business to growth investments and returns, a review of PBR could become a source of returns in addition to profit growth.
The share price has somewhat lagged TOPIX year to date. We believe the background is that expectations for a recovery in short-term profit receded after expectations for improvement in capital efficiency rose following the review of the Medium- to Long-Term Management Plan in February 2026, because FY 3/2026 resulted in a decline in operating profit and FY 3/2027 was also planned as a year of lower operating profit of 4.0 billion yen. Cost fluctuations in eggs, potatoes, edible oils, packaging materials, and other items are also restraining the share price valuation. However, given stable domestic sales, core-business profit growth in 1Q, net cash, and a return policy centered on DOE, the current PER of 10.3 times, PBR of 0.70 times, and equity yield of 9.7% reflect a cautious valuation. As investment funds broaden into small- and mid-cap stocks, the Company may be favored as an undervalued stock, supported by improving profit margins and progress in capital policy.
Based on the above, our investment conclusion this time is that, at the current share price level, the Company can be actively considered as a medium- to long-term investment candidate. Over a one- to two-year horizon, we believe the share price will be influenced by the bottoming of the operating margin in FY 3/2027, continued profit growth in the Seasoning and Processed Foods Business, improved effects of price increases and raw material impact, and execution of capital allocation, including DOE. Over a three- to four-year horizon, the focus will be on whether the Company can move from Phase 1 to Phase 2 of KENKO Vision 2035 while maintaining a stable domestic earnings base, and raise ROIC and the EBITDA margin. Renewed increases in raw material prices and weakness in the Delicatessen-related Business remain downside risks, but the current share price factors these in to a reasonable extent. Rather than evaluating the stock only after confirming earnings improvement, we believe the current stage is significant for medium- to long-term investment, as profit margins and capital efficiency can improve based on stable domestic demand.
| Indicator | Current value | Investor view |
| Share price | 2,033 yen | Current valuation benchmark |
| Forecast PER | 10.3 times | Expectations for profit growth are not high |
| Actual PBR | 0.70 times | Below 1.0 times; the market is cautious about improvement in capital efficiency |
| Forecast ROE | 6.8% | Not extremely low profitability, but room for improvement remains |
| Forecast dividend | 70 yen | Dividend yield is 3.4% |
| Equity yield | 9.7% | Indicates the attractiveness of the share price level |
| Net cash-adjusted PER | 7.4 times | One level lower on a business value basis |
Source: Prepared based on Company materials, FactSet, and user-designated share price-related indicators
1. Business structure and competitiveness centered on commercial-use foods
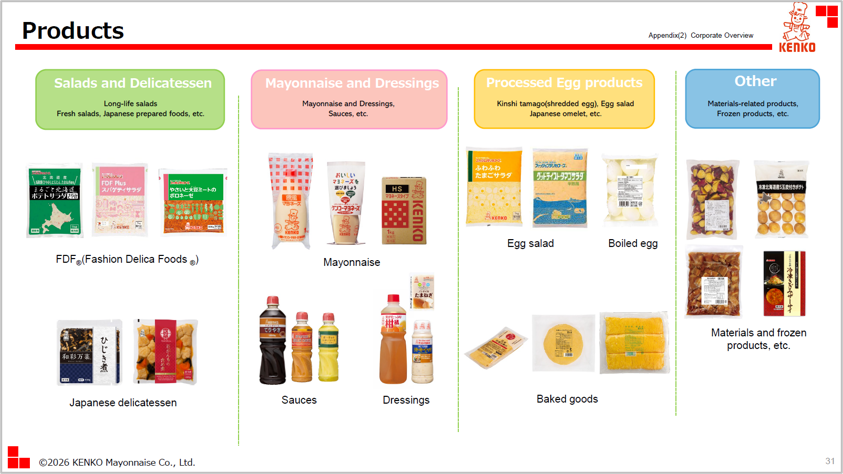
Although the Company has mayonnaise in its name, it should be viewed as a food manufacturer that combines commercial-use salads and delicatessen, Mayonnaise and Dressings, and Processed Egg products. The Company organizes the Group’s functions into KENKO Mayonnaise’s manufacturing function, the consolidated subsidiaries’ delicatessen function, and Salad Cafe’s shop and web functions. The manufacturing function develops and manufactures long-life salads, seasonings, and Processed Egg products, and develops menus and recipes. The delicatessen function is responsible for manufacturing fresh delicatessen and developing menus, while Salad Cafe collects and disseminates information from points of contact with consumers. The Company’s business structure is characterized by not merely manufacturing and wholesaling products, but by entering the menus and operations used at customer sites such as restaurants, ready-made meals, mass retailers, convenience stores, bread, and school lunches.
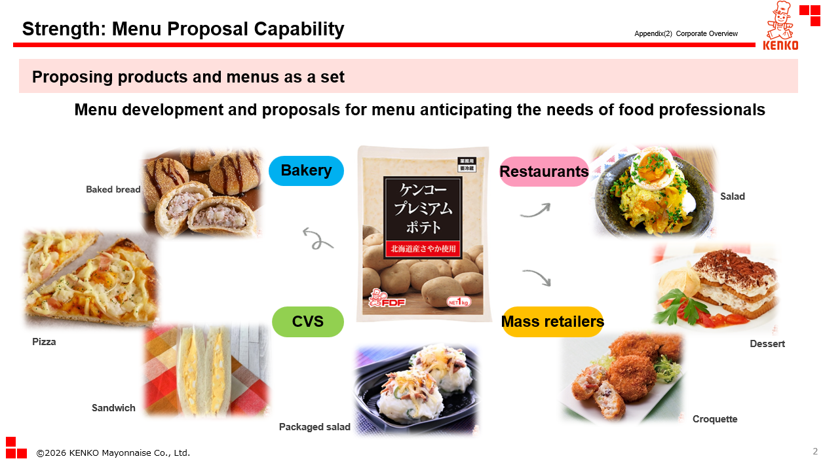
The Company’s vision of Aim to be the world’s leading salad company does not simply mean market share in vegetable salads. The Company has expanded by reducing the burden of customers’ menu development and cooking processes, combining long-life salad development with commercial-use products such as potato salad and burdock salad, mayonnaise, dressings, sauces, and Processed Egg products. Company materials specifically show final applications such as sandwich fillings for convenience stores, tamago-yaki for lunch boxes, egg-free mayonnaise-type products for school lunches, small-pack mayonnaise, mayonnaise and salad fillings for baking for bread, and potato salad, sauces, and scrambled eggs for restaurants. For investors, the key point is that this breadth of applications leads to a demand structure that is not overly dependent on a single sales channel.
We believe the Company’s competitiveness lies less in the brand power of a single product than in its ability to design product specifications, volume, taste, shelf life, and cooking processes to match customers’ sites and, in addition, to propose menus and recipes. In the commercial-use market, customers make adoption decisions based not only on product unit prices but also on cooking time, disposal losses, staffing, and quality stability. Long-life salads and Processed Egg products can reduce customer-side preparation and standardize quality. In addition to product characteristics, the Company also proposes menus and recipes that match customer needs and has strengths in providing services close to customers. This value supports continued transactions even during price increases. Net sales increased even after price increases in FY 3/2026 and 1Q FY 3/2027, indicating not only that sales value increased because of price hikes, but also that demand for mayonnaise, sauces, potato salad, Processed Egg products, and other products for restaurants has been maintained.
On the other hand, as a commercial-use food manufacturer, the Company tends to experience a time lag in passing through higher raw material costs. Because the Company emphasizes continuous transactions with customers, increases in egg, edible oil, vegetable, packaging, and logistics costs cannot always be reflected immediately in selling prices. This business characteristic also contributed to the past decline in profit margins. In response, the Company is seeking to add value beyond price and productivity through customer-in, co-creation, product consolidation, factory restructuring, BX, and IT strategy. Therefore, sales alone do not indicate future competitiveness. We need to look at sales volume after price increases, gross profit margin, production efficiency, sales by customer channel, and product mix together.
Source: Company materials
2. Earnings structure by business and role in corporate value
Seasoning and Processed Foods Business: Core driver of profit growth
In FY 3/2026, the Seasoning and Processed Foods Business recorded net sales of 73.434 billion yen, up 2.2% YoY, and segment profit of 3.094 billion yen, down 20.6%. Sales volume accounts for approximately 80% of consolidated net sales, and this business is the center of corporate value formation. By breakdown, Salads and Delicatessen were 21.324 billion yen, Mayonnaise and Dressings were 28.478 billion yen, and Processed Egg products were 21.807 billion yen. In FY 3/2026, Mayonnaise and Dressings grew the most, up 4.1%, while persistently high egg market prices and a timing gap in price increases weighed on profit. The current situation, in which sales of the mainstay business are growing, but profit is declining, has been one of the main factors suppressing the Company’s share price valuation.
In 1Q FY 3/2027, net sales of the same business were 18.892 billion yen, up 4.5%, and segment profit was 545 million yen, up 6.8%. Salads and Delicatessen were 5.365 billion yen, up 3.1%; Mayonnaise and Dressings were 7.262 billion yen, up 5.3%; and Processed Egg products were 5.818 billion yen, up 4.8%. The major categories all posted higher sales. The Company cited increases in potato salad for restaurants, 10 kg and 1 kg formats of mayonnaise for bread and restaurants, sauces for restaurants, egg salad, boiled eggs, and scrambled eggs. The important point is that both price increases and sales volume are working.
By category, the role in corporate value can be organized as follows: Mayonnaise and Dressings is a business that confirms pricing power and restaurant demand; Salads and Delicatessen is a business that captures product development capabilities and customers’ labor-saving needs; and Processed Egg products is a business with stable demand that is affected by fluctuations in egg prices. To raise share price valuation, the company needs not only sales growth across the three categories but also an upturn in segment profit margins after absorbing higher raw material prices. The 1Q profit increase may mark the start of this process, but quarterly progress must be monitored to confirm it on a full-year basis.
Delicatessen-related Business: An area where profitability, rather than volume, should be assessed
The Delicatessen-related Business centers on fresh delicatessen products manufactured by consolidated subsidiaries. In FY 3/2026, net sales decreased 4.1% to 18.180 billion yen, while segment profit increased 16.4% to 1.004 billion yen. While sales declined due to factors such as in-house production by customers, expansion of product categories, development of high-value-added products, and price increases supported profit. Securing profit by improving profitability rather than pursuing sales growth is commendable from the perspective of improving the Company’s business portfolio.
However, in 1Q FY 3/2027, net sales decreased 2.7% to 4.279 billion yen, and segment profit decreased 36.9% to 156 million yen. This was a main factor behind the decline in companywide profit, and it cannot yet be said that the profitability improvement seen in FY 3/2026 has stabilized. Key KPIs are not only sales volume, but also the impact of in-house production by customers, the composition of high-value-added products, price increases, factory utilization rates, and production efficiency, including disposal and yields. If this business can reduce profit volatility going forward, growth in the core Seasoning and Processed Foods Business will be more easily translated into companywide profit.
Quarterly sales and profit by division: Following earnings recovery in the core business
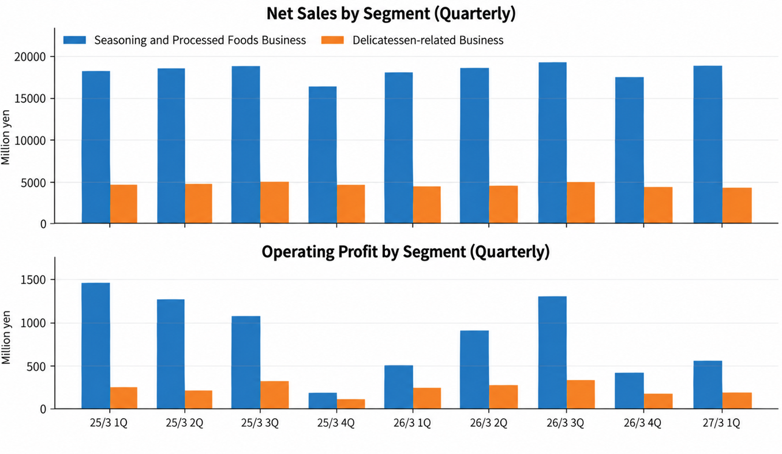
In quarterly trends, net sales in the Seasoning and Processed Foods Business have been generally stable from the high 18 billion yen range to around 19 billion yen since FY 3/2025. Meanwhile, profit has fluctuated significantly due to raw material prices and timing gaps in price increases. In FY 3/2025, profit improved significantly due to price increases and a recovery in demand for Processed Egg products, but in FY 3/2026, profit was again pressured by persistently high egg market prices and increases in vegetable prices, logistics costs, and personnel expenses. In 1Q FY 3/2027, net sales of the same business were 18.892 billion yen, and profit was 545 million yen, exceeding 511 million yen in the same period of the previous year. In the Delicatessen-related Business, net sales have remained in the mid-4 billion yen range, while profit volatility is relatively large. Tracking quarterly trends by division makes it easier to confirm both the stability of consolidated sales and whether profit-margin improvement is becoming established in the core business.
3. FY 3/2026 and 1Q FY 3/2027: Current stage of profit margin rebuilding
For long-term performance, the key point in evaluating the Company is the change in profit margins rather than sales growth. Net sales expanded from 70.812 billion yen in FY 3/2017 to 92.354 billion yen in FY 3/2026. Meanwhile, the margin of profit attributable to owners of parent gradually declined from around 4.0% in FY 3/2017 to around 0.6% in FY 3/2023. It then recovered to 3.1% in FY 3/2024 and 3.8% in FY 3/2025, and was 3.2% in FY 3/2026. It is more accurate to view the Company not as one whose demand scale has shrunk, but as one whose profit margins have fluctuated significantly due to price pass-through, raw materials, production efficiency, and fixed costs.
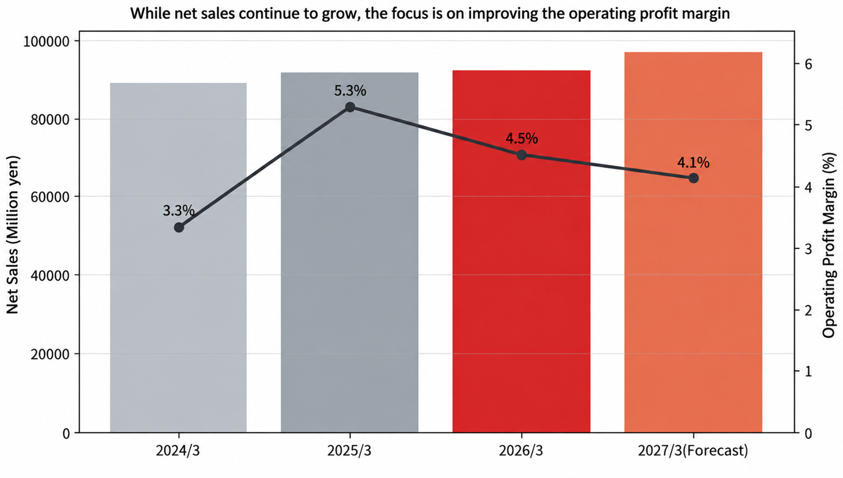
The gross profit margin in FY 3/2026 was 22.6%, slightly improving from 22.4% in the previous fiscal year, but the SG&A ratio rose from 17.1% to 18.1%, and the operating margin declined from 5.3% to 4.5%. Despite the major positive effect of 2.718 billion yen from price increases, the negative impacts of ingredients such as eggs and vegetables (1.979 billion yen), logistics costs (358 million yen), sales volume (463 million yen), and fixed costs (652 million yen) overlapped. The fact that the gross profit margin did not collapse is important, but improvement in the cost structure, including SG&A expenses and fixed costs, is necessary. Even excluding temporary expenses such as the relocation of Tokyo Headquarters, management must absorb increases in facilities, personnel expenses, and logistics costs through product prices and productivity.
The gross profit margin in 1Q was 21.8%, up from 21.6% in the same period last year, but the SG&A ratio rose to 18.7% from 18.2% in the same period last year, and the operating margin declined to 3.1%. Among the factors behind changes in operating profit, the Company indicated that price increases were a positive factor of 1.115 billion yen. In comparison, sales volume of 101 million yen, production efficiency of 230 million yen, logistics cost of 37 million yen, ingredient impact of 594 million yen, and fixed costs, etc., of 189 million yen were negative factors. Ingredient impact included the effects of a poor potato crop, edible oils, and packaging materials due to the Middle East situation, and the impact of the Middle East situation and other factors was 621 million yen. Despite the heavy burden of external costs, the decline in operating profit was limited to 35 million yen, indicating that price increases helped defend profit.
The Company’s plan for this fiscal year is net sales of 97.0 billion yen, up 5.0% YoY, operating profit of 4.0 billion yen, down 3.7%, and profit attributable to owners of parent of 2.84 billion yen, down 3.0%. The sales plan calls for increases in each category of the Seasoning and Processed Foods Business, including Salads and Delicatessen of 23.152 billion yen, Mayonnaise and Dressings of 29.466 billion yen, and Processed Egg products of 23.669 billion yen. In comparison, the Delicatessen-related Business is planned to be largely flat at 18.160 billion yen. The Company identifies sales-volume recovery through customer-in, promotional activities, price increases, and cost management as key points of the plan. This is not a plan to sharply increase short-term profit, but to build sales while continuing to rebuild the earnings structure.
Upside factors to the Company plan are that the effects of price increases become established earlier than expected, market conditions for eggs, edible oils, and packaging materials calm down, efficiency from factory restructuring such as integration into the Shizuoka Fujisan Factory exceeds deterioration in yields, and sales volume increases for mayonnaise, sauces, and potato salad for restaurants. Downside factors are a prolonged poor potato crop, renewed increases in eggs and edible oils, higher packaging material prices, delays in price increases, a decline in sales in the Delicatessen-related Business, and increases in fixed costs such as rent and personnel expenses after the relocation of Tokyo Headquarters and the product development and quality divisions in September. Because the Company plan takes a cautious view of these cost burdens, it should not be necessary to base the investment conclusion on a more adverse scenario at this point.
Source: Prepared based on FactSet and Company plan
4. KENKO Vision 2035: Transition to a Global Food Solution Company
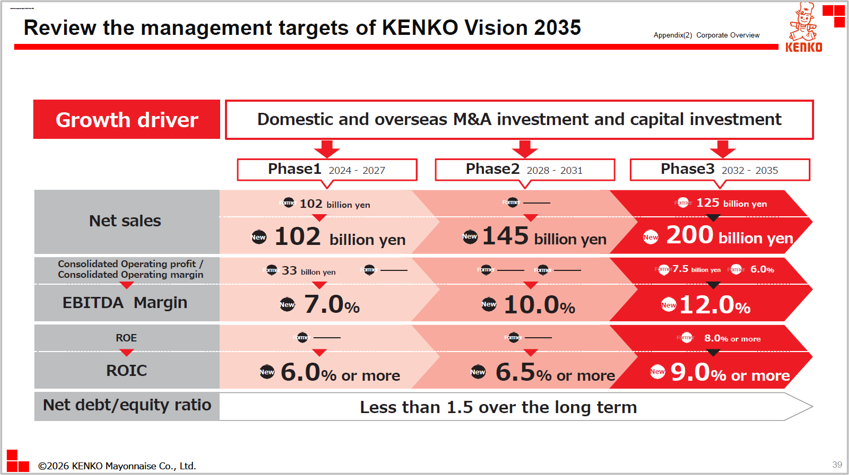
The Company divides its Medium- to Long-Term Management Plan, KENKO Vision 2035, which covers FY 2024 to FY 2035, into three four-year phases: reform of the business structure, regrowth in Phase 2, and evolution and development in Phase 3. In the February 2026 review, while maintaining its basic policy of pursuing fundamental reforms for sustainable growth and further enhancing corporate value, it introduced a new concept: transitioning to a Global Food Solution Company. The Company’s emphasis on turning food problems into excitement and discovery signals its intent to shift from a food manufacturer to a company that combines products, services, overseas operations, and IT, starting from customers’ needs.
The review of the basic strategies indicates three directions. First, the Company will rebuild the business portfolio and review its growth strategy, expanding sales in existing businesses through customer-in and co-creation, optimizing Salad Cafe and cooking classes, and increasing the overseas sales ratio. The Company aims for an overseas sales ratio of 30% in FY 2035. Second, the Company will position smart operations, evolve from DX to BX, and develop incubation functions and an IT strategy through co-creation. Third, the Company will deepen management awareness of the cost of capital and stock price, transition to cash-based management, make investments with a long-term balance of growth potential, profitability, and soundness, and review the dividend policy.
As investors, we would particularly like to emphasize the change in management targets. Phase 1 sets targets of consolidated net sales of 102.0 billion yen, an EBITDA margin of 7.0% or more, and ROIC of 6.0% or more; Phase 2 sets targets of consolidated net sales of 145.0 billion yen, an EBITDA margin of 10.0%, and ROIC of 6.5% or more; and Phase 3 sets targets of consolidated net sales of 200.0 billion yen, an EBITDA margin of 12.0%, and ROIC of 9.0% or more. The fact that EBITDA margin and ROIC, not only the conventional operating profit and ROE, have been positioned as core indicators can be seen as a move to make the amount of cash earnings generated from invested capital, including factories, facilities, IT, and overseas investment, an evaluation axis for management.
The FY 2035 net sales target of 200.0 billion yen is large, more than double net sales in FY 3/2026, and achieving it through existing domestic businesses alone would require high growth. Because the Company positions domestic and overseas M&A and capital expenditures as growth drivers, the probability of achieving the long-term target will depend on future investment projects. Therefore, for equity investment, rather than incorporating the final target of 200.0 billion yen directly into the current value, it is more appropriate first to confirm whether the Company can achieve the Phase 1 profitability indicators. EBITDA margin in FY 3/2026 was 7.5%, exceeding the Phase 1 target, while ROIC improvement will depend on future capital allocation and profit margins. If profitability becomes established in Phase 1, the market will be more likely to evaluate Phase 2 growth investments positively.
Customer-in and co-creation should not be treated as mere sales slogans. In commercial-use foods, customers adopt products to address labor shortages, simplify cooking processes, standardize quality, differentiate menus, and manage costs. By designing products around customers’ issues, the Company can avoid simple price competition and build relationships where price increases are more likely to be accepted. Products that propose new food experiences, such as Traveling the World Dressing, are in the same direction. Recovering sales volume in existing businesses while adding value for customers is a prerequisite for improving profit margins.
BX and IT strategy should also be evaluated in connection with profit margins. The Company has set out an offensive IT strategy to create sources of competitive advantage, standardize operations in non-competitive areas, and build a foundation for companywide optimization. In food manufacturing, fragmented production planning, inventories, raw material procurement, quality control, logistics, and sales information are more likely to lead to disposal, stockouts, surplus inventories, and low factory utilization. If IT investment improves these areas, profit margins and asset turnover can rise even without greatly accelerating sales growth. Conversely, if IT investment remains cost-first, it will pressure the short-term operating margin. Going forward, we would like to track not the amount invested, but outcomes in production efficiency, inventories, fixed costs, and operating margin.
5. Cash-based management, capital efficiency, and shareholder returns
In the review of the Medium- to Long-Term Management Plan, the Company indicates a policy of strengthening the management foundation, investment, and shareholder returns in an integrated manner, improving earning power, and advancing appropriate capital allocation. In Phase 1 cash allocation, the Company assumes 24.0 billion yen in operating cash flow as the source of funds, 31.0 billion yen in investment, and 3.0 billion yen in shareholder returns. Of the 31.0 billion yen in investment, it plans approximately 20.0 billion yen as the M&A investment framework, 5.0 billion yen for capital expenditures and other investments, and 6.0 billion yen for foundation-strengthening investments, allocating these funds to Group restructuring, expansion of facility capacity, environmental investment, relocation of Tokyo Headquarters, IT investment, and other purposes. While facility renewal is unavoidable for a food manufacturer, the Company’s clarification of cash inflows and outflows is important, as it represents a shift from management simply accumulating cash on hand.
Cash flow from operating activities in FY 3/2026 was 2.940 billion yen, and free cash flow was 280 million yen, decreasing from cash flow from operating activities of 4.594 billion yen and free cash flow of 4.070 billion yen in FY 3/2025. Because capital expenditures and working capital have an impact, a judgment should not be made based only on FCF for a single fiscal year. However, in the current investment phase, cash-generation recovery is more important than accounting profit. Over the long term, the Company has a track record of generating high FCF of 5.680 billion yen in FY 3/2024 and 4.070 billion yen in FY 3/2025. If the earnings structure is in place, it can create the funds needed to balance shareholder returns and growth investment.
Net cash, calculated by deducting interest-bearing debt of 3.163 billion yen from cash and deposits of 12.489 billion yen at the end of 1Q, was 9.326 billion yen. This accounts for approximately 27.8% of the market capitalization of approximately 33.499 billion yen. Against the normal forecast PER of 10.3 times, the forecast PER after deducting net cash is 7.4 times. This difference is large, and the current share price attaches a low valuation to business earnings. However, simply adding back net cash is not sufficient. Cash will be reflected more easily in the share price only if the Company can use funds for growth investments while maintaining ROIC and returning the surplus to shareholders.
For shareholder returns, the Company has adopted DOE as an indicator and has indicated a policy of raising it in stages to 2.5% or more in Phase 1, 3.5% or more in FY 2031 in Phase 2, and 4.0% or more in FY 2035 in Phase 3. Annual dividends increased from 17 yen in FY 3/2023 to 30 yen in FY 3/2024, 43 yen in FY 3/2025, and 67 yen in FY 3/2026, and the Company forecasts 70 yen in FY 3/2027. According to Company materials, the forecast dividend payout ratio for FY 3/2027 is 36.3%, and DOE is 2.5%. DOE, which provides a stable return relative to shareholders’ equity even when profits fluctuate, suits the Company, whose profits fluctuate easily due to raw material prices. If dividend increases continue, this will support the share price and improve capital efficiency.
The dividend payout ratio calculated from forecast EPS of 193.1 yen and the forecast dividend of 70 yen is 35.5%, and the retention ratio is 64.5%. The indicative endogenous EPS growth rate, calculated from a forecast ROE of 6.8% and the retention ratio, is 4.4%. Meanwhile, FactSet EPS increased from 88.5 yen in FY 3/2021 to 198.9 yen in FY 3/2026, for a five-year CAGR of 17.6%. However, because this period includes a recovery from profit levels depressed by the COVID-19 pandemic and higher raw material costs, 17.6% is not an appropriate proxy for the normal future growth rate. Based on current ROE and returns, it is better to evaluate EPS growth in the several-percent range as the base case. PER of 10.3 times does not reflect high expectations, even for this level of growth.
Regarding investment securities, Company materials confirmed this time show that the Company has set out the sale of cross-shareholdings as a measure to improve capital efficiency. On the other hand, settlement-related materials alone do not allow sufficient precision in separating the market value and after-tax value of listed shares among investment securities at the most recent point, and therefore an adjusted PER after deducting investment securities as cash equivalents is not used in this report’s valuation. Rather than adding uncertain amounts to make asset value appear large, it is more conservative to evaluate only confirmed net cash. If the amount of cross-shareholdings sold and the use of funds are disclosed going forward, we would like to evaluate this again as progress in capital allocation.
The same applies to real estate. The Company owns multiple factories and land, but the materials available this time do not sufficiently confirm nearby transaction prices, usage, and land area conditions to fairly estimate the current market value of each parcel of land. Therefore, unrealized real estate gains are not added to per-share value, and the real estate-adjusted PER is not used in the investment conclusion. Factory land is an asset necessary for business operations and should not be treated in the same way as surplus real estate that can be sold. If idle assets arise in the future through factory restructuring and a sale policy is indicated, the realized value after deducting tax burden should be evaluated at that time.
6. Shareholder composition, share price trends, and valuation
According to FactSet data, against 16.476 million shares outstanding, insiders hold 46.97%, institutional investors hold 12.54%, and the free float ratio is 53.0%. Major shareholders include treasury shares (12.61%), T&A (8.84%), Suzuyo Construction Holdings (3.78%), Nippon Life (3.50%), and Kikkoman (2.98%). Institutional investors such as Nomura Asset Management, Dimensional, and Vanguard also hold shares. However, with market capitalization in the 30.0 billion yen range, institutional investor participation is limited compared with large-cap stocks.
This shareholder composition is advantageous because the proportion of stable shareholders is high, and share price formation is less likely to be driven solely by short-term funds. The large proportion of treasury shares may also reflect a capital policy aimed at enhancing per-share value. On the other hand, because the free float is relatively small, trading volume is limited, and large institutional investors cannot easily increase their ownership ratios. This can prevent the share price from re-rating in a short period, even after the Company announces favorable results. Conversely, in a market environment in which funds flow into small- and mid-cap stocks, features such as low PBR, high equity yield, stable dividends, and net cash are likely to be evaluated in screening.
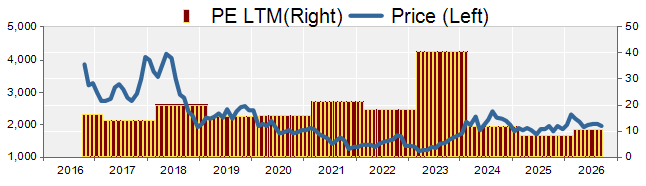
The share price over the past five years or so has responded to the COVID-19 pandemic, the rise in egg prices, the recovery from deterioration in profit margins, and expectations for the Medium- to Long-Term Management Plan. The Company’s long-term share price and PBR trend show PBR declining from 1.9 times in FY 2017 to 0.5 times in FY 2022, when the Company was affected by the COVID-19 pandemic and avian influenza. Thereafter, it recovered to 0.8 times in FY 2023, 0.7 times in FY 2024, and 0.8 times in FY 2025 as profits recovered, but it remains below 1.0 times. In other words, while the share price reacts when profits recover, the multiple does not return to previous levels if the market lacks confidence in sustainable profit margins and capital efficiency.
Since the beginning of 2026, the share price rose in response to the review of the Medium- to Long-Term Management Plan, but the rise did not continue after the decline in operating profit for FY 3/2026 and the plan for lower profit in FY 3/2027 were announced. We believe the underperformance relative to TOPIX year-to-date is not due to weakness in food demand, but because profit margin improvement has not yet been reflected in the numbers, and the results of capital policy have not yet been sufficiently reflected in the share price. Conversely, this also means that if profit margins in the core business and capital allocation improve, the current low multiple could be revised.
At the current share price of 2,033 yen, the forecast PER is 10.3 times, the actual PBR is 0.70 times, and the equity yield is 9.7%. Forecast ROE of 6.8% is not double-digit, but it is not so low as to justify a PBR of 0.70 times. We believe both PER and PBR are low because the market is factoring in not only future growth rates, but also the risk of a renewed decline in profit margins due to higher raw material costs and the risk that capital efficiency will not improve. What matters is that the Company has incorporated ROIC, DOE, and cash-based management into its management plan and has set these as improvement targets.
7. Share price level viewed from PBR, DCF, and ROIC
Rather than determining the appropriate share price using a single method, it is better to view the range from three perspectives: capital efficiency, cash generation, and business earnings. The Company is in an investment phase, and FCF fluctuates significantly in a single fiscal year, so DCF alone can be unstable. On the other hand, PBR alone makes it difficult to capture net cash and future improvements in profit margins. Therefore, we use PBR, DCF, and ROIC to confirm the distance from the current share price. The figures are not target share prices, but reference ranges to gauge how conservative the current share price valuation is.
Under the PBR method, based on an actual BPS of 2,887 yen, we apply 0.8 to 1.0 times, as improvement in the earnings structure is still in progress. The share price range is approximately ¥2,310 to ¥2,890. The upper limit is set at 1.0 times because, with a forecast ROE of 6.8%, further profitability improvement is still needed to justify a high PBR. On the other hand, the current 0.70 times can also be read as a level that scarcely evaluates the Company’s changes, as it aims for ROIC of 6.0% or more and an EBITDA margin of 7.0% or more in Phase 1 and raises DOE.
Under the DCF method, rather than assuming that FCF of 280 million yen in FY 3/2026 will continue in perpetuity, we use cautious assumptions of normalized FCF of approximately 1.5 billion yen to 2.0 billion yen, WACC in the high 5% range, and a perpetual growth rate of around 0.5%, taking into account that the investment burden will continue in Phase 1. The share price range, based on shareholder value after adding net cash, is roughly 2,300 yen to 3,000 yen. In past fiscal years, FCF exceeded 4.0 billion yen, and if profit margins and investment burden normalize, there could be upside, but we do not fully incorporate this into the current value.
Under the ROIC method, we make a trial calculation of business value in the case where economic profit above cost of capital continues, based on invested capital viewed from shareholders’ equity, debt, and cash at the end of 1Q, and the Company’s Phase 1 target of ROIC of 6.0% or more. If we assume ROIC is slightly above the cost of capital at present and the Phase 1 target is stably secured, the share price range is approximately ¥ 2,400 to ¥ 3,100. Because the quality of value differs depending on whether the ROIC rise comes from improved profit margins or reduced invested capital, it will be necessary to confirm operating margin and asset turnover together going forward.
Aligning the central values of the three methods gives approximately 2,600 yen under the PBR method, approximately 2,650 yen under the DCF method, and approximately 2,750 yen under the ROIC method, with the median located in the range of approximately 2,650 yen to 2,700 yen. We set the overall range at approximately 2,300 yen to 3,100 yen. The current share price of 2,033 yen is below the lower end of the range. Therefore, the current share price should be viewed not as a price after sufficient confirmation of profit margin improvement, but as a price that reasonably factors in uncertainty during the improvement process. For the share price to approach the center of the range, continued profit growth in the core business, improvement in the operating margin, and execution of capital policy including DOE and the purchase of treasury shares will be necessary.
| Valuation method | Main assumptions | Reference share price range | Central value |
| PBR | BPS of 2,887 yen; PBR of 0.8 times to 1.0 times | 2,310 yen to 2,890 yen | Approx. 2,600 yen |
| DCF | Normalized FCF of 1.5 billion yen to 2.0 billion yen; WACC in the high 5% range | 2,300 yen to 3,000 yen | Approx. 2,650 yen |
| ROIC | Based on Phase 1 ROIC of 6.0% or more | 2,400 yen to 3,100 yen | Approx. 2,750 yen |
| Overall | Emphasis on the overlap among the three methods | 2,300 yen to 3,100 yen | Approx. 2,700 yen |
Source: Trial calculation based on FactSet and the Company’s Medium- to Long-Term Management Plan, using Omega Investment assumptions
8. Medium- to long-term investment scenario and future monitoring
The basic medium- to long-term scenario is not only expansion of net sales, but also that the operating margin bottoms out through price increases and productivity improvement, and that investment and returns are organized under cash-based management. The Company’s plan for FY 3/2027 is for lower operating profit, and the share price does not assume strong short-term profit growth. Therefore, rather than requiring results that significantly exceed the Company’s plan, the share price valuation is likely to change if it is confirmed that the core business continues to increase profit while absorbing higher raw material costs. In particular, if signs emerge that the operating margin is moving from the 4% range back toward 5% over multiple quarters, the rationale for maintaining a PBR in the 0.7 times range is likely to weaken.
Over a one- to two-year time horizon, we believe the profit plan for FY 3/2027 and the direction of profit margins toward FY 3/2028 will influence the share price. If the effects of price increases exceed the impact of raw material costs and the effects of factory restructuring, such as integration into the Shizuoka Fujisan Factory, emerge, confidence in the Company’s plan of 4.0 billion yen in operating profit will increase. If a DOE of 2.5% or more becomes established and, as needed, the purchase of treasury shares and sale of cross-shareholdings progress, the share price will be more easily supported from both dividend yield and capital efficiency perspectives. The current equity yield of 9.7% is sufficiently attractive as a valuation while this process unfolds.
Over a three- to four-year time horizon, the quality of growth investments toward Phase 2 will become central. The question is whether raising the overseas sales ratio, M&A, BX, and IT investment will raise not only sales but also EBITDA margin and ROIC. The domestic commercial-use food market is highly mature, so overseas growth and new business models will be necessary to aim for net sales of 200.0 billion yen. However, even if the investment amount is large, shareholder value is unlikely to increase unless ROIC exceeds the cost of capital. Since the Company sets out growth potential, profitability, and soundness, investors should also evaluate progress along the same three axes.
We would like to narrow the items to confirm in subsequent results to six. First is the segment profit margin of the Seasoning and Processed Foods Business, to see whether the profit growth seen in 1Q continues. Second is the difference between the effects of price increases and ingredient impact, to confirm whether price increases consistently exceed higher raw material costs. Third is production efficiency, separating improvement from factory integration from yield deterioration due to a poor potato crop and other factors. Fourth is profit in the Delicatessen-related Business, to confirm whether the profitability improvement in FY 3/2026 can be reproduced. Fifth is cash flow from operating activities and capital expenditures, to see whether accounting profit leads to FCF. Sixth is capital allocation, including DOE, the purchase of treasury shares, and the sale of cross-shareholdings. If these six items improve simultaneously, this is likely to lead not only to business performance, but also to a review of the share price multiple.
The largest downside risk is that the time lag between higher raw material costs and price increases widens again. Eggs, potatoes, edible oils, and packaging materials are susceptible to weather, disease, and international conditions, and the Company cannot control them alone. The second risk is that factory restructuring and IT investment become cost-first, delaying productivity improvement. The third is that customers advance in-house production in the Delicatessen-related Business, and declining sales increase the fixed-cost burden. The fourth is that ROIC declines as the Company rushes into overseas and M&A investments. If these factors overlap, undervaluation could worsen due to downward profit revisions even if PER is low.
Upside factors include price increases taking hold and raw material market conditions easing simultaneously; growth in volumes of mayonnaise and sauces for restaurants, potato salad, and Processed Egg products; the effects of production base restructuring appearing in profit; and capital policy advancing beyond plan. Because the Company plan is not designed to significantly increase short-term profit, even a slight improvement in profit margins is likely to be a positive factor relative to market expectations. In particular, when funds flow into small- and mid-cap stocks, a combination of a PER of around 10 times, a PBR of around 0.7 times, an equity yield in the 9% range, a dividend yield in the 3% range, and net cash may attract attention.
In conclusion, investing in the Company’s shares is not buying a completed, high-profitability company at a high multiple. It is an investment that captures a stage in which a company with a stable demand base in commercial-use foods is reviewing its business structure and capital allocation in response to past declines in profit margins. The share price has not yet fully reflected that improvement. In 1Q FY 3/2027, the Company confirmed profit growth in its core business and incorporated ROIC, DOE, and cash-based management into concrete management indicators. At the current share price of 2,033 yen, we believe there is a reason to begin medium- to long-term investment. The basic strategy is to tolerate short-term fluctuations in raw materials while confirming improvement in profit margins and capital allocation each quarter, and to capture the accumulation of corporate value over a one- to four-year time horizon.
9. A further look into the structure that affects profit margins
When considering the Company’s profit margins, looking only at raw material prices is not sufficient. Among the factors behind changes in operating profit in FY 3/2026, price increases of 2.718 billion yen and the ingredient impact of 1.979 billion yen are large and stand out. However, sales volume, logistics costs, and fixed costs were also negative factors totaling more than 1.4 billion yen. In other words, stabilizing profit margins requires not only price increases, but also simultaneous management of volume, factory operations, logistics, and fixed costs. We believe the Company’s shift from DX to BX, its IT strategy, and its rebuilding of the business portfolio in the Medium- to Long-Term Management Plan aim to improve these cost factors across the entire business process, not through isolated responses.
The effects of price increases appear in net sales and profit with a time lag. When raw material prices rise sharply, the gross profit margin declines because selling prices remain unchanged. Subsequently, as price increases proceed, the gross profit margin recovers, but if sales volume declines during the period before price increases, or customers switch to in-house production, profit recovery is delayed. The fact that price increases had an effect of 1.115 billion yen in 1Q, while sales volume was a negative factor of 101 million yen, indicates this time lag. Going forward, if sales volume holds up after price increases, the price increases can be evaluated as moving beyond mere cost pass-through to profit margin improvement.
Factory restructuring should also be viewed from the same perspective. The Company is proceeding with initiatives such as integrating the Aizu Wakamatsu Factory of KANTOH DIET EGG Co., Ltd. and consolidating into the Shizuoka Fujisan Factory. Consolidating production bases reduces fixed costs and increases utilization rates, but during the transition period, logistics distance, facility relocation, startup expenses, and yield deterioration tend to occur. In 1Q, production efficiency was a negative factor of 230 million yen, including the yield impact from the poor potato crop. To judge the results of factory restructuring, one should look not simply at whether the number of factories has decreased, but whether manufacturing cost per unit, disposal, logistics costs, and facility utilization rates have improved and are reflected in the segment profit margin.
By sales channel, growth in restaurants and bread is supporting the current situation. For restaurants, the Company can sell multiple categories, including mayonnaise, dressings, sauces, potato salad, and Processed Egg products, and can capture customer menu changes and demand for labor-saving products. Bread also has broad applications for commercial-use mayonnaise and fillings. In contrast, mass retailers and the Delicatessen-related Business may be affected by in-house production by customers. Looking not only at net sales growth, but also at which products are growing in which channels, makes it easier to judge the sustainability of profit margins. If increases in restaurants and bread are accompanied not by a temporary recovery in demand, but by expanded adoption and volume growth, they could become upside factors to the FY 3/2027 sales plan.
The overseas business should be positioned as a driver of future growth rates and capital efficiency more than current profit scale. The Company currently develops the business mainly through product exports, but established a base in Indonesia in 2012 and invested in a delicatessen manufacturer in the United States in 2018. In KENKO Vision 2035, the Company indicated a policy of raising the overseas sales ratio to 30% in FY 2035. In the domestic market, while the population continues to decline, demand for labor-saving restaurant and ready-made meals is considered solid. However, to achieve the long-term target of net sales of 200.0 billion yen, overseas growth will need to contribute significantly. As investors, we should follow not only overseas sales growth but also local profit margins, investment amounts, and payback periods, and confirm whether scale alone is expanding while ROIC remains below that of the domestic business.
The Medium- to Long-Term Management Plan’s positioning of domestic and overseas M&A as a growth driver is also important for share-price valuation. Because the Company has net cash, it can easily secure acquisition funds, but M&A spending does not create value on its own. Deals need to complement existing businesses in terms of customer base, product categories, overseas production, sales channels, and other areas, and raise profit margins and ROIC after acquisition. As the Company has indicated a long-term net D/E ratio of less than 1.5 and a stance of also using borrowings, we believe investment decisions will consider not only financial safety but also the cost of capital, including debt, going forward.
When considering the share price valuation, the future focus is not only on the low PER, but also on the level to which PBR can recover. The current PBR of 0.70 times indicates that the valuation has not yet reflected an evaluation in which returns on equity sufficiently exceed the cost of capital. If ROE of 6.8% continues as is and profit growth also remains in the several-percent range, PBR may not rise significantly. On the other hand, if ROE returns to the 8% range through profit margin improvement and capital allocation, and ROIC stably exceeds the cost of capital, a valuation close to a PBR of 1.0 times will become realistic. PBR of 1.0 times against an actual BPS of 2,887 yen is 2,887 yen, and the gap from the current share price is large. Therefore, this investment scenario includes not only profit growth but also a correction in the share price multiple through improved capital efficiency.
An equity yield of 9.7% is an effective indicator in considering this scenario. Equity yield indicates forecast profit relative to the current share price, and in the Company’s case it is close to 10%. Of course, if profit is revised downward, equity yield will also decline, so you cannot judge undervaluation based on the figure alone. Even so, considering the demand base for commercial-use foods, profit growth in the core business in 1Q, net cash, and dividends together, this is not a price based on the premise that profit will decline sharply. We believe the current share price is attractive because it allows investment while maintaining a high equity yield, as the earnings structure improves gradually.
Another key point is the combination of the gross profit margin and SG&A ratio. In FY 3/2026, the gross profit margin improved to 22.6%, while the SG&A ratio rose to 18.1%, reducing the operating margin to 4.5%. This is a structure in which the burden of SG&A expenses, including business restructuring, personnel expenses, and base relocation, pushed down profit, rather than product profitability itself deteriorating significantly. In 1Q, gross profit margin was 21.8%, up from 21.6% in the same period last year, but the SG&A ratio rose to 18.7%. Going forward, if price increases continue to support gross profit margin, relocation and restructuring expenses settle down, and the SG&A ratio declines, operating margin may improve more than sales growth. Conversely, if fixed costs remain high, improvements in gross profit margin will not translate into operating profit, so that the SG&A ratio will be an important confirmation item in subsequent results.
Breaking down ROE, the Company’s issue is less a lack of financial leverage than profit margins and asset use. Financial safety is high because the Company has net cash and a strong equity base; however, if profit is the same, ROE will be lower. Management’s focus on cost of capital and stock price suggests profit-margin improvement through BX, asset utilization through investment, and using debt as needed. This should be understood not as simply increasing borrowings to raise ROE, but as improving both the numerator and the denominator by moving capital into investments that generate cash flows. Shareholders want not simply to reduce equity through dividends and treasury share purchases, but to raise the core business’s profit margin, confirm the profitability of growth investments, and then return surplus capital.
The current investment conclusion is not based on the disappearance of negative factors. Higher raw material costs, lower profit in the Delicatessen-related Business, investment burden, and uncertainty in overseas growth remain. Even so, considering that the share price remains at 2,033 yen, forecast PER is 10.3 times, PBR is 0.70 times, equity yield is 9.7%, and net cash-adjusted PER is 7.4 times, we believe these risks are reflected in the share price to a reasonable extent. Conversely, if investment starts after core-business profit growth continues for several quarters and operating margin improves, the share price may already have risen to reflect this. We do not make buy or sell recommendations, but as a conclusion of the analysis, we judge that the current valuation level is at a point where it is easy to consider starting a medium- to long-term investment.
In this sense, two views coexist in the current share price valuation. One is the view that, although demand is stable as a food manufacturer, it takes time to pass increases in raw material prices through to selling prices, and the possibility that profit margins will decline again should be weighed heavily. The other view is that earnings power has recovered through price increases and business restructuring over the past several years, and that the Company has begun to place capital efficiency and shareholder returns at the center of management. The current PER and PBR strongly reflect the former’s caution and, in our view, do not sufficiently factor in the latter’s results. Therefore, future returns are more likely to arise from steady improvement in profit margins and ROIC changing the market’s view, rather than from a significant upside in net sales.
(Note)
The share price-related indicators in this report use a share price of 2,033 yen, forecast EPS of 197.3 yen, actual BPS of 2,887 yen, forecast ROE of 6.8%, and forecast dividend of 70 yen. Company performance, business segment figures, and the Medium- to Long-Term Management Plan are based mainly on Company materials announced on May 22, 2026, and August 7, 2026, FactSet data, and Omega Investment’s June 2026 Update Report. The trial calculation of the appropriate share price varies with assumptions and is not intended as an investment recommendation or a guarantee of future share price.
Key stock price data
Key financial data
| Unit: million yen | 2022/3 | 2023/3 | 2024/3 | 2025/3 | 2026/3 | 2027/3 CE |
| Sales | 75,647 | 82,363 | 88,724 | 91,703 | 92,354 | 97,000 |
| EBIT (Operating Income) | 1,617 | 106 | 2,950 | 4,846 | 4,155 | 4,000 |
| Pretax Income | 1,754 | 648 | 3,767 | 5,142 | 4,239 | |
| Net Profit Attributable to Owner of Parent | 1,211 | 485 | 2,735 | 3,503 | 2,926 | 2,840 |
| Cash & Short-Term Investments | 12,441 | 12,289 | 15,729 | 15,729 | 13,487 | |
| Total assets | 61,760 | 63,011 | 67,370 | 64,080 | 63,922 | |
| Total Debt | 10,472 | 5,503 | 6,447 | 5,509 | 3,293 | |
| Net Debt | -1,969 | -6,786 | -9,282 | -10,220 | -10,194 | |
| Total liabilities | 25,218 | 26,214 | 28,386 | 24,114 | 22,353 | |
| Total Shareholders’ Equity | 36,539 | 36,794 | 38,978 | 39,963 | 41,563 | |
| Net Operating Cash Flow | 3,757 | 3,526 | 5,957 | 4,594 | 2,940 | |
| Capital Expenditure | 398 | 1,304 | 913 | 822 | 2,774 | |
| Net Investing Cash Flow | -419 | -856 | -239 | -1,062 | -2,706 | |
| Net Financing Cash Flow | -3,281 | -2,822 | -2,277 | -3,531 | -2,475 | |
| Free Cash Flow | 3,531 | 2,941 | 5,680 | 4,070 | 280 | |
| ROA (%) | 1.95 | 0.78 | 4.20 | 5.33 | 4.57 | |
| ROE (%) | 3.36 | 1.32 | 7.22 | 8.87 | 7.18 | |
| EPS (Yen) | 74.3 | 29.8 | 169.9 | 221.6 | 198.9 | 197.3 |
| BPS (Yen) | 2,245.0 | 2,281.7 | 2,439.9 | 2,678.1 | 2,886.8 | |
| Dividend per Share (Yen) | 17.00 | 17.00 | 30.00 | 43.00 | 67.00 | 70.00 |
| Shares Outstanding (Million shares) | 16.48 | 16.48 | 16.48 | 16.48 | 16.48 |
Source: Calculated by Omega Investment based on FactSet’s standard criteria, rounded to the nearest whole number.
Share price
Financial data (quarterly basis)
| Unit: million yen | 2025/3 | 2026/3 | 2027/3 | ||||||
| 1Q | 2Q | 3Q | 4Q | 1Q | 2Q | 3Q | 4Q | 1Q | |
| (Income Statement) | |||||||||
| Sales | 23,002 | 23,453 | 24,082 | 21,166 | 22,675 | 23,266 | 24,321 | 22,092 | 23,323 |
| Year-on-year | 7.5% | 4.9% | 3.2% | -2.1% | -1.4% | -0.8% | 1.0% | 4.4% | 2.9% |
| Cost of Goods Sold (COGS) | 17,405 | 18,201 | 18,648 | 16,912 | 17,783 | 17,977 | 18,526 | 17,211 | 18,241 |
| Gross Income | 5,597 | 5,252 | 5,434 | 4,254 | 4,892 | 5,289 | 5,795 | 4,881 | 5,082 |
| Gross Income Margin | 24.3% | 22.4% | 22.6% | 20.1% | 21.6% | 22.7% | 23.8% | 22.1% | 21.8% |
| SG&A Expense | 3,861 | 3,793 | 4,038 | 3,999 | 4,129 | 4,108 | 4,175 | 4,290 | 4,355 |
| EBIT (Operating Income) | 1,736 | 1,459 | 1,396 | 255 | 763 | 1,181 | 1,620 | 591 | 727 |
| Year-on-year | 768.0% | 150.3% | -9.6% | -59.1% | -56.0% | -19.1% | 16.0% | 131.8% | -4.7% |
| Operating Income Margin | 7.5% | 6.2% | 5.8% | 1.2% | 3.4% | 5.1% | 6.7% | 2.7% | 3.1% |
| EBITDA | 2,309 | 2,041 | 2,000 | 898 | 1,422 | 1,878 | 2,284 | 1,327 | 1,363 |
| Pretax Income | 1,795 | 1,472 | 1,460 | 415 | 792 | 1,049 | 1,643 | 755 | 779 |
| Consolidated Net Income | 1,227 | 1,019 | 998 | 259 | 560 | 685 | 1,151 | 530 | 565 |
| Minority Interest | 0 | 0 | 0 | 0 | 0 | 0 | 0 | 0 | 0 |
| Net Income ATOP | 1,227 | 1,019 | 998 | 259 | 560 | 685 | 1,151 | 530 | 565 |
| Year-on-year | 764.1% | 154.8% | -10.0% | -76.1% | -54.4% | -32.8% | 15.3% | 104.6% | 0.9% |
| Net Income Margin | 5.3% | 4.3% | 4.1% | 1.2% | 2.5% | 2.9% | 4.7% | 2.4% | 2.4% |
| (Balance Sheet) | |||||||||
| Cash & Short-Term Investments | 15,487 | 15,940 | 18,279 | 15,729 | 14,691 | 15,570 | 15,658 | 13,487 | 12,489 |
| Total assets | 68,096 | 65,443 | 71,037 | 64,080 | 63,077 | 64,559 | 69,196 | 63,922 | 64,086 |
| Total Debt | 4,172 | 4,021 | 3,925 | 5,509 | 3,685 | 3,554 | 3,424 | 4,768 | 3,163 |
| Net Debt | -11,315 | -11,919 | -14,354 | -10,220 | -11,006 | -12,016 | -12,234 | -8,719 | -9,326 |
| Total liabilities | 28,008 | 24,670 | 29,031 | 24,114 | 22,996 | 23,686 | 28,366 | 22,359 | 22,602 |
| Total Shareholders’ Equity | 40,086 | 40,771 | 42,004 | 39,963 | 40,080 | 40,871 | 40,827 | 41,563 | 41,481 |
| (Profitability %) | |||||||||
| ROA | 5.86 | 6.69 | 6.21 | 5.33 | 4.32 | 3.85 | 3.79 | 4.57 | 4.61 |
| ROE | 9.89 | 11.31 | 10.74 | 8.87 | 7.08 | 6.13 | 6.41 | 7.18 | 7.19 |
| (Per-share) Unit: JPY | |||||||||
| EPS | 76.8 | 63.7 | 62.4 | 17.4 | 37.5 | 45.9 | 78.4 | 36.8 | 39.2 |
| BPS | 2,509.2 | 2,550.0 | 2,627.1 | 2,678.1 | 2,686.0 | 2,735.5 | 2,835.7 | 2,886.8 | 2,881.1 |
| Dividend per Share | 0.00 | 19.00 | 0.00 | 24.00 | 0.00 | 23.00 | 0.00 | 44.00 | 0.00 |
| Shares Outstanding(million shares) | 16.48 | 16.48 | 16.48 | 16.48 | 16.48 | 16.48 | 16.48 | 16.48 | 16.48 |
Source: Calculated by Omega Investment based on FactSet’s standard criteria, rounded to the nearest whole number.
Financial data (full-year basis)
| Unit: million yen | 2017/3 | 2018/3 | 2019/3 | 2020/3 | 2021/3 | 2022/3 | 2023/3 | 2024/3 | 2025/3 | 2026/3 |
| (Income Statement) | ||||||||||
| Sales | 70,812 | 72,759 | 73,989 | 74,480 | 68,502 | 75,647 | 82,363 | 88,724 | 91,703 | 92,354 |
| Year-on-year | 5.8% | 2.7% | 1.7% | 0.7% | -8.0% | 10.4% | 8.9% | 7.7% | 3.4% | 0.7% |
| Cost of Goods Sold | 52,433 | 53,837 | 55,778 | 56,635 | 52,643 | 59,851 | 67,737 | 70,706 | 71,166 | 71,497 |
| Gross Income | 18,379 | 18,922 | 18,211 | 17,845 | 15,859 | 15,796 | 14,626 | 18,018 | 20,537 | 20,857 |
| Gross Income Margin | 26.0% | 26.0% | 24.6% | 24.0% | 23.2% | 20.9% | 17.8% | 20.3% | 22.4% | 22.6% |
| SG&A Expense | 14,391 | 14,748 | 15,094 | 14,944 | 13,882 | 14,179 | 14,520 | 15,068 | 15,691 | 16,702 |
| EBIT (Operating Income) | 3,988 | 4,174 | 3,117 | 2,901 | 1,977 | 1,617 | 106 | 2,950 | 4,846 | 4,155 |
| Year-on-year | 16.1% | 4.7% | -25.3% | -6.9% | -31.9% | -18.2% | -93.4% | 2683.0% | 64.3% | -14.3% |
| Operating Income Margin | 5.6% | 5.7% | 4.2% | 3.9% | 2.9% | 2.1% | 0.1% | 3.3% | 5.3% | 4.5% |
| EBITDA | 5,742 | 5,919 | 5,194 | 5,867 | 4,929 | 4,414 | 2,882 | 5,649 | 7,248 | 6,911 |
| Pretax Income | 4,021 | 4,205 | 3,781 | 3,104 | 2,140 | 1,754 | 648 | 3,767 | 5,142 | 4,239 |
| Consolidated Net Income | 2,867 | 2,877 | 2,296 | 2,058 | 1,458 | 1,211 | 485 | 2,735 | 3,503 | 2,926 |
| Minority Interest | 0 | 0 | 0 | 0 | 0 | 0 | 0 | 0 | 0 | 0 |
| Net Income ATOP | 2,867 | 2,877 | 2,296 | 2,058 | 1,458 | 1,211 | 485 | 2,735 | 3,503 | 2,926 |
| Year-on-year | 37.5% | 0.3% | -20.2% | -10.4% | -29.2% | -16.9% | -60.0% | 463.9% | 28.1% | -16.5% |
| Net Income Margin | 4.0% | 4.0% | 3.1% | 2.8% | 2.1% | 1.6% | 0.6% | 3.1% | 3.8% | 3.2% |
| (Balance Sheet) | ||||||||||
| Cash & Short-Term Investments | 13,779 | 13,072 | 10,927 | 10,747 | 12,385 | 12,441 | 12,289 | 15,729 | 15,729 | 13,487 |
| Total assets | 51,442 | 64,837 | 70,105 | 63,767 | 62,320 | 61,760 | 63,011 | 67,370 | 64,080 | 63,922 |
| Total Debt | 7,696 | 13,890 | 19,095 | 15,699 | 13,118 | 10,472 | 5,503 | 6,447 | 5,509 | 3,293 |
| Net Debt | -6,083 | 818 | 8,168 | 4,952 | 733 | -1,969 | -6,786 | -9,282 | -10,220 | -10,194 |
| Total liabilities | 22,984 | 33,849 | 37,200 | 29,660 | 26,739 | 25,218 | 26,214 | 28,386 | 24,114 | 22,353 |
| Total Shareholders’ Equity | 28,456 | 30,984 | 32,900 | 34,103 | 35,577 | 36,539 | 36,794 | 38,978 | 39,963 | 41,563 |
| (Cash Flow) | ||||||||||
| Net Operating Cash Flow | 4,692 | 4,950 | 2,405 | 5,575 | 5,203 | 3,757 | 3,526 | 5,957 | 4,594 | 2,940 |
| Capital Expenditure | 3,909 | 11,769 | 6,731 | 2,068 | 705 | 398 | 1,304 | 913 | 822 | 2,774 |
| Net Investing Cash Flow | -3,929 | -11,811 | -8,895 | -2,098 | -588 | -419 | -856 | -239 | -1,062 | -2,706 |
| Net Financing Cash Flow | 5,603 | 6,154 | 4,345 | -3,657 | -2,976 | -3,281 | -2,822 | -2,277 | -3,531 | -2,475 |
| Free Cash Flow | 842 | -6,809 | -4,230 | 3,558 | 4,546 | 3,531 | 2,941 | 5,680 | 4,070 | 280 |
| (Profitability ) | ||||||||||
| ROA (%) | 6.12 | 4.95 | 3.40 | 3.07 | 2.31 | 1.95 | 0.78 | 4.20 | 5.33 | 4.57 |
| ROE (%) | 12.00 | 9.68 | 7.19 | 6.14 | 4.18 | 3.36 | 1.32 | 7.22 | 8.87 | 7.18 |
| Net Margin (%) | 4.05 | 3.95 | 3.10 | 2.76 | 2.13 | 1.60 | 0.59 | 3.08 | 3.82 | 3.17 |
| Asset Turn | 1.51 | 1.25 | 1.10 | 1.11 | 1.09 | 1.22 | 1.32 | 1.36 | 1.40 | 1.44 |
| Assets/Equity | 1.96 | 1.96 | 2.11 | 2.00 | 1.81 | 1.72 | 1.70 | 1.72 | 1.67 | 1.57 |
| (Per-share) Unit: JPY | ||||||||||
| EPS | 194.9 | 174.6 | 139.4 | 124.9 | 88.5 | 74.3 | 29.8 | 169.9 | 221.6 | 198.9 |
| BPS | 1,727.1 | 1,880.6 | 1,996.9 | 2,069.9 | 2,159.4 | 2,245.0 | 2,281.7 | 2,439.9 | 2,678.1 | 2,886.8 |
| Dividend per Share | 37.00 | 37.00 | 30.00 | 31.00 | 20.00 | 17.00 | 17.00 | 30.00 | 43.00 | 67.00 |
| Shares Outstanding (million shares) | 14.21 | 16.48 | 16.48 | 16.48 | 16.48 | 16.48 | 16.48 | 16.48 | 16.48 | 16.48 |
Source: Calculated by Omega Investment based on FactSet’s standard criteria, rounded to the nearest whole number.