2026-10-16
Home
Japanese

Omega Investment Co., Ltd.
CNS (Investment report – 1Q upadate)
| Share price (10/22) | ¥1,968 | Dividend Yield (27/5 CE) | 3.9 % |
| 52weeks high/low | ¥2,060/1,542 | ROE(26/5) | 14.2 % |
| Avg Vol (3 month) | 3.0 thou shrs | Operating margin (TTM) | 8.8 % |
| Market Cap | ¥5.72 bn | Beta (5Y Monthly) | 0.39 |
| Enterprise Value | ¥1.99 bn | Shares Outstanding | 2.906 mn shrs |
| PER (27/5 CE) | 8.4 X | Listed market | TSE Growth |
| PBR (26/5 act) | 1.3 X |
| Click here for the PDF version of this page |
| PDF version |
AI remains strong, and low-margin businesses are improving. The sharp share-price decline has once again widened the gap between the share price and business value.
Investment conclusion
We maintain our Bullish investment view. The first quarter did not materially increase confidence in achievement of the company plan, but Technology Solutions, driven by AI and ServiceNow projects, exceeded expectations, while the gross margin in the Business Solutions business, the area we have focused on most closely in our analysis, improved from 16.4% in the previous quarter to 20.0%. Meanwhile, ERP project starts were delayed, and the Consulting business also came in slightly below the company’s expectations. The results contained both positives and challenges, and we do not believe the probability of achieving the full-year company plan has increased materially.
The main reason we maintain our Bullish view is that the October 15 closing share price of 1,841 yen has again returned to a level that assigns a low valuation to the underlying business’s earnings power. The forward PER is 7.9 times, PBR is 1.25 times, forecast ROE is 15.9% on the simplified calculation, and FactSet-approximate ROIC is 13.8%. In addition, conservative net cash at the end of August 2026 was 3.494 billion yen, equivalent to 65.3% of the 5.350 billion yen market capitalization. The net-cash-adjusted PER is only 2.7 times. Even after factoring in the ERP delay, we believe the market valuation of a business that continues to generate earnings remains low.
The share price fell 8.5% on October 15, from the previous close of 2,011 yen to 1,841 yen. The results contained several cautionary factors, including flat operating profit, delays in ERP project starts, and the Consulting business falling short of the company’s expectations. At the same time, the company announced an off-auction distribution of 100,000 shares, equivalent to approximately 3.4% of shares outstanding and around 10% of the current free float. The shares to be distributed are not sold into the regular trading session the day after the announcement, but investors may anticipate a future increase in share supply and the discount applied to the distribution price, leading them to sell ahead of an expected deterioration in near-term supply-demand conditions. We therefore believe the sharp decline reflected both a reset of earnings expectations and supply-demand concerns associated with the off-auction distribution. Over the medium to long term, however, the distribution is also a concrete measure to optimize the shareholder base and improve share liquidity. We believe it should be assessed separately from the near-term supply burden.
We had identified three points to confirm in the first quarter: whether the Business Solutions business gross margin would return to the 20% range, whether the Technology Solutions business could maintain a gross margin in the 28% range, and whether ERP orders would become more concrete. The first two were broadly confirmed, while concrete progress in ERP orders was not confirmed. We therefore see no need to revise the existing investment thesis. However, our view that ERP is the most important issue for delivering the earnings growth in the company plan has become stronger.
1. First-Quarter Results
Revenue In Line; Profit Above Expectations Including Timing Shifts in Expenses
In the first quarter of fiscal May 2027, revenue was 2.036 billion yen, up 8.7% year over year; operating profit was 182 million yen, up 0.2%; ordinary profit was 191 million yen, up 4.9%; and quarterly profit attributable to owners of parent was 128 million yen, down 17.2%. The decline in quarterly profit mainly reflected the absence of a 46 million yen gain on sale of investment securities recorded in the prior-year period and should be distinguished from a deterioration in the underlying business. Gross profit was 510 million yen, up 4.5%, while the gross margin declined 1.0 percentage point from 26.0% to 25.0%.
Operating profit was roughly flat year over year but exceeded the company’s expectations. The company cited lower-than-planned recruiting expenses and the timing shift of system renewal-related expenses. Because the latter are expected to be incurred from the second quarter onward, it would be premature to translate the first-quarter profit upside directly into full-year upside. At the same time, maintaining operating profit while absorbing head-office relocation costs and higher SG&A expenses associated with expansion of the ERP business does not suggest that underlying earnings power weakened.
The company maintained its full-year forecast of revenue of 9.278 billion yen, operating profit of 966 million yen, an operating margin of 10.4%, and profit attributable to owners of parent of 679 million yen. First-quarter progress was 21.9% for revenue and 18.9% for operating profit. The plan has always assumed that profit would be weighted toward the second half, and the company currently expects progress to remain in line with the forecast announced in July. We therefore see no need to revise the company forecast downward at this stage. However, greater confidence in achievement will require confirmation of business-level profitability from the second quarter onward.
2. Assessment of the Three Businesses
Strong AI and Recovering Profitability in Business Solutions Are the Key Points
Technology Solutions
Revenue was 952 million yen, up 17.8% year over year; gross profit was 274 million yen, up 16.7%; and gross margin was 28.8%. AI and ServiceNow projects drove results above the company’s expectations. We continue to view this business as the principal growth driver of corporate value, and there is no evidence requiring a change in that view. If generative AI projects expand within existing customers and ServiceNow continues to add new projects, the probability of achieving the company’s plan of 4.113 billion yen in revenue and 1.177 billion yen in gross profit will increase.
Against the backdrop of advances in AI, the company indicated that it will focus on areas that are difficult to replace with AI, including planning, proposals, and requirements definition. In addition, through its collaboration with NTQ, it is building modernization services that use AI-driven development. For CNS, AI is not only a source of customer-facing revenue but also a way to increase productivity in development, testing, documentation, and proposal preparation, reducing dependence on labor hours. Key KPIs going forward are AI revenue, ServiceNow revenue, maintenance of a gross margin in the 28% range, diversification of AI projects across customers, and gross profit generated per person through the use of generative AI.
Business Solutions
Revenue was 900 million yen, up 0.7%; gross profit was 179 million yen, down 9.6%; and gross margin was 20.0%. Although below 22.3% in the prior-year period, the margin improved for the second consecutive quarter, from 14.5% in the third quarter to 16.4% in the fourth quarter of fiscal May 2026. We had treated a return to the 20% range in the first quarter as an important confirmation point. On this measure, initial improvement was confirmed.
However, the conditions required to achieve the full-year plan remain demanding. For fiscal May 2027, the company plans Business Solutions revenue of 4.242 billion yen, gross profit of 975 million yen, and a gross margin of 23.0%. Against first-quarter gross profit of 179 million yen, approximately 796 million yen is required over the remaining three quarters, or an average of about 265 million yen per quarter. Because ERP project starts have been delayed, margin improvement alone will not be sufficient to meet the company’s plan; ERP revenue and profit must begin contributing from the third quarter onward.
Using an internal Oracle NetSuite implementation as a starting point, the company is developing industry-specific templates and targeting prime-contractor engagements primarily with companies with annual revenue below 60 billion yen. For large enterprises, it plans to develop the business around Oracle Fusion Applications. The strategy has become more concrete, but what investors will want to confirm is the number of orders, project size, timing of revenue recognition, and recurring revenue after implementation. From the second quarter onward, our top priorities are starting ERP projects and maintaining a Business Solutions gross margin in the 20% range.
Consulting
Revenue was 184 million yen, up 6.8%; gross profit was 56 million yen, up 3.1%; and gross margin was 30.5%. Although both revenue and profit increased year over year, results were slightly below the company’s expectations, and the gross margin declined from the 35% range in the second half of the previous fiscal year. The company sees signs of recovery in orders and aims to make up the shortfall from the second quarter onward. In terms of corporate value creation, the business’s role in identifying customer issues at the upstream stage and generating development projects for Technology Solutions and Business Solutions is more important than its standalone revenue scale. We will monitor revenue and profitability from prime-contractor engagements and the amount of work generated for the other businesses.
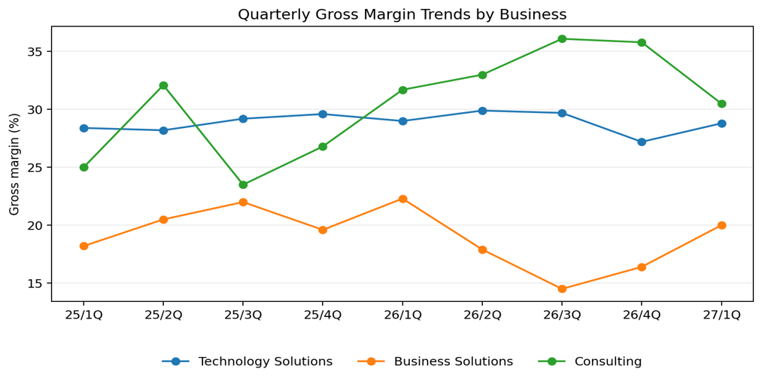
Figure 1 Quarterly Gross Margin Trends by Business Source: Prepared by Omega Investment based on CNS earnings presentation materials
3. Conditions for Achieving the Full-Year Plan
How Far Can AI and Profitability Improvement Offset the ERP Delay?
The full-year company plan calls for revenue of 9.278 billion yen, up 19.3% year over year, operating profit of 966 million yen, up 40.9%, and an operating margin of 10.4%. To grow operating profit faster than revenue, the company assumes expansion of priority growth businesses, withdrawal from low-margin projects, an improved project mix, and productivity gains from companywide use of generative AI. In the first quarter, the strength of AI projects and a turnaround in Business Solutions gross margin were confirmed, but ERP revenue contribution was pushed back.
The company states that first-quarter operating profit exceeded its expectations, but the timing shift in system renewal expenses means those costs will be incurred from the second quarter onward. Accordingly, when assessing the company plan, it is more useful to look at changes in gross profit by business than to rely solely on the progress represented by first-quarter operating profit of 182 million yen. If the Business Solutions gross margin remains in the 20% range in the second quarter and the recovery in Consulting orders is reflected in revenue, concerns about the company plan should recede. Conversely, if ERP project starts are delayed further and the Business Solutions gross margin again falls below 20%, the hurdle to achieving operating profit of 966 million yen will rise.
Upside drivers are AI projects expanding more than expected, new large ServiceNow projects, gross-margin improvement from exiting low-margin projects, and productivity gains from internal use of generative AI. Downside risks are further delays in ERP projects, completion of large AI projects, higher rates for external personnel, and delays in the recovery of Consulting orders. The company plan remains within reach, but at this stage we place greater priority on confirming ERP execution than on upside.
4. Growth Strategy
Linking AI, ERP, and M&A to the Shift Toward a Value-Providing Business Model
To improve profitability, the company is advancing more sophisticated project-level profitability management, reviewing and withdrawing from low-margin projects, shifting personnel to priority growth businesses such as ERP and AI, acquiring prime-contractor engagements, using generative AI, and templating and reusing systems-integration know-how. The company’s stated shift from a labor-provision model to a value-providing business model is also important to changing the current low share-price valuation. As long as the market values CNS as a labor-hour-based contract developer, even high ROE is unlikely to translate into higher PER and PBR multiples.
The M&A policy has become more specific this time. The main targets are IT consulting companies and ERP implementation support companies. The former would provide consulting know-how and personnel needed to win prime-contractor engagements, while the latter would provide ERP implementation and build resources. Specifying the target fields against the 2.0 billion yen growth-investment framework is a step forward. Given the difficult hiring market, it is reasonable to use M&A to acquire upstream and ERP talent at scale.
The next requirement is a clearer explanation of investment discipline. If the company discloses acquisition prices, target-company margins, retention conditions for key personnel, goodwill, post-acquisition ROIC, and cross-selling to existing customers, investors will be better able to judge the probability that cash will be converted into future earnings. Conversely, an overpriced acquisition or delayed integration could cause the company’s current financial advantage to result in a loss of shareholder value. The key issue is not completion of M&A itself, but whether it generates returns above the cost of capital.
5. Financial Position, ROIC, and Net Cash
Share-Price Valuation Remains Low Relative to Capital Efficiency
At the end of August 2026, cash and deposits were 3.498 billion yen, shareholders’ equity was 4.283 billion yen, and the equity ratio was 77.1%. Interest-bearing debt consisted mainly of lease liabilities, with approximately 1 million yen current and 3 million yen noncurrent. Net cash was 3.498 billion yen on a borrowings-only basis and 3.494 billion yen on a conservative basis including lease liabilities. Conservative net cash declined by approximately 288 million yen from 3.782 billion yen at the end of May 2026. Because the company did not prepare a cash flow statement for the first quarter, we avoid speculating on the detailed breakdown. However, it includes 177 million yen of dividend payments and tax payments, among other items.
We estimate FactSet-approximate ROIC at 13.8%. LTM profit attributable to owners of the parent is approximately 564 million yen, calculated by subtracting prior-year first-quarter net income of 155 million yen from fiscal May 2026 net income of 591 million yen and adding first-quarter net income of 128 million yen for the current year. Average invested capital is approximately 4.094 billion yen, based on shareholders’ equity and noncurrent lease liabilities at the end of August 2025 and August 2026. Although this is slightly lower than the 14% range at the previous fiscal year-end, we believe it remains above the cost of capital.
At a share price of 1,841 yen, market capitalization is 5.350 billion yen. After subtracting conservative net cash of 3.494 billion yen, the equity market values the underlying business at about 1.856 billion yen. Compared with the company-forecast profit attributable to owners of parent of 679 million yen, the net-cash-adjusted PER is only 2.7 times. The adjusted PER has risen since July because the net-cash ratio has declined to 65%, but the valuation of the underlying business’s earnings power remains low.
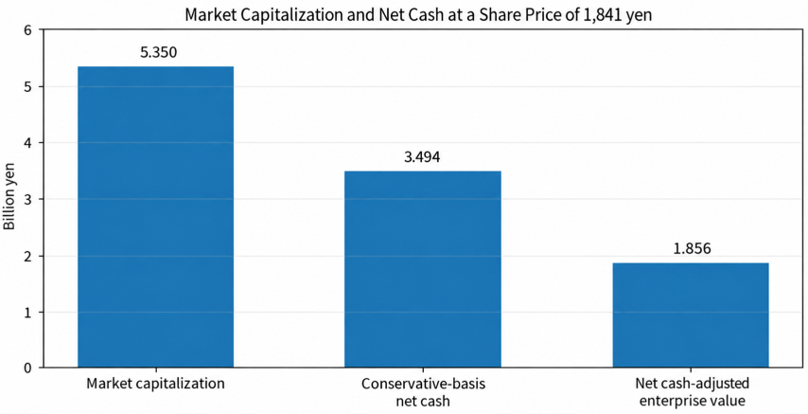
Figure 2 Market Capitalization and Net Cash Source: Prepared by Omega Investment based on company disclosures, FactSet data, and a share price of 1,841 yen
6. Why Are PER and PBR Only 7.9 Times and 1.25 Times Despite ROE of 15.9%?
We believe the low share-price valuation reflects market concerns about the sustainability of earnings and capital allocation rather than profitability itself. First, operating profit declined in fiscal May 2025; fiscal May 2026 saw a profit recovery but missed the revenue plan; and fiscal May 2027 calls for a large 40.9% increase in operating profit. The market does not appear to assume earnings will grow in a straight line. Second, fiscal May 2027 earnings growth depends on a recovery in the Business Solutions business, while ERP project starts have been delayed.
Third, the view that CNS remains dependent on contract development and personnel utilization persists. Even if AI, U-Way, ServiceNow, ERP, and prime-contractor engagements grow, valuation multiples are unlikely to rise unless recurring revenue and repeatability are demonstrated sufficiently. Fourth, net cash improves financial safety, but it does not generate high returns while it remains in cash. Fifth, with a free-float ratio of 33.8% and institutional ownership of 0.28%, the shareholder structure makes it difficult for new capital to enter even when earnings are strong. Sixth, although a 2.0 billion yen M&A framework has been established, there is not yet a track record of converting that capital into earnings.
A re-rating therefore requires more than simply demonstrating high ROE. Earnings growth through ERP and AI needs to continue for several quarters, withdrawal from low-margin projects needs to appear in business-level gross margins, investment discipline for M&A needs to be demonstrated, and share liquidity needs to improve.
7. Sharp Share-Price Decline and Off-Auction Distribution
Distinguishing Near-Term Supply-Demand Pressure from Medium- to Long-Term Liquidity Improvement
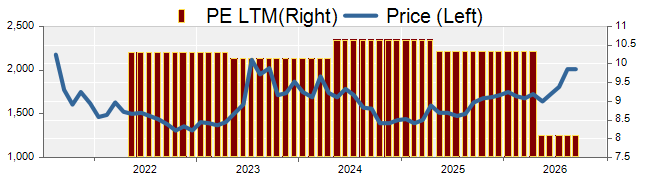
The shares recovered from 1,430 yen at the end of 2024 to 1,715 yen at the end of 2025, and rose further to 2,026 yen at the end of September 2026, supported by an earnings recovery in fiscal May 2026, expectations for higher dividends in fiscal May 2027, and the company’s capital allocation policy. On October 14, the shares traded as high as 2,060 yen and closed at 2,011 yen, but fell 8.5% to 1,841 yen on October 15, the day after the first-quarter results and the off-auction distribution were announced. Over the past five years, the shares have reacted not only to long-term earnings trends but also strongly to changes in margins, dividend increases, full-year outlooks, and share supply-demand conditions.
The results provided reasons to reset expectations for full-year earnings growth that had risen since July: operating profit was roughly flat year over year, ERP project starts were delayed, and the Consulting business came in slightly below the company’s expectations. At the same time, the off-auction distribution announced that day covers 100,000 shares, equivalent to approximately 3.4% of shares outstanding and around 10% of the current free float. Because the distribution price is determined by the closing price or final quotation on the business day before execution, selling can emerge even before the distribution as investors anticipate the discount and increased share supply. Therefore, it would be inappropriate to explain the decline solely as disappointment with the earnings results.
Over the medium to long term, the off-auction distribution should be viewed from a different angle. The shareholder base includes a high proportion of stable holdings by the founder, management, the employee shareholding association, and business partners. FactSet data indicate that identified shareholders account for 66.5%, free float is 33.8%, and institutional ownership is 0.28%. A large stable shareholder base facilitates long-term investment, but it also makes it difficult for institutional investors to build meaningful positions. The distribution creates a near-term supply burden, but it also helps implement the shareholder-base optimization and liquidity-improvement policy announced in July. If trading volume and the number of new shareholders increase after the distribution, the liquidity discount could narrow.
8. Valuation
The Market is Pricing in EPS Growth Below Historical Levels
At a share price of 1,841 yen, company-forecast EPS of 233.66 yen implies a forward PER of 7.9 times, the latest BPS of 1,473.96 yen implies a PBR of 1.25 times, and the forecast dividend of 70 yen implies a dividend yield of 3.8%. Forecast ROE is 15.9% based on a simplified calculation. Despite ROE well above 10%, PBR remains in the low-1x range.
Using a simplified dividend-discount model with a payout ratio of approximately 30%, the EPS growth rate embedded in the share price is approximately 6.0%, assuming a required equity return of 10.0%. At required returns of 9.0% and 11.0%, the implied growth rates are approximately 5.0% and 6.9%, respectively. EPS increased from 134.25 yen in fiscal May 2021 to 203.31 yen in fiscal May 2026, a five-year CAGR of approximately 8.7%, meaning the current share price does not require growth above the historical record. Compared with the company’s forecast EPS growth of 14.9% for fiscal May 2027, the market appears to be pricing in a slowdown in earnings growth beyond the company plan.
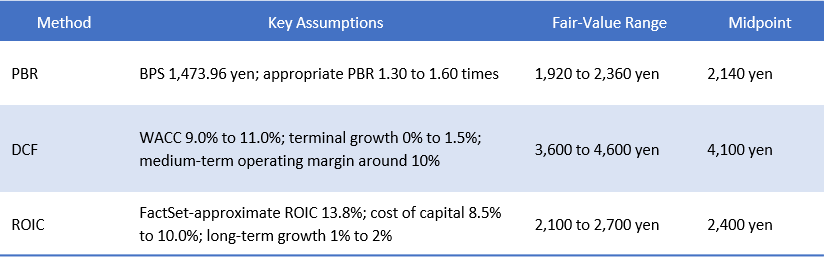
The three approaches produce midpoints of 2,140 yen under PBR, 4,100 yen under DCF, and 2,400 yen under ROIC, with the median of these three midpoints at approximately 2,400 yen. DCF tends to produce a higher value because net cash represents a large share of total value, so we do not use it as a stand-alone price target. For the investment view, we place greater weight on a practical central range of approximately 2,100 yen to 3,000 yen. From the current share price of 1,841 yen, this represents upside of approximately 14% to the bottom of the central range and about 30% to the median of the three valuation midpoints. We set the central range slightly below the range shown in July to reflect the delay in the ERP ramp-up and the decline in net cash.
9. Re-Rating Triggers and Items to Monitor in the Next Earnings Release
The most important condition for a re-rating is ERP execution. Progress needs to move from certifications and organizational preparation to project starts, order values, revenue recognition, and gross-margin improvement. If concrete project starts are shown in the second quarter and the Business Solutions business gross profit increases materially from the third quarter, confidence in the planned 40.9% increase in full-year operating profit should strengthen.
The second condition is the Business Solutions business gross margin, which recovered to 20.0% this quarter. If it remains in the 20% range in the second quarter and approaches the company plan of 23.0% in the third quarter, it will be easier to conclude that withdrawal from low-margin projects and improvement in project mix are structural. The third condition is AI. If customer-facing AI revenue expands while gross profit generated per person improves through internal use of generative AI, the shift toward a value-providing model will begin to appear in the financial results.
The fourth condition is M&A. If the company acquires an IT consulting or ERP implementation support company at an appropriate price and demonstrates post-acquisition ROIC above the cost of capital, the discount applied to excess cash should narrow. The fifth is the next medium-term management plan. If the company quantifies its approach to ROE, ROIC, minimum cash holdings, M&A, dividends, and share repurchases, the market’s view of capital allocation could change.
Revenue and operating profit alone will not be sufficient in the next earnings release. We will monitor the Business Solutions gross margin, the status of ERP project starts, Technology Solutions AI revenue and maintenance of a gross margin in the 28% range, the recovery in Consulting orders, the amount of system renewal expenses incurred, and productivity from the use of generative AI.
10. Conclusion
In the first quarter, growth continued in Technology Solutions, led by AI and ServiceNow, while the Business Solutions gross margin, which had been a concern, improved to 20.0%. Meanwhile, ERP project starts were delayed, and Consulting also came in slightly below the company’s expectations. The results did not materially increase confidence in the company plan, but they also did not indicate deterioration in the high-margin businesses.
We believe the sharp share-price decline on October 15 reflected both a reset of expectations following the results and concern about near-term share supply-demand conditions after the off-auction distribution announcement. Although the shares in the distribution are not sold directly into the regular trading session on the day after the announcement, selling can occur as investors anticipate future share supply and the distribution discount. Over the longer term, however, the measure can improve free float and liquidity, so the near-term share-price decline should be distinguished from its medium- to long-term implications for capital-market valuation.
At a share price of 1,841 yen, the forward PER is 7.9 times, PBR is 1.25 times, forecast ROE is 15.9%, FactSet-approximate ROIC is 13.8%, and the net-cash-adjusted PER is 2.7 times. Even with a cautious view of the ERP ramp-up, the share-price valuation of the underlying business’s earnings power remains low. A re-rating will require improvement in the Business Solutions gross margin, the start of ERP projects, improvement in both revenue and productivity through AI, and disciplined M&A. We maintain our Bullish investment view.
Notes
- The share price is the October 15, 2026 closing price of 1,841 yen. Forecast EPS of 233.66 yen and the forecast dividend of 70 yen are the company’s full-year forecasts for fiscal May 2027. The latest BPS of 1,473.96 yen is as of the end of August 2026. The forecast ROE of 15.9% is a simplified calculation obtained by dividing forecast EPS by the latest BPS.
- Market capitalization is calculated by multiplying the share price of 1,841 yen by 2,906,000 shares outstanding. Forward PER, PBR, dividend yield, and net-cash-adjusted PER are Omega Investment calculations.
- FactSet-approximate ROIC of 13.8% is an earnings-release-based estimate calculated by dividing LTM net income attributable to owners of the parent by the sum of average shareholders’ equity and average noncurrent lease liabilities. If a FactSet value becomes available later, the FactSet value will take precedence.
- Net cash is calculated as cash and deposits less interest-bearing debt. At the end of August 2026, net cash was 3.498 billion yen on a borrowings-only basis and 3.494 billion yen on a conservative basis including lease liabilities. At the end of May 2026, the corresponding figures were 3.787 billion yen and 3.782 billion yen.
- Financial data are based in principle on FactSet standardized data and therefore may not fully match the presentation items, reclassifications, rounding, or business-level disclosures in company materials. Company materials take precedence for business-level figures, KPIs, medium-term plans, and capital-allocation policies.
- Fair values are Omega Investment estimates based on certain assumptions and do not guarantee future share prices or corporate value. Because DCF tends to produce a higher value than the other methods when net cash represents a large share of value, it is not used as a stand-alone price target.
Key stock price data
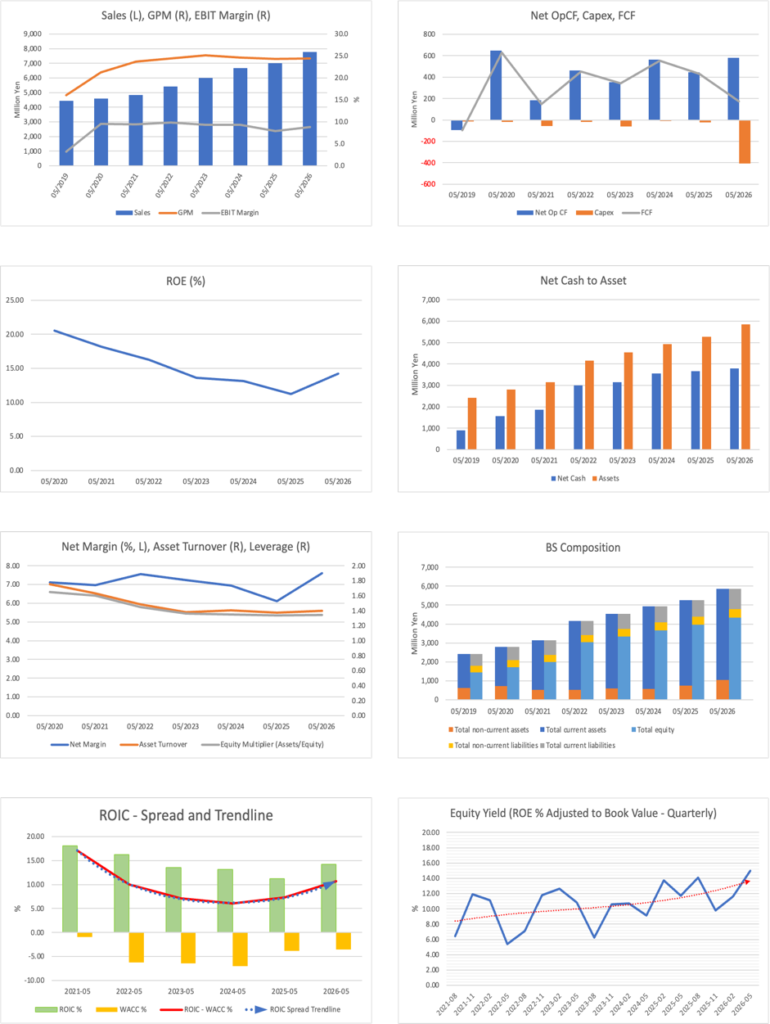
Company profile
CNS is an independent IT services company founded in 1985 and listed on the Tokyo Stock Exchange Growth Market. It supports corporate operational efficiency and DX initiatives using advanced technologies such as cloud and AI. Beginning in fiscal May 2026, the company reorganized its activities into three businesses: Technology Solutions, Business Solutions, and Consulting. Technology Solutions covers ServiceNow, AI, systems infrastructure, and cloud utilization; Business Solutions covers systems for financial institutions, retail and distribution, U-Way, and ERP; and Consulting covers DX strategy, business-process reform, and digital and AI talent development.
The head office is located on the 5th floor of the Shin-Meguro Tokyu Building, 2-25-2 Kamiosaki, Shinagawa-ku, Tokyo. Capital is 478.77 million yen, and consolidated employees totaled 258 at the end of fiscal May 2026. The consolidated subsidiary is CNS Hokkaido Co., Ltd. The company envisions revenue of 15.0 billion yen and an operating margin of 12% in fiscal May 2030. It is currently advancing Stage 2 of its medium-term management plan, which ends in fiscal May 2027. It aims to combine organic growth with M&A and alliances.
Key financial data
| Unit: million yen | 2023/5 | 2024/5 | 2025/5 | 2026/5 | 2027/5 CE |
| Sales | 5,989 | 6,657 | 7,005 | 7,774 | 9,278 |
| EBIT | 559 | 620 | 555 | 685 | 966 |
| Pretax Income | 589 | 636 | 583 | 772 | |
| Net Profit Attributable to Owner of Parent | 433 | 461 | 427 | 591 | 679 |
| Cash & Short-Term Investments | 3,163 | 3,574 | 3,667 | 3,787 | |
| Total assets | 4,547 | 4,934 | 5,260 | 5,857 | |
| Total Debt | 13 | 11 | 8 | 5 | |
| Net Debt | -3,150 | -3,563 | -3,659 | -3,782 | |
| Total liabilities | 1,206 | 1,262 | 1,300 | 1,524 | |
| Total Shareholders’ Equity | 3,341 | 3,672 | 3,959 | 4,332 | |
| Net Operating Cash Flow | 353 | 565 | 444 | 580 | |
| Capital Expenditure | 59 | 11 | 24 | 405 | |
| Net Investing Cash Flow | -126 | -81 | -269 | -299 | |
| Net Financing Cash Flow | -133 | -134 | -142 | -221 | |
| Free Cash Flow | 344 | 554 | 429 | 175 | |
| ROA (%) | 9.96 | 9.73 | 8.38 | 10.63 | |
| ROE (%) | 13.58 | 13.16 | 11.20 | 14.25 | |
| EPS (Yen) | 149.0 | 158.8 | 147.1 | 203.3 | 233.7 |
| BPS (Yen) | 1,149.7 | 1,263.5 | 1,362.5 | 1,490.8 | |
| Dividend per Share (Yen) | 45.00 | 48.00 | 75.00 | 61.00 | 70.00 |
| Shares Outstanding (Million shares) | 2.91 | 2.91 | 2.91 | 2.91 |
Source: Calculated by Omega Investment based on FactSet’s standard criteria, rounded to the nearest whole number.
Share price
Financial data (quarterly basis)
| Unit: million yen | 2025/5 | 2026/5 | 2027/5 | ||||||
| 1Q | 2Q | 3Q | 4Q | 1Q | 2Q | 3Q | 4Q | 1Q | |
| (Income Statement) | |||||||||
| Sales | 1,645 | 1,720 | 1,823 | 1,818 | 1,875 | 1,879 | 1,965 | 2,057 | 2,037 |
| Year-on-year | -0.1% | 4.2% | 8.3% | 8.4% | 14.0% | 9.2% | 7.8% | 13.1% | 8.7% |
| Cost of Goods Sold (COGS) | 1,266 | 1,294 | 1,368 | 1,370 | 1,386 | 1,414 | 1,497 | 1,574 | 1,527 |
| Gross Income | 378 | 425 | 455 | 448 | 488 | 465 | 467 | 483 | 510 |
| Gross Income Margin | 23.0% | 24.7% | 24.9% | 24.7% | 26.0% | 24.7% | 23.8% | 23.5% | 25.0% |
| SG&A Expense | 298 | 279 | 260 | 314 | 306 | 296 | 271 | 344 | 327 |
| EBIT (Operating Income) | 80 | 146 | 195 | 134 | 182 | 168 | 196 | 139 | 182 |
| Year-on-year | -43.6% | -19.5% | 3.0% | 24.9% | 127.5% | 15.0% | 0.5% | 3.4% | 0.2% |
| Operating Income Margin | 4.8% | 8.5% | 10.7% | 7.4% | 9.7% | 9.0% | 10.0% | 6.8% | 9.0% |
| EBITDA | 88 | 155 | 209 | 150 | 195 | 184 | 218 | 165 | 203 |
| Pretax Income | 81 | 160 | 202 | 140 | 229 | 177 | 210 | 156 | 192 |
| Consolidated Net Income | 55 | 107 | 137 | 128 | 155 | 119 | 142 | 176 | 128 |
| Minority Interest | 0 | 0 | 0 | 0 | 0 | 0 | 0 | 0 | 0 |
| Net Income ATOP | 55 | 107 | 137 | 128 | 155 | 119 | 142 | 176 | 128 |
| Year-on-year | -38.4% | -18.2% | 5.5% | 15.3% | 181.6% | 10.8% | 3.1% | 37.4% | -17.4% |
| Net Income Margin | 3.3% | 6.2% | 7.5% | 7.0% | 8.3% | 6.3% | 7.2% | 8.5% | 6.3% |
| (Balance Sheet) | |||||||||
| Cash & Short-Term Investments | 3,372 | 3,382 | 3,355 | 3,667 | 3,479 | 3,657 | 3,304 | 3,787 | 3,498 |
| Total assets | 4,732 | 5,005 | 4,946 | 5,260 | 5,172 | 5,831 | 5,428 | 5,857 | 5,559 |
| Total Debt | 10 | 9 | 9 | 8 | 7 | 6 | 6 | 5 | 5 |
| Net Debt | -3,362 | -3,372 | -3,346 | -3,659 | -3,472 | -3,651 | -3,298 | -3,782 | -3,494 |
| Total liabilities | 1,145 | 1,311 | 1,114 | 1,300 | 1,275 | 1,816 | 1,271 | 1,524 | 1,275 |
| Total Shareholders’ Equity | 3,587 | 3,694 | 3,832 | 3,959 | 3,896 | 4,015 | 4,157 | 4,332 | 4,283 |
| (Profitability %) | |||||||||
| ROA | 9.34 | 8.38 | 8.54 | 8.38 | 10.65 | 9.94 | 10.47 | 10.58 | 10.52 |
| ROE | 12.40 | 11.32 | 11.10 | 11.20 | 14.09 | 13.98 | 13.60 | 14.25 | 13.80 |
| (Per-share) Unit: JPY | |||||||||
| EPS | 18.9 | 36.9 | 47.3 | 44.0 | 53.3 | 40.9 | 48.8 | 60.4 | 44.1 |
| BPS | 1,234.4 | 1,271.3 | 1,318.6 | 1,362.5 | 1,340.8 | 1,381.7 | 1,430.5 | 1,490.8 | 1,474.0 |
| Dividend per Share | 0.00 | 0.00 | 0.00 | 75.00 | 0.00 | 0.00 | 0.00 | 61.00 | 0.00 |
| Shares Outstanding (million shares) | 2.91 | 2.91 | 2.91 | 2.91 | 2.91 | 2.91 | 2.91 | 2.91 | 2.91 |
Source: Calculated by Omega Investment based on FactSet’s standard criteria, rounded to the nearest whole number.
Financial data (full-year basis)
| Unit: million yen | 2022/5 | 2023/5 | 2024/5 | 2025/5 | 2026/5 |
| (Income Statement) | |||||
| Sales | 5,419 | 5,989 | 6,657 | 7,005 | 7,774 |
| Year-on-year | 11.9% | 10.5% | 11.1% | 5.2% | 11.0% |
| Cost of Goods Sold | 4,097 | 4,483 | 5,018 | 5,298 | 5,871 |
| Gross Income | 1,322 | 1,506 | 1,639 | 1,707 | 1,903 |
| Gross Income Margin | 24.4% | 25.1% | 24.6% | 24.4% | 24.5% |
| SG&A Expense | 789 | 947 | 1,019 | 1,151 | 1,218 |
| EBIT (Operating Income) | 533 | 559 | 620 | 555 | 685 |
| Year-on-year | 16.4% | 4.8% | 10.9% | -10.4% | 23.4% |
| Operating Income Margin | 9.8% | 9.3% | 9.3% | 7.9% | 8.8% |
| EBITDA | 559 | 589 | 654 | 601 | 763 |
| Pretax Income | 595 | 589 | 636 | 583 | 772 |
| Consolidated Net Income | 409 | 433 | 461 | 427 | 591 |
| Minority Interest | 0 | 0 | 0 | 0 | 0 |
| Net Income ATOP | 409 | 433 | 461 | 427 | 591 |
| Year-on-year | 21.6% | 5.8% | 6.5% | -7.4% | 38.3% |
| Net Income Margin | 7.6% | 7.2% | 6.9% | 6.1% | 7.6% |
| (Balance Sheet) | |||||
| Cash & Short-Term Investments | 3,010 | 3,163 | 3,574 | 3,667 | 3,787 |
| Total assets | 4,152 | 4,547 | 4,934 | 5,260 | 5,857 |
| Total Debt | 6 | 13 | 11 | 8 | 5 |
| Net Debt | -3,004 | -3,150 | -3,563 | -3,659 | -3,782 |
| Total liabilities | 1,113 | 1,206 | 1,262 | 1,300 | 1,524 |
| Total Shareholders’ Equity | 3,039 | 3,341 | 3,672 | 3,959 | 4,332 |
| (Cash Flow) | |||||
| Net Operating Cash Flow | 461 | 353 | 565 | 444 | 580 |
| Capital Expenditure | 19 | 59 | 11 | 24 | 405 |
| Net Investing Cash Flow | -23 | -126 | -81 | -269 | -299 |
| Net Financing Cash Flow | 634 | -133 | -134 | -142 | -221 |
| Free Cash Flow | 442 | 294 | 554 | 420 | 175 |
| (Profitability ) | |||||
| ROA (%) | 11.23 | 9.96 | 9.73 | 8.38 | 10.63 |
| ROE (%) | 16.27 | 13.58 | 13.16 | 11.20 | 14.25 |
| Net Margin (%) | 7.56 | 7.23 | 6.93 | 6.10 | 7.60 |
| Asset Turn | 1.49 | 1.38 | 1.40 | 1.37 | 1.40 |
| Assets/Equity | 1.45 | 1.36 | 1.35 | 1.34 | 1.34 |
| (Per-share) Unit: JPY | |||||
| EPS | 145.5 | 149.0 | 158.8 | 147.1 | 203.3 |
| BPS | 1,045.7 | 1,149.7 | 1,263.5 | 1,362.5 | 1,490.8 |
| Dividend per Share | 45.00 | 45.00 | 48.00 | 75.00 | 61.00 |
| Shares Outstanding (million shares) | 2.91 | 2.91 | 2.91 | 2.91 | 2.91 |
Source: Calculated by Omega Investment based on FactSet’s standard criteria, rounded to the nearest whole number.