2026-10-19
Home
Japanese

Omega Investment Co., Ltd.
Techno Ryowa (1965 : Price Discovery)
Buy
| Share price | Forecast EPS | Forecast PER | Actual BPS |
| 2,132 yen | 191.84 yen | 11.11 x | 1,098.54 x |
| Actual PBR | Forecast ROE | Forecast Dividend | Forecast Dividend Yield |
| 1.94 x | 17.46 % | 59.33 yen | 2.78 % |
Note: Share price, share count, EPS, BPS and dividend are all presented on a post-split basis, reflecting the 3-for-1 share split effective 1 October 2026. BPS is calculated by dividing the end-June 2026 figure of ¥3,295.63 by three. Forecast ROE = forecast EPS / latest BPS. Market capitalisation is based on the post-split number of shares issued (including treasury shares).
Conclusion
Structural improvements in profitability are not yet fully reflected in the share price
We rate the shares BUY. Investment in advanced air-conditioning facilities for the semiconductor and food industries, selective order intake and productivity improvements lifted the operating profit margin, with ROE reaching 19.8% in FY3/2026. Although the company forecasts flat performance this year, first-quarter orders rose 53.3%, supporting earnings from the following financial year onwards. Forecast PER of 11.1x and PBR of 1.94x reflect concerns over peak earnings, but we believe it would be excessively cautious to regard the high profit margins as entirely temporary. Nevertheless, a reversal in construction profitability, the timing of conversion from orders to sales, capital efficiency including strategic shareholdings and pension assets, and the high proportion of stable shareholders are clear risks.
Profile
High-value-added facilities construction centred on precision air-conditioning for industry
Established in 1949, Techno Ryowa is a comprehensive building-services contractor. Its activities centre on facilities requiring stringent cleanliness, temperature, and humidity control, including semiconductor, pharmaceutical, and food manufacturing plants, and encompass the design and construction of cleanrooms and air-conditioning and sanitary facilities, air-conditioning for general buildings, electrical installation work, and the sale of refrigeration and heating equipment. Its competitive advantage comes from capturing added value through specialist technology, construction quality, and project management rather than merely expanding construction volume. Consolidated sales mix by business in FY3/2026 (approximate business profit margins before deduction of company-wide general and administrative expenses) was: Industrial Facilities Construction 66.8% (26.0%), General Building Facilities Construction 28.8% (24.6%), Electrical Facilities Construction 2.9% (not calculated), Refrigeration and Heating Equipment Sales 1.3% (not calculated), and Other 0.1% (not calculated). Combined profit is disclosed for several businesses, including the last two, but operating profit margins for the individual businesses are not disclosed.
Stock Hunter’s View
A “total environmental engineering” company. Higher orders from semiconductor and food plants are contributing to earnings.
Techno Ryowa, established in 1949, is a mid-sized air-conditioning contractor. Under its slogan “Air and Water Technology”, it undertakes total engineering of environmental control facilities related to air and water in buildings, including precision air-conditioning such as cleanrooms, refrigeration and cold-storage systems, and water-treatment systems. Its construction track record spans a wide range of facilities, from production and manufacturing facilities such as pharmaceutical manufacturing plants and food production factories to medical facilities such as hospitals, educational facilities, commercial facilities and offices. In recent years, it has benefited substantially from semiconductor plant construction.
For FY3/2027, the company plans sales of ¥100.0bn (up 1.3% year on year) and operating profit of ¥16.0bn (up 1.5%), essentially flat year on year. The company explains that large projects made a substantial contribution in the previous year and that, although the current order backlog remains high, many large projects are not scheduled for completion until the following financial year or later.
Meanwhile, the company expects to secure profits across its projects this year rather than depending on specific projects. The recently announced first-quarter (April–June) results confirmed a strong start, with sales up 9.1% and operating profit up 21.1%. It secured several large semiconductor- and food-related projects as well as a large resort-related project in the General Building Facilities Construction business, lifting orders by 53% year on year.
Investor’s View
Established high ROIC and earnings growth warrant a positive view, with upside potential for the shares
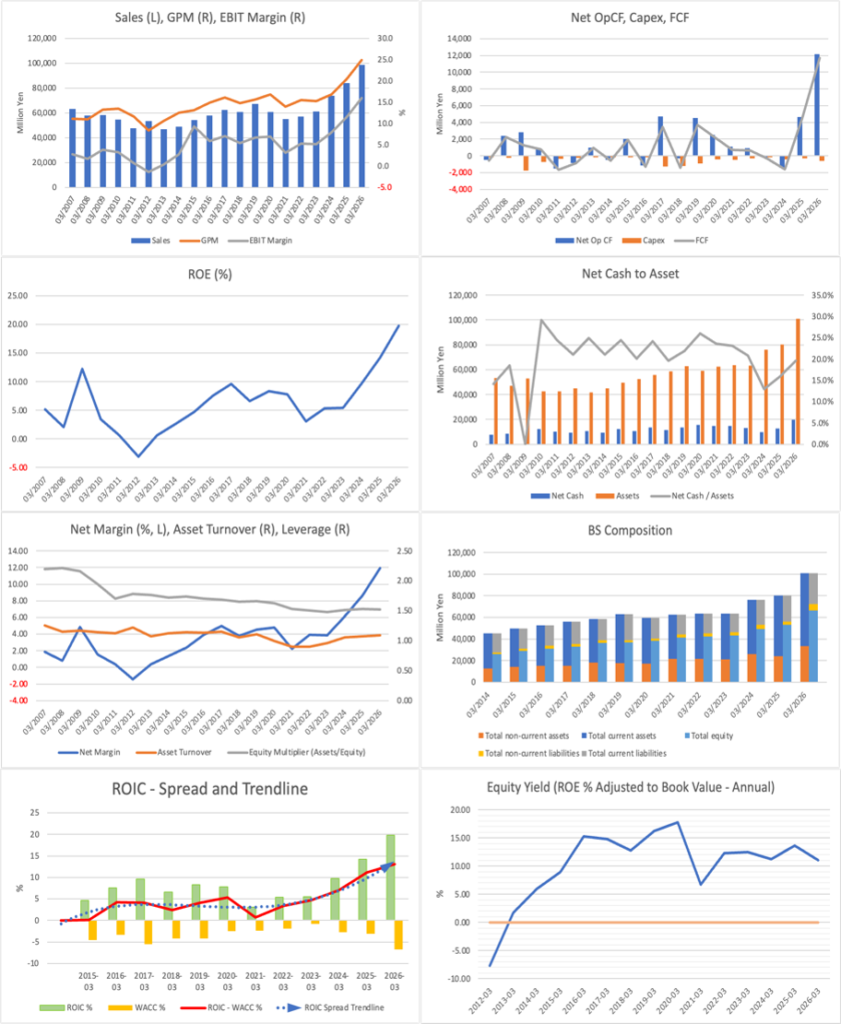
The improvement in profitability cannot be explained by sales volumes alone; the fundamental drivers are better pricing, project mix and construction productivity. Sales rose 17.2% to ¥98.68bn in FY3/2026, while operating profit increased 63.7% to ¥15.76bn and the operating margin rose from 11.4% to 16.0%. The company attributes profit growth to higher sales and improved productivity, explaining that construction profit increased by ¥5.25bn in Industrial Facilities Construction and ¥2.24bn in General Building Facilities Construction, while higher general and administrative expenses reduced profit by ¥1.48bn. Given the contribution from large, highly profitable projects, a 16% operating margin should not be assumed to represent a long-term normalised level. However, some improvements in profitability management are sustainable.
We believe the widening of the ROIC–WACC spread since FY3/2021 reflects growth in profits from core operations and relative restraint in invested capital.
ROIC has risen not only because of a lower cost of capital, but also because of greater focus on technically demanding projects, higher gross profit margins on completed construction work, and the asset-light nature of the construction business. The marked widening into positive territory in FY3/2026 is notable, but as the level depends on the definition of ROIC and the estimate of WACC, we place greater emphasis on sustained generation of excess returns than on the absolute figure. Looking ahead, maintaining the spread will depend on the ability to pass higher labour and subcontracting costs through to prices while sustaining engineers’ utilisation rates.
The improvement in ROE since FY3/2023 has been achieved through stronger underlying profitability, rather than higher asset turnover or financial leverage.
Net profit rose to ¥11.80bn in FY3/2026 (from ¥7.26bn the previous year), the net margin to 12.0% (from 8.6%) and ROE to 19.8% (from 14.2%). The improvement in gross margin from 20.7% to 25.4% was central to the increase in profitability, and we rate highly the improvement in ROE that was not dependent on borrowing. However, the company forecasts flat net profit of ¥11.8bn for FY3/2027, while forecast ROE calculated using the simplified method based on the latest BPS is 17.46%, suggesting a temporary decline in capital efficiency.
The sharp rise in total assets in FY3/2026 requires a distinction between increased working capital associated with business expansion and valuation gains on financial and pension-related assets.
Total assets increased by ¥20.71bn, from ¥80.16bn to ¥100.87bn. The main increases were cash and deposits of ¥6.66bn, electronically recorded monetary claims of ¥2.42bn, receivables from completed construction work and related items of ¥1.72bn, investment securities of ¥4.26bn and retirement benefit assets of ¥4.38bn. The last two do not directly indicate an increase in construction capacity and are affected by equity markets and pension actuarial assumptions. The treatment of surplus assets is important in assessing the sustainability of ROE and shareholder value.
The sharp rise in free cash flow reflects a combination of profit growth and the timing effects of advance payments and consumption-tax payments.
In FY3/2026, operating cash flow was ¥12.15bn (¥4.65bn in the preceding year) and investing cash flow was negative ¥0.94bn (negative ¥0.16bn), giving FCF, defined as operating plus investing cash flow, of approximately ¥11.21bn (approximately ¥4.49bn previously). A ¥6.55bn increase in profit before tax, a ¥2.88bn increase in advances received on uncompleted construction contracts and the year-on-year change in consumption-tax-related items supported cash generation. These were partly offset by a ¥4.15bn increase in trade receivables and a ¥3.12bn decrease in trade payables. Although high earnings should continue to underpin cash flow in FY3/2027, timing differences in advances received and taxes are unlikely to recur consistently, and we do not assume FCF of around ¥11bn every year.
The share-price rise over CY2023–25 reflected both the increasing visibility of earnings growth and a re-rating from a low-PBR stock to a high-ROE stock.
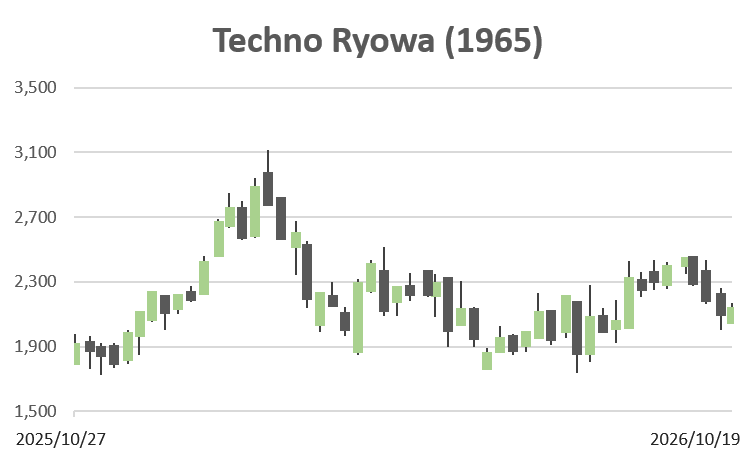
In 2026, however, the share price declined from a high of ¥3,113 on 10 February to ¥1,737 on 30 July, before closing at ¥2,132 on 21 October (split-adjusted share prices). A valuation normalisation following the sharp rally, the company’s flat FY3/2027 forecast, and concerns over the cyclical nature of semiconductor capital expenditure are plausible explanations. However, it is not possible to establish the cause of individual share-price movements. The current forecast PER of approximately 11.1x reflects considerable scepticism about the sustainability of high profitability. It is attractive to investors who believe that some of last year’s profit-margin improvement is structural.
The substantial stable shareholder base is both a strength and a weakness of the shareholder distribution.
According to FactSet shareholder data as of 21 October 2026, insiders accounted for 52.49%, institutional investors 12.62% and the free float 47.5%; the business partners’ shareholding association held 10.01%, Mitsubishi Heavy Industries 6.71%, and major financial institutions also ranked among the largest shareholders. While this supports long-term customer relationships, market pressure to improve capital discipline and liquidity may be weaker. Reducing strategic shareholdings, pursuing ongoing share buybacks and cancellations, and demonstrating the results of investment in people and digital transformation would further increase the scope for improved shareholder value recognition.
Financials and Valuations
| Metric | FY3/2025 | FY3/2026 | FY3/2027 forecast |
| Sales (¥bn) | 84.19 | 98.68 | 100.00 |
| Operating Profit (¥bn) | 9.63 | 15.76 | 16.00 |
| Operating Margin | 11.4% | 16.0% | 16.0% |
| Net Profit (¥bn) | 7.26 | 11.80 | 11.80 |
| ROE | 14.2% | 19.8% | 17.46%* |
| Operating CF (¥bn) | 4.65 | 12.15 | — |
| FCF (¥bn)** | 4.49 | 11.21 | — |
*Forecast ROE is calculated using the simplified method based on the latest BPS. **FCF = operating cash flow + investing cash flow. Figures are converted into ¥bn and rounded.
Price

PBR (LTM)

PER (LTM)

ROE (LTM)

EPS (LTM)

BPS (LTM)
