2026-09-14
Home
Japanese

Omega Investment Co., Ltd.
Toyo Tanso (5310 : Price Discovery)
Buy
| Share Price | Forecast EPS | Forecast PER | Actual BPS |
| 7,870 yen | 238.41 yen | 33.0 x | 4,652.03 yen |
| Actual PBR | Forecast ROE | Forecast Dividend | Forecast Dividend Yield |
| 1.69 x | 5.1 % | 145 yen | 1.84 % |
Conclusion
BUY : Invest in the recovery in orders and tangible demand for high-temperature gas-cooled reactors, subject to renewed improvement in capital efficiency
We rate Toyo Tanso BUY. After a correction in 2024–2025, the share price rebounded sharply in 2026, and a forecast PER of 33.0x is by no means cheap relative to current earnings. However, barriers to entry stemming from the quality of its isostatic graphite, high-purification technology, long-standing relationships with semiconductor customers and irradiation data for nuclear-grade graphite should allow a recovery in orders, planned price revisions for orders received from October and progress on high-temperature gas-cooled reactor projects to lift medium-term earnings. The sharp fall in ROE in 2025 was primarily attributable to a deterioration in sales mix and higher depreciation charges, and we do not judge the erosion of value to be permanent. Nevertheless, the pressure that upfront investment places on cash flow and ROIC is significant; capacity utilisation from 2027 onwards, conversion of orders into sales and improvement in ROE will be the key tests of the positive investment view.
Profile
A high-performance materials manufacturer spanning semiconductors and next-generation nuclear power, centred on isostatic graphite technology
Toyo Tanso focuses on the development, manufacture and processing of isostatic graphite, distinguished by its uniformity, high purity and heat resistance, and supplies components for silicon and SiC semiconductor manufacturing equipment, industrial furnaces, electrical discharge machining, mechanical and electrical carbon products, C/C composites, SiC-coated graphite and graphite for high-temperature gas-cooled reactors worldwide. The company performs processes in-house, from manufacturing large graphite blocks to precision machining and purification, turning customer qualification and a long track record into competitive strength. The breakdown of sales by product for the latest full year (FY12/2025) was Special Graphite Products 44.0% (operating profit margin by product not disclosed), General Carbon Products – Mechanical Applications 9.1% (not disclosed), General Carbon Products – Electrical Applications 9.4% (not disclosed), Composite Materials and Other Products 33.2% (not disclosed) and Merchandise 4.3% (not disclosed). The consolidated operating profit margin was 14.6%.
Stock Hunter’s View
Growth driven by both semiconductors and nuclear reactors; SMR projects to take shape next year
Toyo Tanso is a pioneer in graphite products. It was the first in the industry to develop “isostatic graphite”, which offers excellent thermal and electrical conductivity, high resistance to heat and chemicals, light weight and ease of machining, and low friction and wear. It is used across a wide range of industries, particularly in nuclear power, electrical discharge machining and semiconductors.
The company holds the world’s leading share of 40% in crucibles for single-crystal silicon production and has an established track record in graphite materials for next-generation nuclear reactors. Recently, orders for highly profitable products in Special Graphite Products and Composite Materials and Other Products have been strong, and orders received in the recently announced first-half (January–June) results for the current December year-end reached a record level. The main reasons were the completion of production adjustments for silicon wafers, an improvement in the EV market for SiC semiconductors and increased AI-related demand. In addition, the company plans to raise prices for all carbon-related products by 10–15% in stages for orders received from October, which is expected to contribute to earnings.
Graphite products for high-temperature gas-cooled reactors will also begin to contribute from next year onwards. Approval procedures for four SMRs (small modular reactors for nuclear power generation) planned for installation at Dow’s plant in Texas are currently in their final stages. If progress remains on track, construction is expected to be approved around Q1 2027 (January–March).
Investor’s View
The shift towards higher value added is genuine, but returns on growth investment will be the next test for the share price
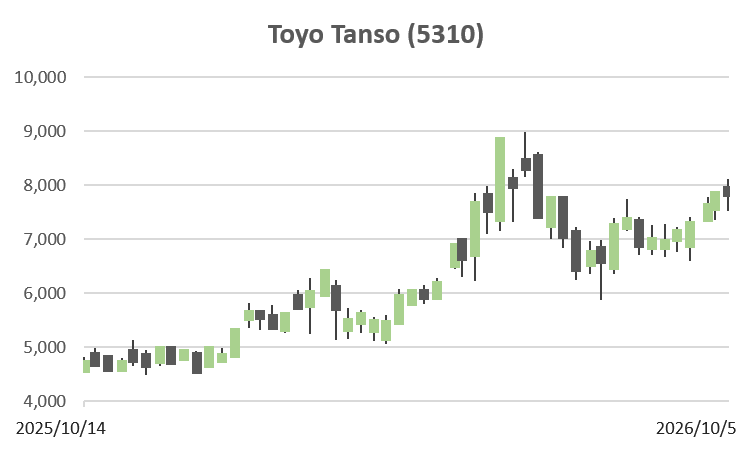
The market is valuing the likelihood of a recovery from 2027 onwards, rather than 2026 earnings. Following a period of high profitability in 2024, orders slowed in 2025 amid inventory adjustments related to semiconductors and SiC, while the share price also corrected in 2024–2025. In 2026, the shares rose from an early-year low of ¥4,825 on 5 January to ¥8,990 on 18 June, and the closing price of ¥7,870 on 9 October remained well above the year-to-date low. The share price led the way despite weak first-half 2026 results because the market appears to have begun pricing in the completion of the silicon wafer adjustment, AI-related applications, signs of recovery in SiC, price revisions and the monetisation of orders for high-temperature gas-cooled reactors. However, the timing and degree of certainty of these contributions differ, and they will not all be reflected in current-year earnings simultaneously.
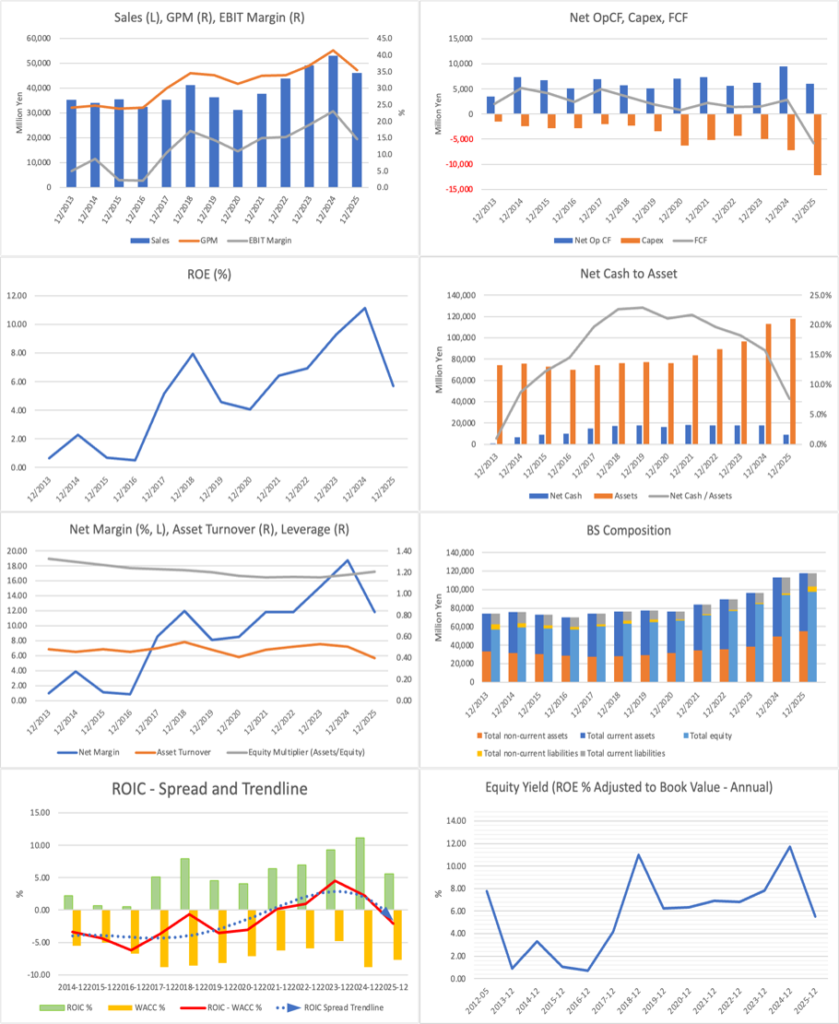
The divergence between the gross profit margin and operating profit margin highlights the importance of product mix and fixed-cost absorption rather than volume alone. During periods of sales growth, both gross and operating profit margins improved substantially, while margins fell sharply when demand slowed. Sales in FY12/2025 fell 13.0% from ¥53.093bn to ¥46.189bn, operating profit declined 44.8% from ¥12.238bn to ¥6.759bn, and the operating profit margin fell from 23.1% to 14.6%. The company identifies lower marginal profit (volumes and product mix) and higher depreciation charges as the principal causes. In H1 2026, sales were ¥22.370bn (down 2.7% year on year) and operating profit was ¥1.778bn (down 53.7%), indicating that the high breakeven point persists. Although Q2 alone improved relative to Q1, caution is warranted before declaring a full-scale recovery.
The sharp decline in ROE in 2025 reflected lower net profit margins, rather than inadequate financial leverage. Despite the financial stability afforded by a high equity ratio, ROE is strongly influenced by changes in profit margins. Net profit in FY12/2025 fell 45.1% from ¥9.960bn to ¥5.464bn, the net profit margin declined from 18.8% to 11.8%, and ROE halved from 11.2% to 5.7%. With total assets rising and asset turnover slowing, the high equity ratio provides financial resilience but also weighs on capital efficiency. The company’s target of 10% ROE in 2030 requires both an earnings recovery and improved asset efficiency.
The heavy capital expenditure has a strategic rationale, but only future cash generation can justify upfront investment. Capital expenditure has run ahead of operating cash flow, while invested capital has increased as returns have fallen. In FY12/2025, operating cash flow was ¥6.065bn against an investing cash outflow of ¥11.314bn, a simple difference of approximately negative ¥5.249bn. The main investment objectives are purification, SiC/TaC coating, global machining capacity and the supply infrastructure for next-generation nuclear power. A time lag exists between construction, customer qualification, operations, and the recovery of depreciation charges. The company’s plans for ¥37.5bn in capital expenditure over 2026–2030 and approximately 1.9x purification capacity following completion of the Iwaki facility in 2027 should ease supply constraints relative to demand. Conversely, if orders fall short of expectations, depressed ROIC could persist for longer.
The essence of the competitive advantage lies not in the graphite commodity market but in application-specific materials qualification and compatibility with high-temperature processes. Global graphite demand encompasses battery anode materials, steel and refractories, semiconductors and SiC, industrial furnaces and nuclear power, each with a different supply-demand structure. Therefore, it would be inappropriate to apply the overall graphite market growth rate directly to Toyo Tanso’s sales forecasts. In advanced applications, uniformity, purity, large-scale manufacturing, precision machining and a record of compatibility with customers’ equipment matter more than price. The ability to combine isostatic graphite with SiC coatings and C/C composites, along with irradiation data and a track record of adoption for the nuclear-grade IG-110 material, underpins differentiation in high-value-added applications. Meanwhile, the SiC business remains exposed to the EV market and excess supply in China, and AI demand should not be assumed to lift all semiconductor-related products uniformly.
Nuclear power could become a source of earnings distinct from the existing semiconductor cycle, but project approval and revenue recognition are separate matters. The 2026–2030 medium-term plan positions graphite for high-temperature gas-cooled reactors as a growth driver and describes the conclusion of advance-payment agreements covering four units for Dow and four for Energy Northwest with US-based X-energy. Long-term irradiation testing and a history of adoption are not easily replicated, but licensing, construction, material deliveries and revenue recognition proceed in stages. Prospective approval in early 2027 is viewed as a positive development, without assuming that revenue from all four units will be recognised immediately upon approval.
To justify the current PBR of 1.69x, earnings must recover above the company’s plan or capital policy must improve. A PER of 33.0x on company-forecast EPS of ¥238.41, together with ROE of approximately 5.1%, implies that the share price already incorporates considerable future expectations. The company forecasts full-year 2026 sales of ¥49.0bn, operating profit of ¥6.2bn and net profit of ¥5.0bn, requiring H2 operating profit of ¥4.422bn against ¥1.778bn in H1. The base case assumes an earnings recovery from 2027 onwards, driven by recovering demand and an improved product mix, although the rebound required in 2026 carries material execution risk. Achieving the 2030 targets of ¥18.0bn in operating profit, 10% ROE and a 40% benchmark payout ratio will require management of returns on capital expenditure projects, rationalisation of low-margin businesses, better inventory turnover and appropriate returns of surplus capital.
Financials and Valuations
Historical results and company forecasts (¥bn; EPS and dividends in ¥; ratios in %)
| Indicator | FY12/2024 Actual | FY12/2025 Actual | FY12/2026 Forecast |
| Sales | 530.93 | 461.89 | 490.00 |
| Operating Profit | 122.38 | 67.59 | 62.00 |
| Operating Profit Margin | 23.1% | 14.6% | 12.7% |
| Profit Attributable to Owners of Parent | 99.60 | 54.64 | 50.00 |
| Net Profit Margin | 18.8% | 11.8% | 10.2% |
| ROE (Actual / Simplified Forecast) | 11.2% | 5.7% | 5.1% |
| EPS | 474.95 | 260.58 | 238.41 |
| Dividend | 145 | 145 | 145 |
Price

PBR (LTM)

PER (LTM)

ROE (LTM)

EPS (LTM)

BPS (LTM)
