2026-10-14
Home
Japanese

Omega Investment Co., Ltd.
Uchida Yoko (Investment report – 4Q update)
| Share price (10/15) | ¥2,389 | Dividend Yield (27/7 CE) | 3.2 % |
| 52weeks high/low | ¥2,393/1,916 | ROE(26/7) | 16.0 % |
| Avg Vol (3 month) | 182.5 thou shrs | Operating margin (TTM) | 3.7 % |
| Market Cap | ¥124.46 bn | Beta (5Y Monthly) | 0.22 |
| Enterprise Value | ¥78.08 bn | Shares Outstanding | 52.096 mn shrs |
| PER (27/7 CE) | 11.2 X | Listed market | TSE Prime section |
| PBR (26/7 act) | 1.4 X |
| Click here for the PDF version of this page |
| PDF version |
Higher certainty that operating profit of 15.0 billion yen can be maintained after special demand. Market-driven share price decline increases entry appeal for medium- to long-term investors.
Investment View
Based on the analyst meeting materials, there is no need to change the medium- to long-term investment view on Uchida Yoko significantly from the recent 4Q Flash Report. Instead, because the Company provided a more detailed breakdown and background of its FY7/2027 company plan for operating profit of 15.0 billion yen, confidence in the view that a high profit level will remain after special demand has increased. The median fair value of 2,900 yen also remains unchanged. As a result, the share price decline has widened the upside potential to about 39%.
The most important point clarified at the analyst meeting is that FY7/2027 operating profit of 15.0 billion yen is not composed solely of remaining special demand in the Public Sector-related Business. The Public Sector-related Business is expected to post lower sales and profit due to a pullback in device-replacement demand associated with the GIGA School Initiative and work related to standardizing local government information systems. Meanwhile, the Office-related Business and the Information-related Business are planned to post higher sales and profit. In other words, the 15.0 billion yen plan for FY7/2027 is supported by private-sector ICT, office environmental construction, software licenses, SmartRooms, SmartOfficeNavigator, and a recovery in SI for small and medium-sized enterprises, while factoring in a pullback in Public-sector ICT.
FY7/2026 results were net sales of 425.7 billion yen, operating profit of 15.6 billion yen, and profit attributable to owners of parent of 12.5 billion yen, with net sales and all profit items reaching record highs. The Company explains these strong results not simply as the acquisition of special demand, but as an expansion in the ability to absorb special demand and an improvement in the baseline. This expression is important for investors. In the past, special demand related to the GIGA School Initiative, operating profit declined sharply after demand ran its course. However, this time the Company is planning operating profit of 15.0 billion yen in FY7/2027 even after factoring in the pullback from NEXT GIGA, the standardization of local government information systems, and Windows 10 replacement demand.
On the share price side, after the share price rebounded sharply immediately after the earnings announcement on September 3, it declined through September 11. Against the September 3 closing price of 2,347 yen, the September 11 closing price was 2,083 yen. This decline was not because the investment thesis specific to the Company had weakened; rather, it was largely due to market-wide risk aversion driven by heightened tensions in the Middle East, higher crude oil prices, and rising global interest rates. Meanwhile, the analyst meeting materials increased confidence in the medium-term profit base, while the share price alone declined due to market factors, increasing its appeal as an entry opportunity for investors with a medium- to long-term investment horizon.
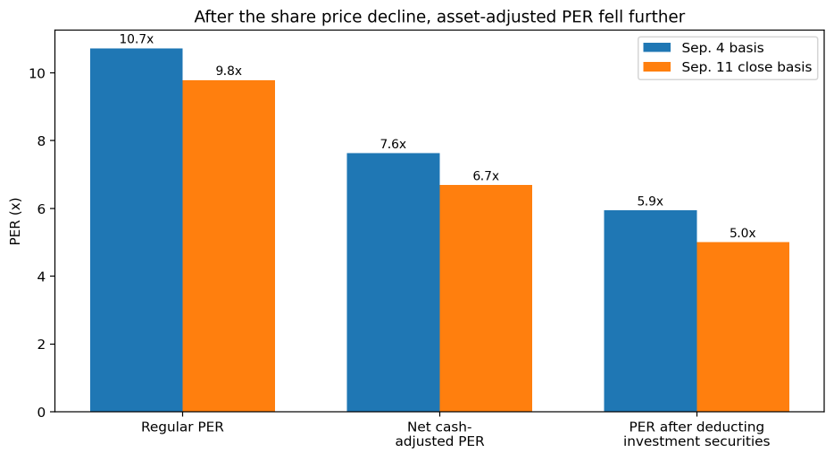
Based on the September 11 closing price of 2,083 yen, forecast EPS of 212.89 yen, actual BPS of 1,737.66 yen, and a forecast dividend of 76 yen, forecast PER is 9.8x, actual PBR is 1.20x, and forecast dividend yield is 3.6%. Forecast PER after deducting period-end net cash of 32.5 billion yen is approximately 6.7x, and adjusted PER after also deducting investment securities of 17.7 billion yen, after tax considerations, is approximately 5.0x.
In conclusion, we maintain a positive view on the shares as appropriate for medium- to long-term investment. The analyst meeting materials reinforced the thesis in the recent 4Q Flash Report: the Company should be evaluated not as a short-term special-demand stock, but as a company that raises its profit base by combining Public-sector ICT, private-sector ICT, and environmental construction. The points to confirm going forward are the certainty of achieving FY7/2027 operating profit of 15.0 billion yen, the conversion of Public-sector ICT into recurring demand, the realization of higher profit in private-sector ICT and the Office-related Business, the relationship between gross margin and SG&A expense ratio, and capital policy including progressive dividends.
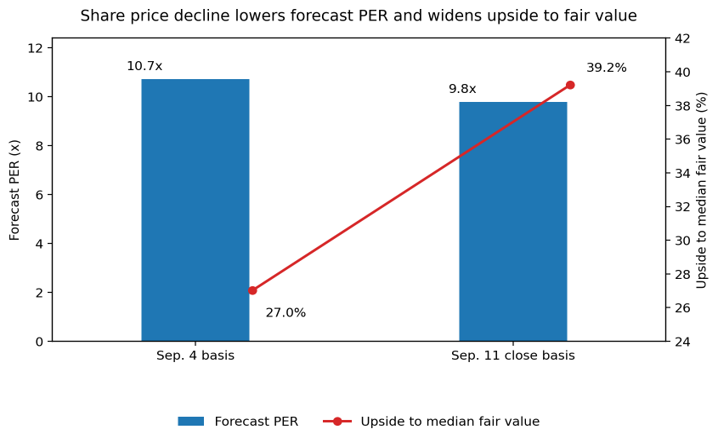
Figure 1 Share price decline lowers forecast PER and widens upside to the median fair value
Source: Prepared by Omega Investment based on FactSet standardized data.
1. Analyst meeting materials increased confidence in the 15.0 billion yen plan
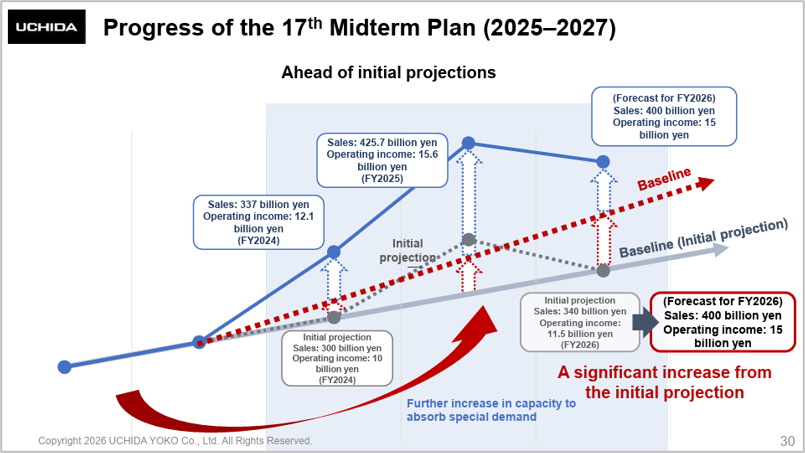
The central message of the analyst meeting materials is that the strong FY7/2026 results were not only due to a temporary acquisition of special demand, but were accompanied by an expansion in the ability to absorb special demand and an improvement in the profit base that will remain after special demand.
In the FY7/2026 results, the Company noted that acquisition of special demand from GIGA replacements, standardization of local government information systems, and Windows 10 replacement demand exceeded expectations. That baseline improvement progressed in both the public and private markets. In the public market, demand for education networks, the establishment of new faculties and reorganization of departments for university science and engineering talent development, and public facility projects grew. In the private market, demand for software licenses, IT for major companies, SmartRooms, and office space grew.
This explanation is consistent with the investment thesis set out in the recent 4Q Flash Report. In other words, FY7/2027 should not be viewed simply as a year of lower earnings, but as a year to test whether operating profit of 15.0 billion yen remains after special demand. The analyst meeting materials showed the 15.0 billion yen figure more concretely. Therefore, it is appropriate not to change the investment view significantly, but to revise it to reflect increased confidence in the medium-term profit base.
Source: Company material
2. FY7/2026 reached record-high profit, with both special-demand capture and baseline improvement
FY7/2026 results were net sales of 425.7 billion yen, operating profit of 15.6 billion yen, ordinary profit of 16.8 billion yen, and profit attributable to owners of parent of 12.5 billion yen. Net sales rose 26.3% YoY, operating profit rose 28.4%, ordinary profit rose 27.8%, and profit attributable to owners of parent rose 27.1%, with net sales and all profit items reaching record highs.
SG&A expenses increased by 3.4 billion yen YoY. The Company explains hiring, improved treatment through base wage increases, workplace environment development, and the introduction and rollout of a groupwide common sales management system as investments to strengthen the management base that will support future growth. Investors should confirm this point. An increase in SG&A expenses suppresses profit in the short term, but in the Company’s case, it is an investment to enhance large-project execution capacity, group management, sharing of SE resources, and the linkage between private-sector ICT and Public-sector ICT.
The Company presented FY7/2026 results as the result of both increased special-demand capture and baseline improvement. Special demand includes GIGA replacements, standardization of local government information systems, and Windows 10 replacement demand. Meanwhile, education networks, universities, public facilities, software licenses, IT for major companies, SmartRooms, and office demand are business bases that will remain after special demand. The analyst meeting materials explain these two separately, making the picture easy for investors to understand.
3. In FY7/2027, private-sector ICT and offices offset the public-sector pullback
The Company’s FY7/2027 forecast calls for net sales of 400.0 billion yen, operating profit of 15.0 billion yen, and profit attributable to owners of parent of 10.5 billion yen. Net sales are forecast to decline by 6.0% YoY, operating profit by 4.0%, and net income attributable to owners of parent by 15.9%. On the surface, it is a plan for lower sales and lower profit. However, operating profit of 15.0 billion yen is far above the 12.2 billion yen in FY7/2025 and the 9.3 billion yen in FY7/2024. It is also 3.5 billion yen higher than the FY7/2027 operating profit plan of 11.5 billion yen when the Company formulated the 17th Medium-Term Management Plan.
Looking at the segment, the FY7/2027 company plan has more important implications.
| Segment | FY7/2026 operating profit |
FY7/2027 plan | Change | Investor view |
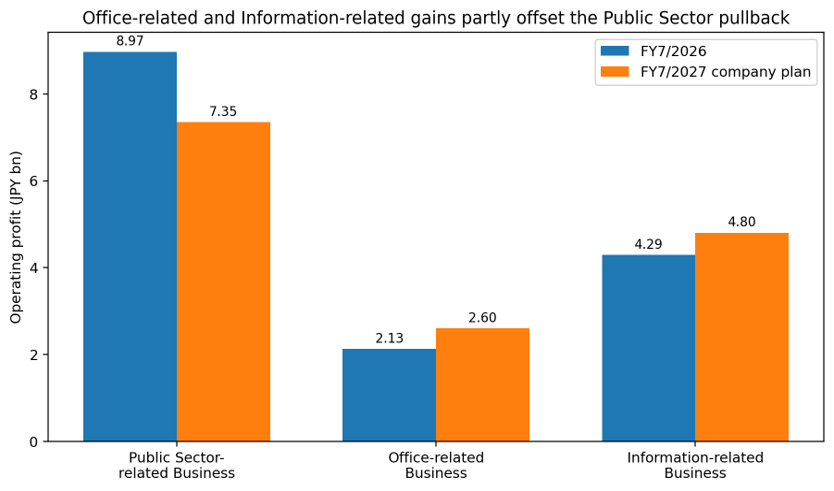
| Public Sector-related Business | 8.97 billion yen | 7.35 billion yen | Down 1.62 billion yen | Factors in the pullback from GIGA device replacements and local government standardization |
| Office-related Business | 2.13 billion yen | 2.60 billion yen | Up 0.47 billion yen | Environmental construction functions as a profit growth driver |
| Information-related Business | 4.29 billion yen | 4.80 billion yen | Up 0.51 billion yen | Private-sector ICT and recovery in SI for small and medium-sized enterprises support profit growth. |
Figure 2 Office-related and Information-related gains partly offset the Public Sector pullback
Source: Prepared by Omega Investment based on FactSet standardized data.
This table shows that operating profit of 15.0 billion yen is supported not only by remaining special demand in the Public Sector-related Business. The Public Sector-related Business is expected to see a large decline in profit, but the Office-related Business and the Information-related Business are planned to post higher profit. Therefore, investors should look beyond the pullback in public-sector ICT and assess the extent to which private-sector ICT, office environment development, SI projects for small and medium-sized enterprises, SmartRooms, and SmartOfficeNavigator can support the profit level after special demand.
4. The 3.8% operating margin plan eases concern over gross margin decline
In the recent 4Q Flash Report, we noted that in FY7/2026, while gross profit margin declined, the SG&A expense ratio declined and operating margin improved. The analyst meeting materials included a chart that further reinforced this view. The FY7/2027 consolidated operating margin plan is 3.8%, up slightly from 3.7% in FY7/2026. In addition, the operating margin excluding the software license business is planned at 6.0%.
This point is important in considering concerns about the gross margin decline. In FY7/2026, projects with large sales scale but relatively low gross margins, such as GIGA device replacements and software licenses, increased. As a result, the gross profit margin declined. However, the operating profit margin rose because the SG&A expense ratio declined as the scale of the business expanded. This shows not simply low-margin, high-volume sales, but a stronger ability to win large projects while maintaining operating profit.
In FY7/2027, although GIGA device replacement demand and Windows 10 replacement demand will pull back, the Company plans an operating margin of 3.8%. If it achieves this plan, the Company’s profit base can be evaluated as supported not only by sales scale, but also by customer touchpoints accumulated in Public-sector ICT, project execution capability, operational support, private-sector ICT, and environmental construction.
5. Public-sector ICT is shifting from device sales to operations, networks, and data utilization
The Public Sector-related Business was the main driver of growth in FY7/2026. GIGA device replacement demand peaked, and standardization of local government information systems also lifted earnings. A pullback is expected in FY7/2027, but the analyst meeting materials suggest the Public-sector ICT customer base may not end with device sales and could expand into operational maintenance, networks, security, integrated IDs, school affairs DX, and education data utilization.
For GIGA device replacements, the Company cited projects including about 180,000 devices total through joint procurement by Kyoto City and Kyoto Prefecture, and about 100,000 devices plus five years of operational maintenance in Saitama City. What matters is that the Company is responding on an integrated basis not only with devices, but also with kitting, rollout, and operational maintenance. The value of Public-sector ICT is shifting from the number of devices sold to post-introduction operational support and network construction.
In education networks, the track record for zero-trust network installations has expanded to more than 50 projects since the first nationwide introduction in 2021. Devices for students and teachers have expanded from 1.5 million six years ago to 10.0 million today. Stable operation of school networks, security, integrated IDs, and linkage between school affairs systems and learning systems based on a large number of devices are demands that will remain after device replacements.
In the standardization of local government information systems, delayed local governments accounted for 56.8% of the total. This is up from 52.3% at the time of the previous announcement. This is a short-term timing-shift risk, while also supporting demand from FY7/2027 onward. The Company explains that it completed many welfare-related systems in the current period. Although more local governments extended their projects into the following fiscal year or later, the work scheduled for the current fiscal year was completed. Going forward, the Company expects to strengthen linkages among municipal core systems, welfare systems that connect regions, and education systems that support children.
This point shows that the Company should not be viewed merely as a company that receives public-sector projects. Whether customer touchpoints expanded through Public-sector ICT can be converted into operational maintenance, networks, education data, and local government data utilization will determine profit levels from FY7/2028 onward.
6. Private-sector ICT is reinforced by software licenses and meeting room operations
In private-sector ICT, software licenses, SmartRooms, and SmartOfficeNavigator are important businesses that support the profit base after special demand.
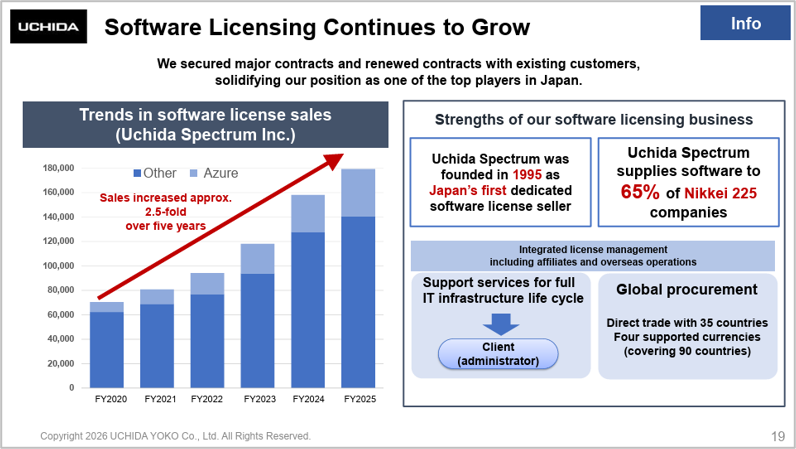
In the software license business, Uchida Spectrum’s sales have expanded by about 2.5 times over five years. The adoption rate among Nikkei 225 companies is 65%, and the Company has one of the leading positions in Japan. Its ability to centrally manage licenses for subsidiaries and overseas divisions of major corporate groups, with direct transactions in 35 countries, support for four currencies, and coverage in 90 countries, makes it a strong ICT base for major companies.
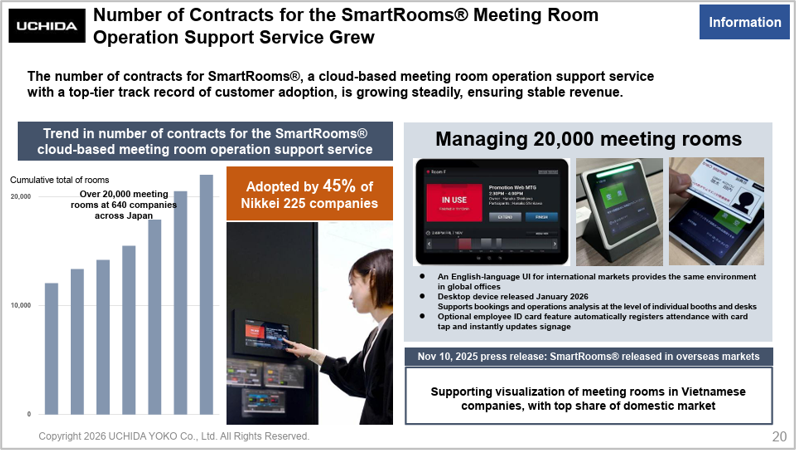
SmartRooms operates 640 companies and more than 20,000 rooms in Japan, with a 45% adoption rate among Nikkei 225 companies. As a cloud-based meeting room operation support service, it has expanded its functions to include meeting room reservations, occupancy analysis, international support, employee ID card linkage, and desk terminals. This is not simply system sales, but a service that continuously collects office usage data and connects it to workplace operational improvements.
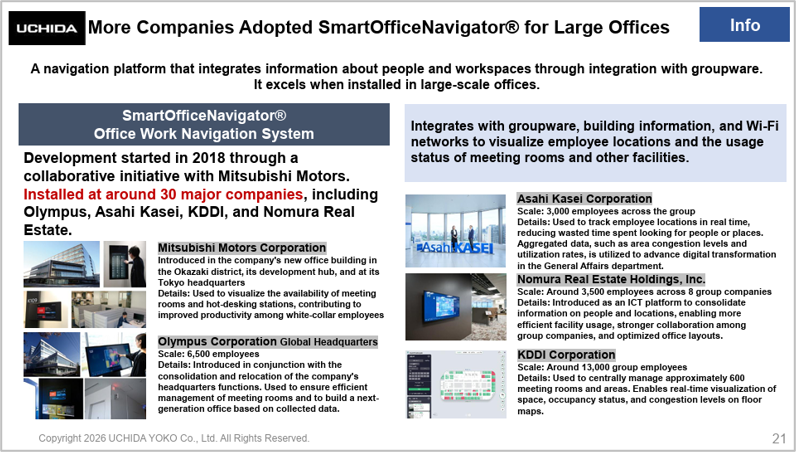
SmartOfficeNavigator has been introduced at approximately 30 major companies. At the KDDI Group’s new headquarters, a project was presented involving the integrated management of information on approximately 13,000 group employees and approximately 600 meeting rooms and meeting areas. It demonstrates its strengths in large-scale offices as a navigation platform that integrates information on people and workplaces.
These businesses are material for viewing the Company’s private-sector ICT not as a temporary IT investment demand, but as a business with recurring revenue and data utilization. The Information-related Business is planned to post net sales of 220.0 billion yen and operating profit of 4.8 billion yen in FY7/2027, representing higher sales and profit YoY. In addition to a recovery in SI projects for small and medium-sized enterprises, growth in major-company licenses, SmartRooms, and SmartOfficeNavigator could partly offset the pullback in Public-sector ICT.
Source: Company material
7. The Office-related Business connects environmental construction and ICT as a profit growth driver
The Office-related Business posted net sales of 59.2 billion yen and operating profit of 2.1 billion yen in FY7/2026. In the FY7/2027 plan, the Company expects higher sales and profit, with net sales of 63.7 billion yen and operating profit of 2.6 billion yen. The Office-related Business is expected to increase profit, while the Public Sector-related Business is expected to decline.
The Company is capturing relocation demand in Tokyo, Nagoya, and Osaka; demand to strengthen regional offices; and demand for high-end rental offices. Office investment is not merely fixture sales, but is linked to ICT, spatial design, ways of working, meeting room operations, and data utilization. Considering linkage with SmartOfficeNavigator and SmartRooms, the Office-related Business is an entry point connecting environmental construction and private-sector ICT.
Investors should not view the Office-related Business only as a mature furniture and fixtures business. It should be understood as including workplace redesign, usage data for meeting rooms and desks, general affairs DX, and linkage with building information. The plan to increase Office-related Business profit in FY7/2027 supports the post-special-demand profit level.
8. Groupwide common platforms and SE common management support the profit base
A new point investors should evaluate in the analyst meeting materials is investment in groupwide common platforms and the SE common management system. The Company completed full integration of the groupwide common sales management system in August 2026. It will manage accounting, human resources, and sales through a single ERP and create a structure that uses common data, common operations, and common resources. This platform lets the Company share resources across the group not by company unit, but by business opportunity.
The Company also plans to integrate and launch a common management system used by approximately 1,300 SEs across the group in July 2027. The Company explains that it will reorganize the systems engineering organization and standardize support processes. This will enhance project execution capacity in Public-sector ICT, private-sector ICT, local governments, education, and private-sector business.
The Company’s business is characterized by deep involvement in customers’ workplaces and the combination of hardware, software, networks, operational support, and spatial construction. Therefore, to raise the profit base, it must not only increase orders but also build a structure that can use SEs, human resources, data, sales management, and support processes across the group. The analyst meeting materials showed that this management-base transformation is progressing.
This point underpins FY7/2027 operating profit of 15.0 billion yen. Behind the increased ability to absorb special demand are groupwide common platforms, SE common management, and the fusion of ICT and office businesses in the major private-sector market. Therefore, in evaluating the 15.0 billion yen plan, investors should look not only at demand, but also at improvements in supply capacity and project execution capacity.
9. Introduction of progressive dividends raises the assessment of shareholder returns
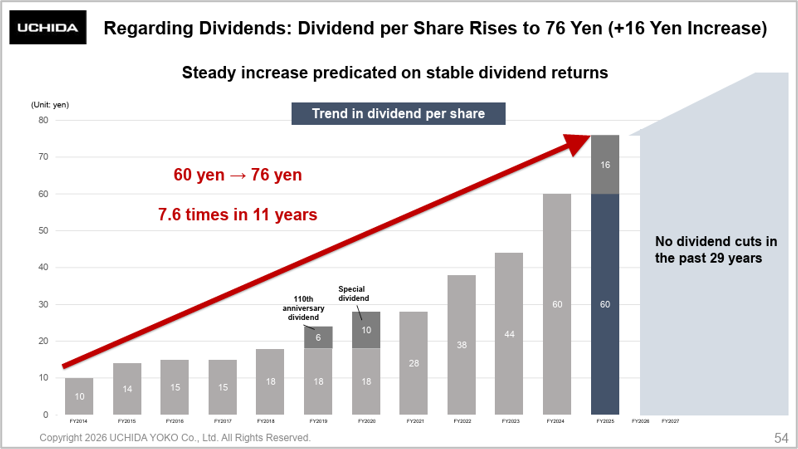
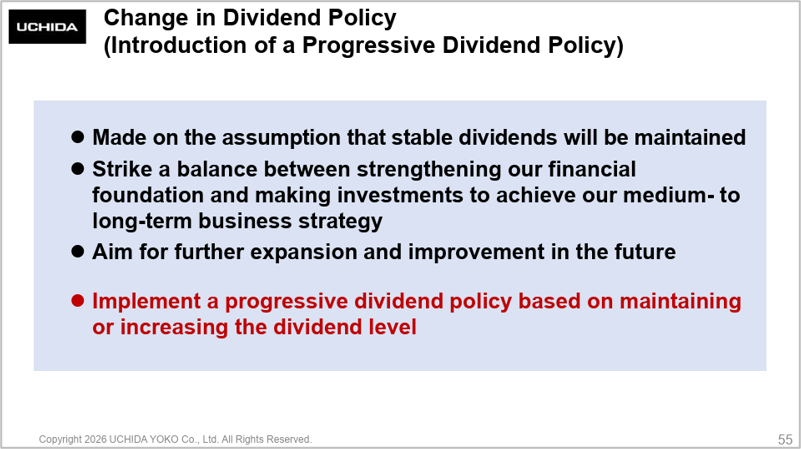
The Company indicated a plan to pay a dividend per share of 76 yen in FY7/2027, an increase of 16 yen from 60 yen in the previous fiscal year. It explained that the dividend has increased 7.6 times over 11 years and that there have been no dividend reductions over the past 29 years. In addition, it changed its dividend policy and introduced progressive dividends. The Company indicated a policy of maintaining or raising the dividend level as a basic approach, assuming stable dividend maintenance and balancing strengthening the financial base with investments to realize medium- to long-term management strategies.
This is a positive change in shareholder returns. In the recent 4Q Flash Report, we evaluated net cash and investment securities levels, reductions in policy shareholdings, and improved capital efficiency. The analyst meeting materials added a clear shareholder return policy through progressive dividends. Based on a share price of 2,083 yen, the forecast dividend yield is 3.6%. With capital efficiency improving and operating profit of 15.0 billion yen expected to be maintained, a dividend yield in the mid-3% range supports the share price.
The Company also explains that it conducted a stock split in January 2026, and that as of July 20, 2026, the number of individual shareholders had increased by 2.1x. The stock split lowers the amount per investment unit, improves liquidity, and expands the investor base. View the direct effect on share-price valuation cautiously, but evaluate the effort to broaden the investor base.
Source: Company material
10. Share price decline appears driven more by market factors than by deterioration in company-specific issues
The share price reaction on September 3 was important as the initial evaluation after the earnings announcement. Against the September 2 closing price of 2,304 yen, the share opened on September 3 at 2,204 yen and at one point declined to 2,172 yen. It was then bought back, and the closing price was 2,347 yen. In the morning, selling emerged in response to the weakness of 4Q alone and the forecast decline in FY7/2027 earnings, but later that day, investors’ focus appeared to shift from next fiscal year’s earnings decline to the possibility that operating profit of 15.0 billion yen could remain after special demand.
After that, the share price declined to the September 11 closing price of 2,083 yen. Compared with the September 3 closing price of 2,347 yen, this is a decline of approximately 11.2%. However, this decline does not reflect a deterioration in the Company-specific earnings outlook. Rather, it should be viewed as largely reflecting market-wide risk aversion caused by heightened tensions in the Middle East, higher crude oil prices, and rising global interest rates.
The analyst meeting materials confirm a positive outlook for the individual company. The materials showed a breakdown of FY7/2027 operating profit of 15.0 billion yen, a plan for higher profit in private-sector ICT and the Office-related Business, stable operating margins, the introduction of progressive dividends, and recurring demand in Public-sector ICT. Therefore, rather than viewing the share price decline as a weakening of the investment thesis, it is natural to see it as a phase in which the share price valuation declined due to market factors immediately after confidence in the investment view had increased.
11. Share price decline increased valuation appeal
Based on the September 11 closing price of 2,083 yen, valuations have declined further compared with the share price of 2,283 yen used in the recent 4Q Flash Report.
| Basis | Share price | Forecast PER | Actual PBR | Forecast dividend yield |
Upside to median fair value |
| Sep. 4 basis | 2,283 yen | 10.7x | 1.31x | 3.3% | Approx. 27% |
| Sep. 11 close basis | 2,083 yen | 9.8x | 1.20x | 3.6% | Approx. 39% |
Forecast PER after deducting period-end net cash of 32.5 billion yen is approximately 6.7x, and adjusted PER after also deducting investment securities of 17.7 billion yen after tax considerations is approximately 5.0x. This is a considerably cautious share price valuation relative to the premise that operating profit of 15.0 billion yen will be maintained in FY7/2027.
| Share price | Regular PER | Net cash-adjusted PER | PER after deducting investment securities |
| 2,283 yen | 10.7x | 7.6x | 5.9x |
| 2,083 yen | 9.8x | 6.7x | 5.0x |
Figure 3: After the share price decline, asset-adjusted PER fell further
Source: Prepared by Omega Investment based on FactSet standardized data.
What matters for medium- to long-term investors is the reason the share price declined. If the share price had fallen because the Company-specific earnings outlook deteriorated, a reassessment would be necessary. However, the current decline is largely attributed to market-wide risk aversion. Meanwhile, the analyst meeting materials added that confidence in FY7/2027 operating profit is 15.0 billion yen. As the Company-specific investment thesis was reinforced while only the share price valuation declined, entry appeal has increased.
12. Maintain the median fair share price of 2,900 yen and evaluate the wider gap
The fair share price is maintained at the median of 2,900 yen shown in the recent 4Q Flash Report. The analyst meeting materials increase confidence in the investment view, but FY7/2027 operating profit of 15.0 billion yen itself had already been incorporated in the recent report. Therefore, rather than raising the fair share price further, it is more natural to frame the point as a widening gap between the current share price and the median fair share price due to the share price decline.
Under the PBR approach, assuming a forecast ROE of 12.3%, a cost of equity of 8.5%, and actual BPS of 1,737.66 yen, the fair share price range is 2,690 yen to 3,130 yen, with a midpoint of 2,910 yen. Under the DCF approach, assuming normalized FCF of 6.5 billion yen to 7.5 billion yen, WACC of 6.5% to 7.5%, a perpetual growth rate of 0.5%, and the addition of period-end net cash, the fair share price range is 2,550 yen to 3,210 yen, with a midpoint of 2,880 yen. Under the ROIC approach, assuming that the Omega provisional ROIC estimate of 16.0% remains above the cost of capital over the medium term, the fair share price range is 2,870 yen to 3,390 yen, with a midpoint of 3,130 yen.
Combining the three valuation approaches, the fair share price range is 2,550 yen to 3,390 yen, with a median of approximately 2,900 yen. Against the September 11 closing price of 2,083 yen, upside to the median is approximately 39%. Although the share price declined due to market factors, the analyst meeting materials strengthened the explanation of operating profit quality at 15.0 billion yen, so the current share price level is a position medium- to long-term investors can easily reconsider.
13. The key points to confirm are the sustainability of 15.0 billion yen and gross margin
The first risk is that FY7/2027 operating profit of 15.0 billion yen may not be a base profit level that can be maintained even after special demand, but rather a temporarily high level still supported by special demand. FY7/2027 will also include local government information system standardization projects extended into the following year and remaining GIGA device replacement projects. Therefore, it will be necessary to confirm whether operating profit can remain near 15.0 billion yen even as these decline further from FY7/2028 onward.
The second risk is the decline in gross margin. In FY7/2026, the Company raised operating margin by reducing the SG&A expense ratio while taking in large, low-margin projects. It is also planning an operating margin of 3.8% in FY7/2027. However, if the gross margin decline and SG&A expenses continue to rise, it will be necessary to reconsider the assessment that SG&A leverage can absorb the gross margin decline.
The third risk is that the customer base expanded in Public-sector ICT cannot be sufficiently converted into recurring revenue. What matters is whether customer touchpoints expanded through device replacements can shift to networks, security, maintenance, education data, and local government data utilization. The analyst meeting materials showed zero-trust network installations across more than 50 projects, 10.0 million education devices, the extension of local government system standardization, and expectations for linkage between welfare and education systems. If these can be converted into recurring revenue, they will make it easier to support the profit base from FY7/2028 onward.
The fourth risk is that policy shareholdings and net cash remain on the BS and capital efficiency improvement stalls. Now that ROE has improved to 16.0%, this risk has declined, but once business growth settles, capital policy will again affect the share price valuation. The introduction of progressive dividends is positive, but going forward it will be necessary to confirm the balance among reductions in policy shareholdings, share buybacks, and growth investment.
In subsequent results, the key points to confirm are progress against the FY7/2027 company plan, segment operating profit, gross profit margin, SG&A expense ratio, Public-sector ICT operational maintenance and network projects, progress in standardization of local government information systems, recovery in SI for small and medium-sized enterprises in private-sector ICT, the number of SmartRooms contracted rooms, horizontal expansion of SmartOfficeNavigator, growth in software licenses, operating cash flow, reductions in policy shareholdings, and the policy on dividends and share buybacks.
14. Conclusion: Analyst meeting increased confidence, and share price decline increases attraction
The analyst meeting does not weaken the investment view in the recent 4Q Flash Report. Rather, they reinforce the view that Uchida Yoko’s profit base will remain even after special demand.
The key point is that the FY7/2027 operating profit plan of 15.0 billion yen assumes higher profit in the Office-related Business and the Information-related Business, while factoring in a pullback in the Public Sector-related Business. SmartRooms, SmartOfficeNavigator, software licenses, education networks, local government data linkage, groupwide common platforms, and the SE common management system show that the Company is not merely a special-demand response company, but a company that expands its profit base around people and data.
The share price was evaluated immediately after the earnings announcement, then declined as it was caught up in market-wide risk aversion. However, the analyst meeting materials have increased confidence in the investment view. The share price decline has lowered the forecast PER to 9.8 times, the net cash-adjusted PER to 6.7 times, and the PER after deducting investment securities to 5.0 times. In contrast, upside to the median fair share price of 2,900 yen has expanded to approximately 39%.
Therefore, we maintain a positive view on the shares as appropriate for medium- to long-term investment. The current phase should be viewed as one in which confidence in medium-term profit has increased based on the analyst meeting materials, while the market-driven share price decline has increased entry appeal.
Notes
The share price of 2,083 yen is the closing price on September 11, 2026. Forecast EPS of 212.89 yen, actual BPS of 1,737.66 yen, and forecast dividend of 76.00 yen are based on the FY7/2026 earnings release and the Company plan. Forecast ROE is an Omega estimate based on a simplified calculation that divides forecast EPS of 212.89 yen by the latest BPS of 1,737.66 yen.
Because FactSet has not yet calculated ROIC, it uses an Omega provisional estimate of 16.0%, calculated in accordance with FactSet’s method using financial statement values currently available from the earnings release. If FactSet later confirms the value, we will prioritize it.
Financial data is generally based on FactSet standardized data, and therefore may not fully match company materials in displayed line items, reclassifications, rounding, segment disclosures, or other respects. Business-specific figures, KPIs, medium-term plan figures, capital allocation policies, and similar data are based on company materials, supplemented as necessary by FactSet and Omega estimates.
Net cash is calculated as 32.5 billion yen on a borrowing-deduction basis, deducting short-term borrowings of 1.9 billion yen from cash and deposits of 34.4 billion yen as of FY7/2026. A conservative basis, including lease obligations and similar items, could not be confirmed because the earnings release does not provide separate detailed breakdowns.
Fair share price estimates, PER, DCF, ROIC, and other valuation figures are Omega estimates based on certain assumptions and do not guarantee future share price or corporate value.
Key stock price data
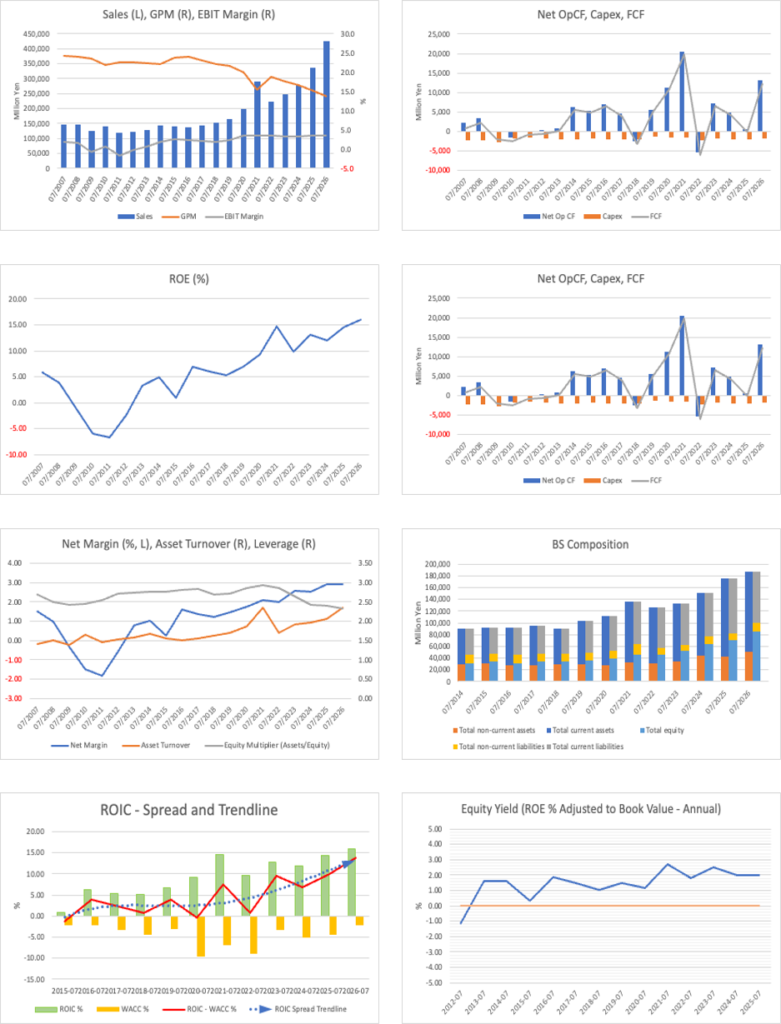
Company profile
Uchida Yoko is a long-established company founded in 1910, and today it supports problem-solving for schools, local governments, companies, and offices through Public-sector ICT, private-sector ICT, and environmental construction. It is classified as a wholesaler under general industry classifications, but today’s company is not merely a wholesaler. Its distinguishing feature is providing hardware, software, networks, security, operational support, support services, office spatial design, and educational environment construction on an integrated basis.
In public markets, the Company handles the GIGA School Program, education networks, school affairs DX, local government information system standardization, university facilities, and school reconstruction for elementary, junior high, and high schools, universities, and local governments. In private markets, the Company develops major-company software licenses, cloud-based meeting room operation support SmartRooms, ERP for small and medium-sized enterprises, SmartOfficeNavigator, and office environmental construction. In environmental construction, the Company has a nationwide sales network for office furniture, fixtures for educational facilities, and spatial design for public facilities.
The 17th Medium-Term Management Plan has “people and data” as its theme. The Company’s strength is that it becomes involved in the settings where people are active, such as schools, local governments, companies, and offices, designs environments that handle data generated there, and supports operations. Investors should evaluate the Company not as one whose profit temporarily expands due to special demand, but as a company that connects the customer base expanded in Public-sector ICT to private-sector ICT, environmental construction, and data utilization.
Key financial data
| Unit: million yen | 2022 | 2023 | 2024 | 2025 | 2026 | 2027 CE |
| Sales | 221,856 | 246,549 | 277,940 | 337,055 | 425,729 | 400,000 |
| EBIT (Operating Income) | 7,775 | 8,423 | 9,292 | 12,149 | 15,631 | |
| Pretax Income | 7,965 | 9,200 | 10,280 | 14,479 | 18,009 | |
| Net Profit Attributable to Owner of Parent | 4,477 | 6,366 | 6,996 | 9,825 | 12,486 | 10,500 |
| Cash & Short-Term Investments | 30,344 | 29,696 | 30,804 | 27,372 | 35,936 | |
| Total assets | 125,503 | 133,008 | 150,753 | 174,917 | 187,176 | |
| Total Debt | 2,983 | 3,011 | 3,163 | 2,925 | 1,910 | |
| Net Debt | -27,361 | -26,685 | -27,641 | -24,447 | -34,026 | |
| Total liabilities | 79,383 | 80,883 | 85,963 | 104,109 | 101,192 | |
| Total Shareholders’ Equity | 45,719 | 51,897 | 64,541 | 70,548 | 85,703 | |
| Net Operating Cash Flow | -5,414 | 7,269 | 4,850 | 549 | 13,069 | |
| Capital Expenditure | 2,248 | 1,960 | 1,979 | 1,968 | 1,960 | |
| Net Investing Cash Flow | -2,198 | -4,857 | -1,816 | -1,027 | -1,331 | |
| Net Financing Cash Flow | -8,632 | -3,521 | -2,354 | -2,751 | -3,466 | |
| Free Cash Flow | -6,027 | 6,545 | 4,173 | -176 | 12,181 | |
| ROA (%) | 3.43 | 4.93 | 4.93 | 6.03 | 6.90 | |
| ROE (%) | 9.84 | 13.04 | 12.02 | 14.55 | 15.98 | |
| EPS (Yen) | 91.2 | 129.5 | 142.2 | 199.5 | 253.2 | 212.9 |
| BPS (Yen) | 930.2 | 1,055.1 | 1,311.4 | 1,431.9 | 1,737.7 | |
| Dividend per Share (Yen) | 28.00 | 38.00 | 44.00 | 60.00 | 76.00 | 76.00 |
| Shares Outstanding (Million shares) | 52.10 | 52.10 | 52.10 | 52.10 | 52.10 |
Source: Calculated by Omega Investment based on FactSet’s standard criteria, rounded to the nearest whole number.
Share price
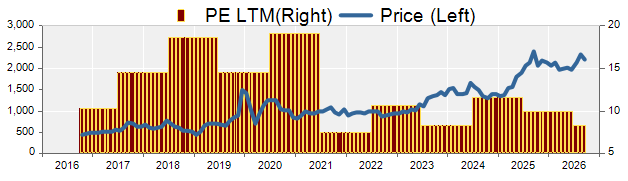
Financial data (quarterly basis)
| Unit: million yen | 2024/7 | 2024/7 | 2026/7 | ||||||
| 4Q | 1Q | 2Q | 3Q | 4Q | 1Q | 2Q | 3Q | 4Q | |
| (Income Statement) | |||||||||
| Sales | 76,969 | 52,563 | 69,292 | 112,433 | 102,767 | 80,116 | 93,965 | 140,292 | 111,356 |
| Year-on-year | 13.4% | -1.2% | 29.0% | 19.5% | 33.5% | 52.4% | 35.6% | 24.8% | 8.4% |
| Cost of Goods Sold (COGS) | 66,540 | 41,679 | 57,443 | 94,260 | 91,286 | 67,049 | 80,686 | 119,217 | 99,537 |
| Gross Income | 10,429 | 10,884 | 11,849 | 18,173 | 11,481 | 13,067 | 13,279 | 21,075 | 11,819 |
| Gross Income Margin | 13.5% | 20.7% | 17.1% | 16.2% | 11.2% | 16.3% | 14.1% | 15.0% | 10.6% |
| SG&A Expense | 10,476 | 9,346 | 9,790 | 9,994 | 11,108 | 10,059 | 10,805 | 10,632 | 12,113 |
| EBIT (Operating Income) | -47 | 1,538 | 2,059 | 8,179 | 373 | 3,008 | 2,474 | 10,443 | -294 |
| Year-on-year | 11.9% | -48.5% | -25837.5% | 28.1% | -893.6% | 95.6% | 20.2% | 27.7% | -178.8% |
| Operating Income Margin | -0.1% | 2.9% | 3.0% | 7.3% | 0.4% | 3.8% | 2.6% | 7.4% | -0.3% |
| EBITDA | 451 | 1,986 | 2,536 | 8,695 | 882 | 3,507 | 3,014 | 11,035 | 319 |
| Pretax Income | 371 | 1,743 | 2,323 | 8,263 | 2,150 | 3,295 | 3,817 | 10,656 | 241 |
| Consolidated Net Income | 310 | 1,203 | 1,542 | 5,674 | 1,448 | 2,316 | 2,581 | 7,316 | 328 |
| Minority Interest | 16 | 0 | 2 | 23 | 17 | 4 | -1 | 31 | 20 |
| Net Income ATOP | 295 | 1,203 | 1,540 | 5,651 | 1,431 | 2,311 | 2,583 | 7,284 | 308 |
| Year-on-year | -39.0% | -46.2% | 1538.3% | 29.3% | 385.1% | 92.1% | 67.7% | 28.9% | -78.5% |
| Net Income Margin | 0.4% | 2.3% | 2.2% | 5.0% | 1.4% | 2.9% | 2.7% | 5.2% | 0.3% |
| (Balance Sheet) | |||||||||
| Cash & Short-Term Investments | 30,804 | 29,623 | 28,003 | 28,250 | 27,372 | 37,064 | 39,165 | 39,422 | 35,936 |
| Total assets | 150,753 | 133,681 | 149,733 | 186,584 | 174,917 | 173,718 | 209,774 | 214,931 | 187,176 |
| Total Debt | 3,163 | 6,432 | 6,066 | 6,460 | 2,925 | 6,396 | 6,145 | 6,452 | 1,910 |
| Net Debt | -27,641 | -23,191 | -21,937 | -21,790 | -24,447 | -30,668 | -33,020 | -32,970 | -34,026 |
| Total liabilities | 85,963 | 70,593 | 84,994 | 116,557 | 104,109 | 102,673 | 135,673 | 132,842 | 101,192 |
| Total Shareholders’ Equity | 64,541 | 62,871 | 64,520 | 69,786 | 70,548 | 70,814 | 73,871 | 81,828 | 85,703 |
| (Profitability %) | |||||||||
| ROA | 4.93 | 4.70 | 5.36 | 4.93 | 6.03 | 7.11 | 6.66 | 6.78 | 6.90 |
| ROE | 12.02 | 10.32 | 12.56 | 13.49 | 14.55 | 16.36 | 17.31 | 17.95 | 15.98 |
| (Per-share) Unit: JPY | |||||||||
| EPS | 6.0 | 24.4 | 31.3 | 114.7 | 29.0 | 46.9 | 52.4 | 147.7 | 6.2 |
| BPS | 1,311.4 | 1,276.0 | 1,309.5 | 1,416.4 | 1,431.9 | 1,435.8 | 1,497.8 | 1,659.1 | 1,737.7 |
| Dividend per Share | 44.00 | 0.00 | 0.00 | 0.00 | 60.00 | 0.00 | 0.00 | 0.00 | 76.00 |
| Shares Outstanding(million shares) | 52.10 | 52.10 | 52.10 | 52.10 | 52.10 | 52.10 | 52.10 | 52.10 | 52.10 |
Source: Calculated by Omega Investment based on FactSet’s standard criteria, rounded to the nearest whole number.
Financial data (full-year basis)
| Unit: million yen | 2017 | 2018 | 2019 | 2020 | 2021 | 2022 | 2023 | 2024 | 2025 | 2026 |
| (Income Statement) | ||||||||||
| Sales | 144,537 | 151,441 | 164,386 | 200,307 | 291,035 | 221,856 | 246,549 | 277,940 | 337,055 | 425,729 |
| Year-on-year | 4.6% | 4.8% | 8.5% | 21.9% | 45.3% | -23.8% | 11.1% | 12.7% | 21.3% | 26.3% |
| Cost of Goods Sold | 111,123 | 117,957 | 128,969 | 160,438 | 245,976 | 180,373 | 203,259 | 231,483 | 285,953 | 366,489 |
| Gross Income | 33,414 | 33,484 | 35,417 | 39,869 | 45,059 | 41,483 | 43,290 | 46,457 | 51,102 | 59,240 |
| Gross Income Margin | 23.1% | 22.1% | 21.5% | 19.9% | 15.5% | 18.7% | 17.6% | 16.7% | 15.2% | 13.9% |
| SG&A Expense | 30,474 | 30,603 | 31,669 | 32,626 | 34,724 | 33,708 | 34,867 | 37,165 | 38,953 | 43,609 |
| EBIT (Operating Income) | 2,940 | 2,881 | 3,748 | 7,243 | 10,335 | 7,775 | 8,423 | 9,292 | 12,149 | 15,631 |
| Year-on-year | -14.4% | -2.0% | 30.1% | 93.2% | 42.7% | -24.8% | 8.3% | 10.3% | 30.7% | 28.7% |
| Operating Income Margin | 2.0% | 1.9% | 2.3% | 3.6% | 3.6% | 3.5% | 3.4% | 3.3% | 3.6% | 3.7% |
| EBITDA | 4,669 | 4,835 | 5,737 | 9,386 | 12,652 | 9,598 | 10,320 | 11,177 | 14,099 | 17,875 |
| Pretax Income | 3,352 | 3,198 | 4,137 | 6,618 | 10,976 | 7,965 | 9,200 | 10,280 | 14,479 | 18,009 |
| Consolidated Net Income | 2,252 | 2,085 | 2,707 | 4,142 | 7,405 | 4,857 | 6,421 | 7,042 | 9,867 | 12,541 |
| Minority Interest | 286 | 253 | 291 | 651 | 1,244 | 380 | 54 | 46 | 42 | 54 |
| Net Income ATOP | 1,965 | 1,831 | 2,415 | 3,490 | 6,160 | 4,477 | 6,366 | 6,996 | 9,825 | 12,486 |
| Year-on-year | -12.5% | -6.8% | 31.9% | 44.5% | 76.5% | -27.3% | 42.2% | 9.9% | 40.4% | 27.1% |
| Net Income Margin | 1.4% | 1.2% | 1.5% | 1.7% | 2.1% | 2.0% | 2.6% | 2.5% | 2.9% | 2.9% |
| (Balance Sheet) | ||||||||||
| Cash & Short-Term Investments | 26,143 | 18,871 | 19,817 | 28,453 | 46,265 | 30,344 | 29,696 | 30,804 | 27,372 | 35,936 |
| Total assets | 95,260 | 89,410 | 102,685 | 111,264 | 135,494 | 125,503 | 133,008 | 150,753 | 174,917 | 187,176 |
| Total Debt | 6,923 | 4,098 | 2,730 | 2,943 | 2,951 | 2,983 | 3,011 | 3,163 | 2,925 | 1,910 |
| Net Debt | -19,220 | -14,773 | -17,087 | -25,510 | -43,314 | -27,361 | -26,685 | -27,641 | -24,447 | -34,026 |
| Total liabilities | 58,122 | 52,004 | 63,500 | 68,947 | 85,287 | 79,383 | 80,883 | 85,963 | 104,109 | 101,192 |
| Total Shareholders’ Equity | 34,338 | 34,432 | 35,984 | 38,531 | 45,282 | 45,719 | 51,897 | 64,541 | 70,548 | 85,703 |
| (Cash Flow) | ||||||||||
| Net Operating Cash Flow | 4,610 | -2,476 | 5,543 | 11,320 | 20,457 | -5,414 | 7,269 | 4,850 | 549 | 13,069 |
| Capital Expenditure | 2,065 | 2,045 | 1,457 | 1,688 | 1,701 | 2,248 | 1,960 | 1,979 | 1,968 | 1,960 |
| Net Investing Cash Flow | -1,977 | -2,091 | -2,280 | -1,600 | -1,134 | -2,198 | -4,857 | -1,816 | -1,027 | -1,331 |
| Net Financing Cash Flow | -1,582 | -2,861 | -2,395 | -1,200 | -1,484 | -8,632 | -3,521 | -2,354 | -2,751 | -3,466 |
| Free Cash Flow | 3,935 | -3,204 | 5,138 | 10,672 | 19,770 | -6,027 | 6,545 | 4,173 | -176 | 12,181 |
| (Profitability ) | ||||||||||
| ROA (%) | 2.11 | 1.98 | 2.52 | 3.26 | 4.99 | 3.43 | 4.93 | 4.93 | 6.03 | 6.90 |
| ROE (%) | 6.00 | 5.33 | 6.86 | 9.37 | 14.70 | 9.84 | 13.04 | 12.02 | 14.55 | 15.98 |
| Net Margin (%) | 1.36 | 1.21 | 1.47 | 1.74 | 2.12 | 2.02 | 2.58 | 2.52 | 2.91 | 2.93 |
| Asset Turn | 1.55 | 1.64 | 1.71 | 1.87 | 2.36 | 1.70 | 1.91 | 1.96 | 2.07 | 2.35 |
| Assets/Equity | 2.85 | 2.69 | 2.73 | 2.87 | 2.94 | 2.87 | 2.65 | 2.44 | 2.41 | 2.32 |
| (Per-share) Unit: JPY | ||||||||||
| EPS | 39.1 | 37.2 | 49.4 | 71.3 | 125.7 | 91.2 | 129.5 | 142.2 | 199.5 | 253.2 |
| BPS | 682.8 | 704.2 | 736.0 | 787.4 | 923.6 | 930.2 | 1,055.1 | 1,311.4 | 1,431.9 | 1,737.7 |
| Dividend per Share | 15.00 | 15.00 | 18.00 | 24.00 | 28.00 | 28.00 | 38.00 | 44.00 | 60.00 | 76.00 |
| Shares Outstanding (million shares) | 52.10 | 52.10 | 52.10 | 52.10 | 52.10 | 52.10 | 52.10 | 52.10 | 52.10 | 52.10 |
Source: Calculated by Omega Investment based on FactSet’s standard criteria, rounded to the nearest whole number.