2026-11-17
Home
Japanese

Omega Investment Co., Ltd.
f-code (First read : 9211)
Growth remains strong; AI profitability and post-acquisition returns are the next tests
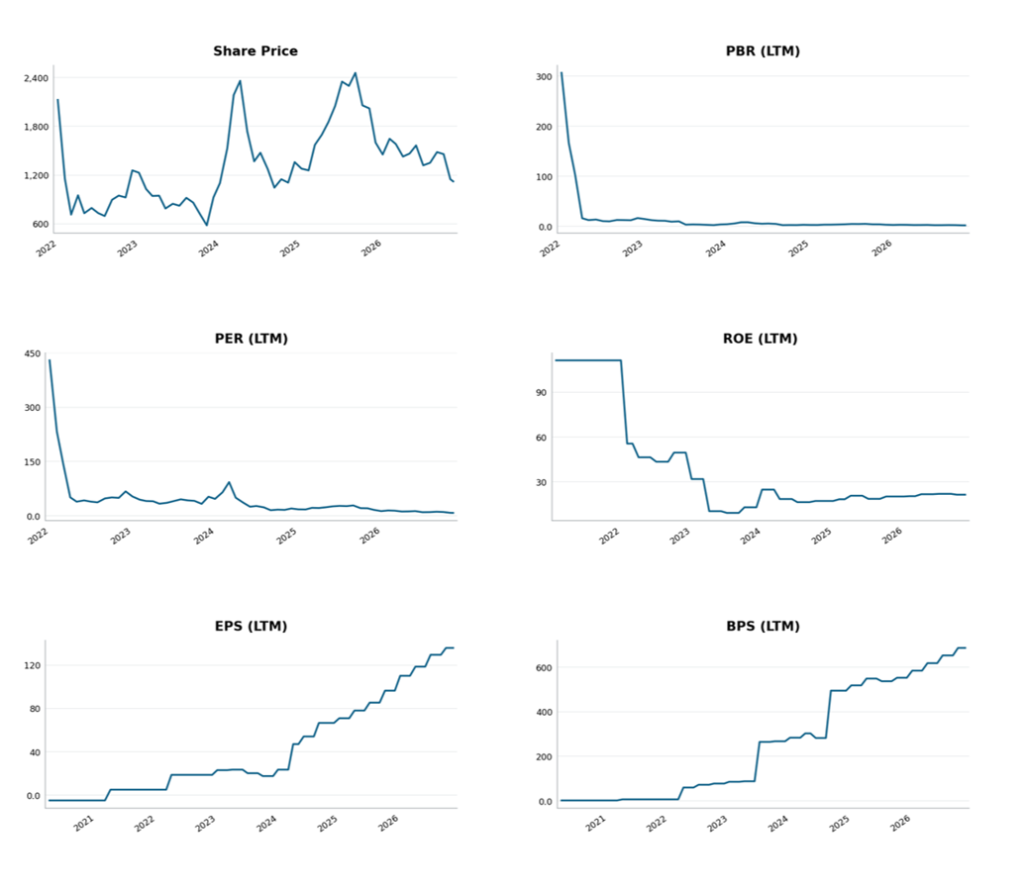
| Share price ¥1,136 (Nov. 13 close) | Forecast EPS ¥155.62 | Actual BPS ¥702.5 (Sep. 30) | Forecast dividend ¥0 |
| Implied ROE 22.2% | Forecast P/E 7.3x | P/B 1.62x |
| Click here for the PDF version of this page |
| PDF version |
First Read
Nine-month revenue reached ¥12.63 billion, up 50.3% year over year, while operating profit rose 45.0% to ¥2.54 billion. Profit growth continues to be supported by Marketing & School and the integration of acquired businesses. We lean toward maintaining the constructive stance presented in our previous second-quarter Update Report. Nevertheless, high growth alone does not establish an attractive valuation: margins in AI & Technology and returns on deployed acquisition capital remain the key tests.
What Matters in the Results : Changes in the Businesses Underpinning Profits
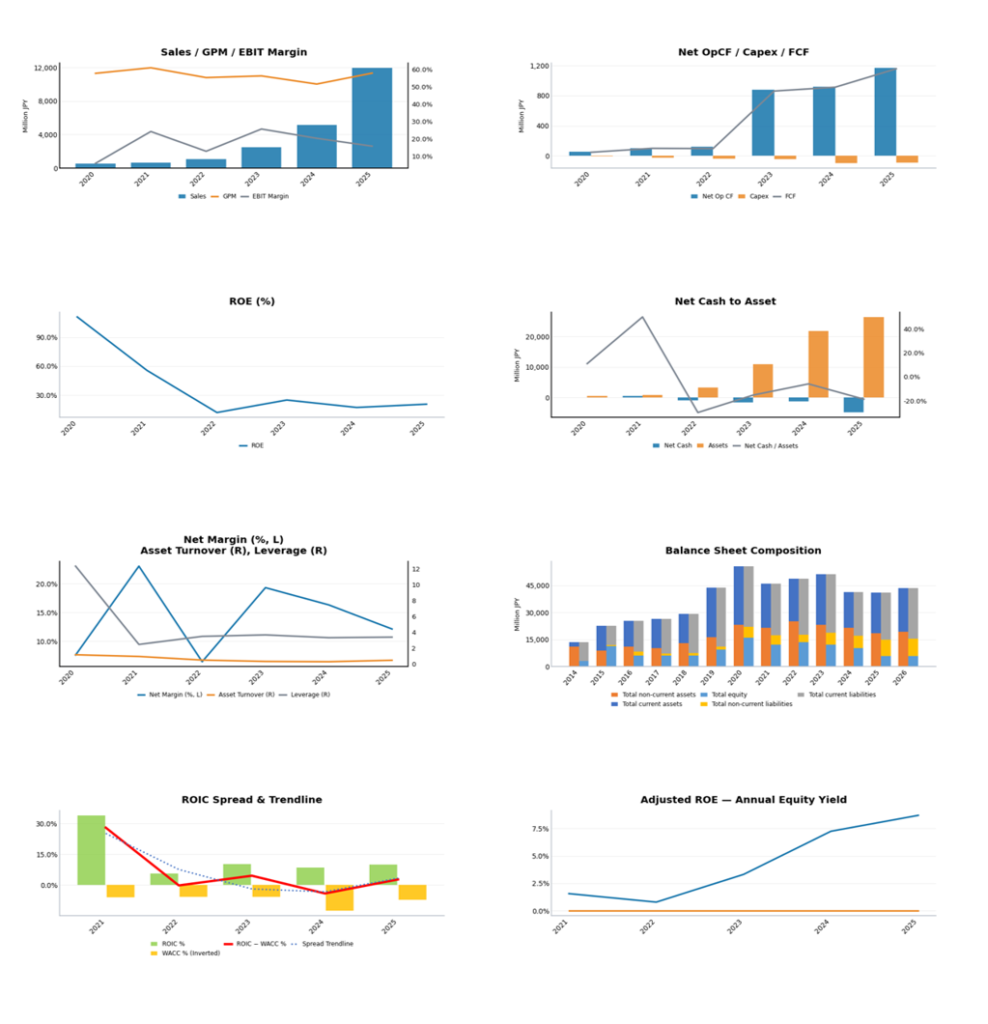
On a standalone quarterly basis, Marketing & School business profit increased to ¥737 million in Q3 from ¥614 million in Q2. AI & Technology business profit, by contrast, decreased to ¥326 million from ¥426 million, as product development, hiring and commercial investments continued. Consolidated Q3 operating profit was ¥892 million, a 20.1% margin. Meeting unchanged full-year operating profit guidance of ¥3.30 billion requires ¥762 million in Q4. Revenue has reached 87.1% of guidance, versus 76.9% for operating profit.
Quarterly business profit by domain and consolidated operating profit (¥100 million)

What Could Drive a Re-rating
At the November 13 close of ¥1,136, the shares trade at 7.3x guided earnings. The latest results support the underlying growth case, but the discount also reflects ¥13.38 billion of goodwill, borrowings, contingent consideration, liabilities associated with non-controlling interests, and a complex capital structure. Equity attributable to owners rose to ¥8.63 billion, while cash equivalents declined to ¥7.73 billion. No nine-month cash flow statement was prepared, so the latest earnings do not establish an improvement in free cash flow. Over the next one to two years, a recovery in AI margins will be crucial; over three to four years, post-acquisition ROIC and sustainable cash generation will be key to valuation. We intend to reassess the formal rating and fair value in a forthcoming Update Report after further review of the results and management commentary.
Company profile
Founded in 2006, f-code provides digital marketing, online education, AI implementation and software development. It has expanded through acquisitions and post-deal integration, operating across Marketing & School and AI & Technology.
Notes: Share price is the November 13 close, before the earnings release. BPS is calculated using September 30 equity attributable to owners of ¥8,626,245 thousand divided by 12,280,145 shares outstanding excluding treasury shares. Implied ROE equals guided EPS divided by BPS. Quarterly figures are calculated by subtracting prior cumulative values.
Materials reviewed: FY12/2026 Q3 earnings release and presentation; September 4, 2026 Q2 Update Report; 6 Charts; 8 Charts; November 13 share-price history.
f-code Inc. (9211) | Share Price and Valuation History
f-code Inc. (9211) | Financial Performance, Balance Sheet and Capital Efficiency