2026-11-11
Home
Japanese

Omega Investment Co., Ltd.
Ricksoft (Investment report – 2Q update)
| Share price (11/13) | ¥656 | Dividend Yield (27/2 CE) | 0.0 % |
| 52weeks high/low | ¥1,049/637 | ROE(26/2 act) | 8.3 % |
| Avg Vol (3 month) | 4.8 thou shrs | Operating margin (TTM) | 3.5 % |
| Market Cap | ¥2.99 bn | Beta (5Y Monthly) | 0.10 |
| Enterprise Value | ¥1.93 bn | Shares Outstanding | 4.550 mn shrs |
| PER (27/2 CE) | 11.5 X | Listed market | TSE Growth |
| PBR (26/2 act) | 0.9 X |
| Click here for the PDF version of this page |
| PDF version |
Upward earnings revision initiates a share-price rerating. Gross profit margin recovery and capital efficiency are next.
Investment conclusion
We maintain our positive view of new investment expressed in the previous report. The upward revision to the company forecast on October 14 indicates that the earnings decline associated with structural reform is less severe than initially anticipated. Meanwhile, the gross profit margin for 2Q alone fell to 19.0%, leaving the challenge of translating sales growth into profit growth unresolved. Rather than focusing solely on the short-term rise in the share price, we favor a medium- to long-term assessment based on earnings recovery and progress in capital allocation.
On October 15, following the earnings announcement, the share price rose to an intraday high of 815 yen, temporarily gaining 10.7% from the October 14 closing price of 736 yen. It closed at 791 yen, up 7.5% from the previous day. Although the gain narrowed from the intraday high, the upward revision to the full-year earnings forecast prompted a reappraisal of the share price.
1. 2Q results and full-year plan
In 2Q alone of FY2/2027, net sales were 2.808 billion yen, up 24.5% YoY, and operating profit was 68 million yen, up 83.4% YoY. However, gross profit was virtually unchanged at 533 million yen versus 532 million yen a year earlier, while the gross profit margin fell from 23.6% to 19.0%. The rise in operating profit largely reflected lower SG&A expenses, which fell from 495 million yen to 465 million yen. The quality of growth therefore still requires careful examination.
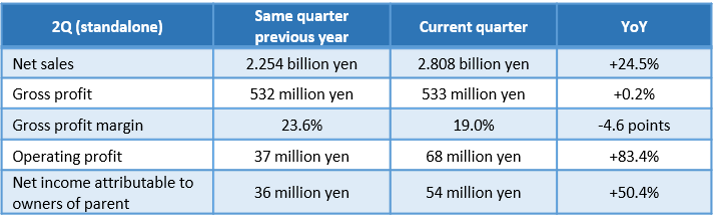
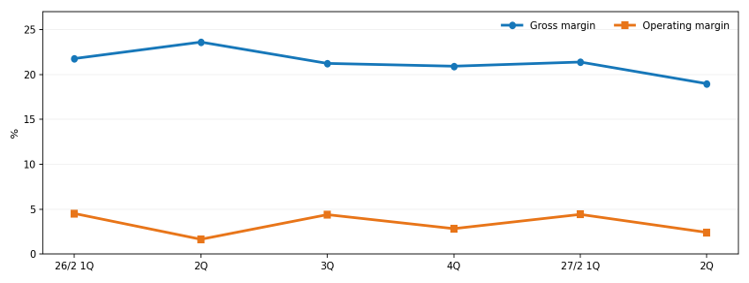
Figure 1: Quarterly gross profit margin and operating margin.
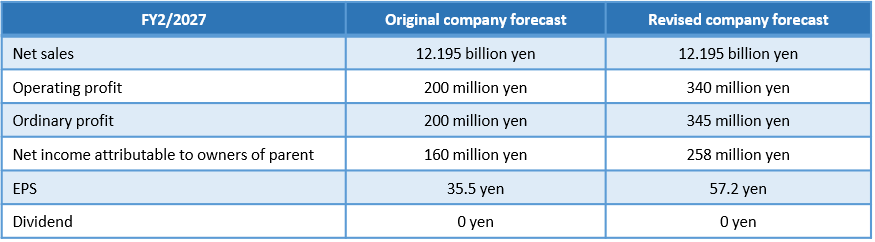
The Company raised its FY2/2027 operating profit forecast from 200 million yen to 340 million yen and its forecast net income attributable to owners of parent from 160 million yen to 258 million yen. Its net sales forecast was unchanged at 12.195 billion yen. First-half operating profit of 194 million yen represents approximately 57% of the revised full-year plan. Required operating profit in the second half is approximately 146 million yen, below the approximately 209 million yen earned in the previous year’s second half. Although structural reform costs may arise in the second half, we believe the company plan incorporates conservative assumptions.
These results matter not only because both net sales and operating profit exceeded year-earlier levels, but also because the gross profit margin declined during the same period. The margin decreased from 21.4% in 1Q to 19.0% in 2Q and was below the year-earlier level for a second consecutive quarter. Because procurement costs rise as license-related sales grow, sales growth cannot be equated with improved profitability. For investors, the sustainability of higher sales and the amount of gross profit generated from that growth are central to valuation.
Meanwhile, operating profit rose from 37 million yen a year earlier to 68 million yen. Cost management has delivered some results, demonstrating that operating profit can recover through SG&A restraint even when gross profit is nearly flat. However, cost reductions alone have limits on sustaining operating profit growth. Going forward, we want to assess whether the Company can increase operating profit through higher gross profit while continuing recruitment and overseas expansion.
First-half operating profit of 194 million yen is about 57% of the revised full-year forecast of 340 million yen. The required second-half operating profit of 146 million yen is below the year-earlier level. Even allowing for investment costs and one-time expenditures later in the year, we believe the company’s plan is relatively achievable. Nevertheless, the high first-half progress rate alone should not be taken as grounds to assume another upward revision; second-half SG&A expenses, license procurement costs, and changes in the service mix also need to be considered.
In comparing profits with the previous year, it is also worth noting that the operating margin in 2Q of FY2/2026 was low at 1.7%. Although the latest operating margin of 2.4% represents an improvement, it is below the 4.4% recorded in 1Q and the 3.5% for the full FY2/2026. To conclude that earnings power is recovering sustainably, the underlying operating margin needs to improve beyond quarter-to-quarter fluctuations.
2. Business structure and Reignite2030
Technology Solutions underpins the customer base and sales scale, primarily through Atlassian products. However, it is sensitive to license procurement costs, making it difficult for gross profit to grow at the same rate as sales. Professional Services converts customer relationships into earnings through design, implementation, and operational support, while In-house Products supports recurring sales and overseas expansion. The latest decline in the company-wide gross profit margin suggests that growth in these higher-value-added areas may not yet be sufficient to offset deteriorating profitability in the license business.
Reignite2030 calls for cumulative investment of 6.0 billion yen through 2030 and EBITDA of 3.0 billion yen in 2030. However, the latest annual EBITDA was 435 million yen in FY2/2026, leaving a considerable gap to the target. To improve the plan’s credibility, the Company needs to quantify progress in consulting personnel utilization, project unit prices, customer renewal rates, recurring sales of proprietary products, and overseas operations’ earnings contributions.
Going forward, disclosure of gross profit and investment burdens in each service area, in addition to service-level net sales, will help investors assess progress in business restructuring.
The three service areas are best viewed not as independent businesses but as an integrated mechanism for expanding transactions with corporate customers. Technology Solutions establishes customer relationships through Atlassian implementation and cloud migration; Professional Services deepens involvement in business process design, system implementation, and operational support; and In-house Products expands relationships through continued product use. Enterprise value depends not only on growth in license sales but also on how much higher-value-added service revenue can be generated from that customer base.
In Technology Solutions, demand for cloud migration and renewals from existing customers underpin sales. Meanwhile, supplier pricing and changes in license composition affect profitability, so it’s important to examine net sales growth separately from gross profit growth. Key metrics include the share of cloud licenses, renewal rates, transactions with major customers, sales per customer, and the impact of changes in procurement prices on the gross profit margin. The company-wide margin decline in 2Q again underscores the need to examine these profitability drivers.
Professional Services converts customer relationships into recurring earnings through design, system implementation, operations, and training after license sales. Net sales increased 16.3% YoY in the preceding 1Q. However, in the current investment assessment, we place emphasis not only on sales growth but also on how project unit prices, personnel utilization, order backlog, and contract continuation rates support profit. Because increasing personnel entails upfront costs, it is necessary to monitor not only the increase in the number of hires but also the period until they begin working on projects and improvements in profitability.
In-house Products seeks to diversify earnings sources through sales of software that complements Atlassian products. If recurring billing and renewals accumulate while the marginal cost of acquiring additional customers remains contained, this area could improve both the gross profit margin and capital efficiency. We want to continue tracking domestic and overseas contract counts, renewal rates, churn rates, sales per customer, and the overseas sales ratio. Net sales grew 5.0% YoY in the preceding 1Q, but information on profit is needed to measure the contribution to company-wide earnings.
The EBITDA target of 3.0 billion yen in 2030 under Reignite2030 requires substantial growth from the FY2/2026 result of 435 million yen. For cumulative investment of 6.0 billion yen to create value, incremental profit must match invested capital, rather than simply expanding sales scale. Annual disclosure of recruitment, investment spending by business, incremental gross profit, and EBITDA contribution would strengthen market confidence in the long-term plan.
In overseas expansion, groundwork has taken precedence, including the U.S. operation, an alliance with a Vietnamese company, and the establishment of Ricksoft Singapore. The expected roles are to broaden sales destinations and extend implementation and operational support to overseas offices of domestic customers. However, opening offices does not itself signify profit growth. Once overseas project counts, customer numbers, gross profit, and earnings contributions by operation become measurable, prospects for future growth should be reflected more concretely in share-price valuation.
3. Contract liabilities and future earnings
The Company accumulates contract liabilities arising from customer advances alongside prepaid expenses arising from prepayments to suppliers for license fees and other costs. Contract liabilities indicate sales to be recognized in the future, but their recognition as sales does not itself guarantee high profitability. It has not been established that prepaid expenses and contract liabilities correspond one-to-one for every contract, and the difference between them should not be treated as surplus cash.
At the end of 2Q of FY2/2027, contract liabilities amounted to 5.272 billion yen and prepaid expenses to 4.420 billion yen. Disclosure of amounts transferred from contract liabilities to sales, corresponding costs, and gross profit would be most useful in assessing future earnings.
Contract liabilities represent payments received from customers in advance that will be recognized as net sales as services are delivered or contract periods elapse. Prepaid expenses, by contrast, include license procurement costs and other amounts paid to suppliers that will be expensed in line with future revenue recognition. Their concurrent increase reflects a business model in which future revenues and costs appear on the balance sheet ahead of recognition in profit and loss. Accordingly, even when contract liabilities are viewed similarly to order backlog, it would be inappropriate to estimate future profit without examining the corresponding costs.
Contract liabilities of 5.272 billion yen at the end of 2Q increased by 796 million yen from 4.476 billion yen at the end of FY2/2026. The accumulation of continuing customer contracts improves sales visibility but does not necessarily raise profit margins. Even as contract liabilities increase, higher procurement prices or changes in the sales mix may reduce the gross profit margin and limit the benefit to shareholders. The decline in the gross profit margin seen in 2Q again indicates that profitability at the time of conversion to sales should be emphasized over the size of the balance.
The difference between contract liabilities of 5.272 billion yen and prepaid expenses of 4.420 billion yen is 852 million yen. However, because it has not been confirmed that all disclosed items correspond to the same contracts on a one-to-one basis, this difference cannot be regarded as future profit or available surplus cash. In addition, trade payables, accrued expenses, and the timing of recognition for each contract period also affect working capital. The assessment of financial soundness should not be conflated with the assessment of future earnings; their respective roles should be considered separately.
Going forward, we want to track not only period-end contract liabilities but also the amounts recognized as sales during the period, related costs, gross profit, and contract continuation rates. If these measures improve, we could evaluate the development as a qualitative enhancement of recurring earnings rather than simply an increase in license sales. For a share-price reappraisal, the depth of profits generated by future sales matters as much as the size of those sales.
4. Finance, capital efficiency, and capital allocation
Cash and short-term investments at the end of 2Q were 3.720 billion yen, total debt was zero, and net debt was negative 3.720 billion yen. Cash declined by 182 million yen from 3.902 billion yen at the end of 1Q. Although cash exceeds market capitalization of 3.599 billion yen based on the October 15 closing price, we do not regard the entire balance as surplus funds without considering working capital associated with contract liabilities and investment expenditures under the 2030 plan.
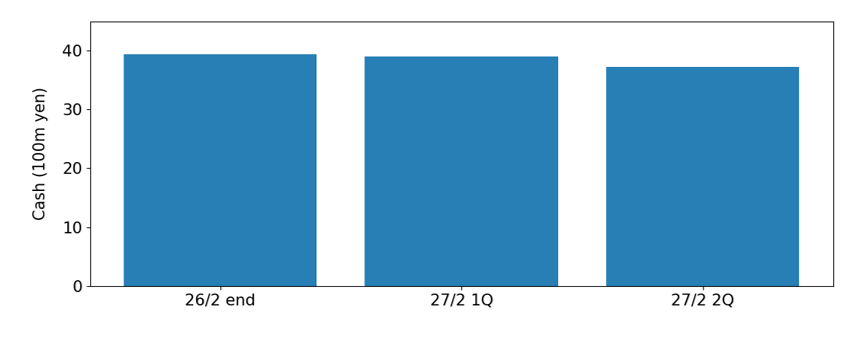
Figure 2: Trends in cash and short-term investments
The net-cash-adjusted PER is -0.5 times. This is the arithmetic result of cash exceeding market capitalization in the denominator and should not be compared on the same basis as ordinary earnings multiples. An estimate of surplus funds after deducting working capital and required investments is essential.
A financial structure in which cash exceeds market capitalization supports the Company’s ability to respond to changes in business conditions and structural reform costs. However, customer advances and prepayments to suppliers arise concurrently in this business. Cash on the balance sheet does not necessarily represent funds immediately available for shareholder returns or acquisitions. It is reasonable to assess capital allocation flexibility only after accounting for liquidity needed to maintain operations, contractual payment obligations, and spending on recruitment and overseas operations.
Cash and deposits were 3.939 billion yen at the end of FY2/2026, 3.902 billion yen at the end of 1Q of FY2/2027, and 3.720 billion yen at the end of 2Q. The decline in cash need not immediately be interpreted as a deterioration in financial condition, but cash flow can fluctuate substantially with changes in contract liabilities, prepaid expenses, and trade payables. In addition to cash balances, the Company’s underlying ability to generate cash from its operations, excluding working capital factors, requires continued attention.
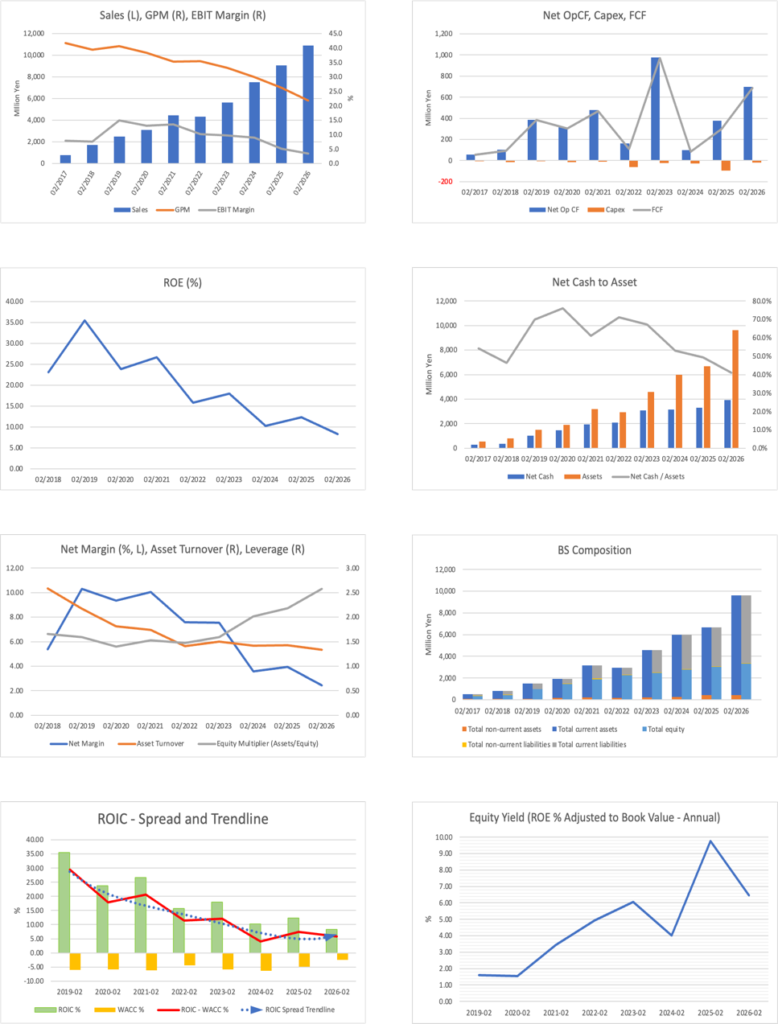
In terms of capital efficiency, ROE declined from 26.7% in FY2/2021 to 8.3% in FY2/2026. The Company is pursuing a transformation of its business structure through growth investment, but expanding enterprise value requires generating profits that exceed the increase in invested capital. For ROIC, we want to compare investment amounts with earnings contributions over time, rather than focusing only on a temporary recovery in profit, and assess whether returns are moving above the cost of capital.
The Company also forecasts no dividend for FY2/2027. It is reasonable for a growth company to prioritize internal funds for future investment, but when ROE is declining over an extended period, it becomes important to provide greater detail on the allocation of investment funds and the outlook for their recovery. If the priorities and funding amounts for growth investment, corporate acquisitions, share repurchases, and dividends are presented quantitatively, it will become easier for the market to reflect the value of surplus cash in the current share price.
5. Share price, valuation, and market expectations
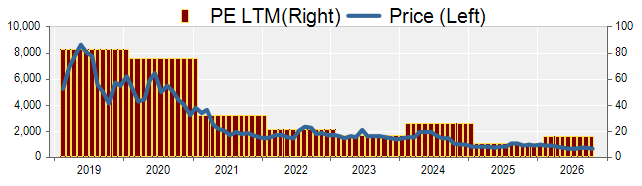
The divergence between sales growth and declining profit margins has contributed to the share price decline since 2023. Net sales expanded from 4.431 billion yen in FY2/2021 to 10.893 billion yen in FY2/2026, while the operating margin declined from 13.6% to 3.5% and ROE from 26.7% to 8.3%. Against a year-to-date high of 1,049 yen in January 2026, the share price was 685 yen at the end of July. The latest upward revision provides grounds to reconsider the long-term downward trend, but sustained multiple expansion remains difficult to assume while the gross profit margin continues to decline.
At a share price of 791 yen, forecast PER is 13.8 times, PBR is 1.03 times, and forecast ROE under the simplified method is 7.4%. Under a simplified earnings capitalization model assuming an 8.0% cost of equity and no dividends, the market prices in a long-term EPS growth rate of about 0.8%. However, the growth rate inferred from PER for a non-dividend-paying company is sensitive to the reinvestment efficiency of retained earnings and should be treated only as an indication. The five-year CAGR from EPS of 103.6 yen in FY2/2021 to 58.7 yen in FY2/2026 was negative 10.7%.
Estimated fair values under three methods are presented below. The PBR method assumes BPS of 770.81 yen and an appropriate PBR of 1.0 to 1.3 times. The DCF method incorporates a gradual improvement at a discount rate of 8% to 9% and a perpetual growth rate of 1%, while the ROIC method assumes a medium-term return on invested capital of 6% to 8%. However, the DCF and ROIC price ranges are approximate estimates reconsidered in light of the current earnings outlook using the previous models; because detailed projected cash flow schedules have not been prepared, the valuation remains provisional.

The median of the central values under the three methods is 925 yen, and the overall range is 771 yen to 1,250 yen. The upside from 791 yen to the median is 16.9%. Although the previous median of 925 yen has been maintained, this remains a provisional estimate reflecting both the value added by the latest upward earnings revision and the negative impact of the 2Q decline in the gross profit margin. It will be finalized after new detailed DCF and ROIC calculations are completed.
To understand the share-price decline since 2023, It is necessary to examine trends in profit margins and capital efficiency, not just net sales. The Company’s net sales expanded from 4.431 billion yen in FY2/2021 to 10.893 billion yen in FY2/2026, while its operating margin declined from 13.6% to 3.5% over the same period. As shareholders’ earnings failed to keep pace with business expansion, the valuation multiple applied to the Company as a growth stock contracted. The initial FY2/2027 company plan, which projected a substantial profit decline, also appears to have reinforced the market’s cautious view of profitability.
The October 15 share price of 791 yen was 7.5% above the October 14 close of 736 yen, but the gain narrowed from the intraday high of 815 yen. The upward revision to the full-year operating profit forecast provided a buying catalyst, but did not immediately resolve concerns over the declining gross profit margin. Since low share liquidity may amplify short-term fluctuations, we intend to focus on whether margins continue to improve, alongside trading volume.
The forecast PER of 13.8 times is lower than the multiple based on the original EPS forecast of 35.5 yen, largely because the earnings forecast forming the denominator has improved. PBR of 1.03 times places the share price close to BPS, reflecting both the value of the large cash balance and caution over the lower ROE. The historical five-year EPS CAGR is negative 10.7%, versus a long-term EPS growth expectation of approximately 0.8% under the simplified model. However, for a company that pays no dividend and reinvests retained earnings, the implied growth rate is sensitive to assumptions and should not be treated as the market’s only outlook.
The three fair value methods are presented together to illustrate differing assumptions about the pace of future earnings recovery and capital efficiency. The PBR method is based on current shareholders’ equity, DCF on future cash-generation capacity, and ROIC on the recovery in profits relative to invested capital. Given the current decline in gross profit margin, it would be premature to fully incorporate the ambitious 2030 EBITDA target into the share price. For the price to approach the upper end of the valuation range, achieving the profit plan must be accompanied by improved ROIC and evidence of investment recovery.
The upside to the median fair value of 925 yen is 16.9%. Although the shares retain medium- to long-term investment appeal, the valuation gap has narrowed after the October 15 rise, compared with the 31.2% upside previously estimated at a share price of 705 yen. Future returns depend not on the size of the cash balance alone but on further improvements in earnings forecasts and the degree to which the market regards margin recovery as sustainable.
6. Shareholder composition
As of October 15, 2026, HS held 43.95%, Hikari Tsushin 10.81%, Mr. Hiroshi Onuki 3.28%, Mr. Norio Hattori 2.47%, Sawakami Asset Management 1.91%, and SPARX Asset Management 1.25%. The shareholder distribution, with a free float of 36.9% and institutional ownership of 3.16%, supports management stability but limits large investors’ ability to build positions and limits liquidity in the market’s price-formation process. Hikari Tsushin’s ownership ratio differs from that in the previous report, but given the difference in reporting dates, it should not be hastily concluded that the Company increased its holdings in the short term.
With HS holding 43.95% and Hikari Tsushin 10.81%, major shareholders exert considerable influence. While this ownership structure provides stability as management pursues medium- to long-term initiatives, it also tends to limit the number of shares available for trading.
For a sustained share-price reappraisal, expanding the investor base is important alongside earnings improvement. We want to monitor disclosure of business profitability through investor presentations and English-language communications, changes in the holdings of major shareholders including Hikari Tsushin, and trading volume. It should also be noted that, because reporting dates differ among shareholders, short-term trading trends should not be inferred simply from changes in ownership ratios over time.
7. Conditions for share-price reappraisal and monitoring items
First is an improvement in the gross profit margin. A recovery from 19.0% to the low 20% range would make it easier to explain how sales growth translates into profit growth. Second is disclosure of personnel utilization, project profitability, and license renewal rates that support operating profit growth from the next fiscal year onward. Third is presentation of annual spending and profit recovery for the cumulative 6.0 billion yen investment program, together with clarification of a capital allocation policy that takes required working capital into account.
Further share-price gains will require not only another upward revision to the company forecast but also evidence that structural reform is improving gross profit. Conversely, persistently rising procurement costs, upfront personnel investment, and increasing overseas expansion expenses are major downside factors.
Initially, we want to see whether a rising sales share of higher-value-added services, together with changes in procurement terms, is reflected in the company-wide profit margin. If the gross profit margin continues to decline, it will be difficult to assess the sustainability of operating profit improvements driven by SG&A reductions.
Next, we want to monitor progress toward the revised full-year operating profit plan of 340 million yen. The second-half operating profit plan is 146 million yen, and achieving the full-year plan alone would mean a smaller profit decline than initially expected. Meanwhile, another upward earnings revision would require either a recovery in the gross profit margin or cost restraint that again exceeds expectations. It would be desirable for the Company to explain the relationship between quarterly gross profit and investment costs.
Over the medium to long term, key indicators will include Reignite2030 investment amounts and profit contributions, overseas business profitability, Professional Services utilization, and recurring revenue from In-house Products. In addition, if a capital allocation policy and shareholder return measures that take working capital into account are presented, the path for linking financial soundness to enhanced enterprise value will become clearer. Conversely, if procurement costs keep rising while personnel investment and overseas expenses occur ahead of earnings, profit margins may fail to recover even as sales increase.
8. Final evaluation
The latest upward revision to the full-year earnings forecast supports the positive view of new investment expressed in the previous report. The prolonged share-price decline reflected not merely slower growth but also the failure of sales expansion to translate into higher profits and capital efficiency. The latest results suggest the beginning of improvement. We favor a positive medium- to long-term investment view, focusing on a recovery in underlying earnings power and disciplined capital allocation.
Although 2Q showed higher net sales and improved operating profit, earnings quality remains a concern. Given the gross profit margin of 19.0%, it is difficult to assign a high degree of confidence to the Company’s long-term growth plan immediately. However, the Company’s upward revision to its full-year profit outlook indicates that the earnings deterioration caused by structural reform is not as severe as initially planned and provides new support for the previous investment conclusion.
Over the next one to two years, a recovery in gross profit margin, improved earnings forecasts, and capital allocation disclosure are likely to drive a share-price reappraisal. Over three to four years, the key question is whether closer integration among the three service areas creates greater added value and enables ROIC and ROE to improve again. Although the share price of 791 yen has risen from the previous report, there is still scope for a reappraisal of enterprise value over the medium to long term if profitability continues to improve. We maintain our positive view of new investment while continuing to evaluate whether the Company can translate sales growth into profit growth.
Notes
The share price of 791 yen is the closing price on October 15, 2026. The intraday high was 815 yen, versus the previous day’s closing price of 736 yen on October 14. Forecast EPS of 57.4 yen and dividends of zero yen are based on the revised company forecast of October 14, 2026. BPS of 770.81 yen is as of the end of August 2026. Forecast ROE under the simplified method is calculated by dividing forecast EPS by the latest BPS. Market capitalization is calculated using 4.5503 million shares outstanding.
Financial data are based on an external financial information provider and may differ in presentation, reclassifications, and rounding from the Company’s published figures. Valuations are our estimates and do not guarantee future share prices. The DCF and ROIC estimated prices are provisional values based on the previous valuation ranges.
Key stock price data
Company profile
Ricksoft is an information and communications company that supports the modernization of corporate business systems and collaboration environments, primarily through the sale, implementation, and operational support of Atlassian-related products. It operates in three areas, Technology Solutions, Professional Services, and In-house Products, and continuously supports customers from initial implementation through operation and improvement. Under Reignite2030, the Company is strengthening higher-value-added services and expanding overseas. It is listed on the Tokyo Stock Exchange Growth Market.
Key financial data
| Unit: million yen | 2022/2 | 2023/2 | 2024/2 | 2025/2 | 2026/2 | 2027/2 CE |
| Sales | 4,308 | 5,623 | 7,491 | 9,044 | 10,893 | 12,195 |
| EBIT (Operating Income) | 437 | 547 | 666 | 459 | 377 | 340 |
| Pretax Income | 450 | 567 | 350 | 462 | 357 | 345 |
| Net Profit Attributable to Owner of Parent | 327 | 424 | 269 | 356 | 264 | 258 |
| Cash & Short-Term Investments | 2,089 | 3,071 | 3,158 | 3,297 | 3,939 | |
| Total assets | 2,939 | 4,577 | 5,971 | 6,687 | 9,633 | |
| Total Debt | 0 | 0 | 0 | 0 | 0 | |
| Net Debt | -2,089 | -3,071 | -3,158 | -3,297 | -3,939 | |
| Total liabilities | 684 | 2,103 | 3,203 | 3,658 | 6,316 | |
| Total Shareholders’ Equity | 2,255 | 2,474 | 2,768 | 3,029 | 3,316 | |
| Net Operating Cash Flow | 161 | 978 | 100 | 377 | 697 | |
| Capital Expenditure | 61 | 25 | 30 | 95 | 18 | |
| Net Investing Cash Flow | -47 | -27 | -37 | -140 | -35 | |
| Net Financing Cash Flow | 23 | 18 | 7 | -91 | 0 | |
| Free Cash Flow | 110 | 968 | 86 | 298 | 687 | |
| ROA (%) | 10.69 | 11.28 | 5.10 | 5.62 | 3.23 | |
| ROE (%) | 15.73 | 17.92 | 10.26 | 12.27 | 8.31 | |
| EPS (Yen) | 74.5 | 94.4 | 59.2 | 78.6 | 58.7 | 57.4 |
| BPS (Yen) | 507.2 | 547.4 | 608.3 | 676.1 | 737.0 | |
| Dividend per Share (Yen) | 0.00 | 0.00 | 0.00 | 0.00 | 0.00 | 0.00 |
| Shares Outstanding (Million shares) | 4.37 | 4.51 | 4.55 | 4.55 | 4.55 |
Source: Omega Investment from company data, rounded to the nearest whole number.
Share price
Financial data (quarterly basis)
| Unit: million yen | 2025/2 | 2026/2 | 2027/2 | ||||||
| 2Q | 3Q | 4Q | 1Q | 2Q | 3Q | 4Q | 1Q | 2Q | |
| (Income Statement) | |||||||||
| Sales | 2,263 | 2,289 | 2,445 | 2,872 | 2,254 | 2,944 | 2,822 | 2,840 | 2,808 |
| Year-on-year | 18.7% | 25.8% | 11.5% | 40.3% | -0.4% | 28.6% | 15.4% | -1.1% | 24.5% |
| Cost of Goods Sold (COGS) | 1,703 | 1,711 | 1,826 | 2,247 | 1,722 | 2,319 | 2,231 | 2,233 | 2,274 |
| Gross Income | 560 | 577 | 619 | 625 | 532 | 625 | 590 | 608 | 533 |
| Gross Income Margin | 24.7% | 25.2% | 25.3% | 21.8% | 23.6% | 21.2% | 20.9% | 21.4% | 19.0% |
| SG&A Expense | 485 | 493 | 468 | 495 | 495 | 496 | 510 | 482 | 465 |
| EBIT (Operating Income) | 76 | 84 | 151 | 130 | 37 | 129 | 80 | 126 | 68 |
| Year-on-year | -48.0% | -42.3% | -33.5% | -11.9% | -50.7% | 53.6% | -47.0% | -3.3% | 83.4% |
| Operating Income Margin | 3.3% | 3.7% | 6.2% | 4.5% | 1.7% | 4.4% | 2.8% | 4.4% | 2.4% |
| EBITDA | 83 | 97 | 167 | 145 | 51 | 144 | 95 | 140 | 84 |
| Pretax Income | 77 | 85 | 145 | 97 | 41 | 135 | 84 | 128 | 71 |
| Consolidated Net Income | 62 | 68 | 111 | 74 | 36 | 102 | 52 | 93 | 54 |
| Minority Interest | 0 | 0 | 0 | 0 | 0 | 0 | 0 | 0 | 0 |
| Net Income ATOP | 62 | 68 | 111 | 74 | 36 | 102 | 52 | 93 | 54 |
| Year-on-year | -143.6% | -48.5% | -37.3% | -35.5% | -42.5% | 51.1% | -53.2% | 24.8% | 50.4% |
| Net Income Margin | 2.7% | 3.0% | 4.5% | 2.6% | 1.6% | 3.5% | 1.8% | 3.3% | 1.9% |
| (Balance Sheet) | |||||||||
| Cash & Short-Term Investments | 3,442 | 3,192 | 3,297 | 3,142 | 3,930 | 3,782 | 3,939 | 3,902 | 3,720 |
| Total assets | 6,588 | 6,004 | 6,687 | 7,365 | 7,533 | 8,426 | 9,639 | 9,872 | 9,407 |
| Total Debt | 0 | 0 | 0 | 0 | 0 | 0 | 0 | 0 | 0 |
| Net Debt | -3,442 | -3,192 | -3,297 | -3,142 | -3,930 | -3,782 | -3,939 | -3,902 | -3,720 |
| Total liabilities | 3,661 | 3,083 | 3,658 | 4,275 | 4,397 | 5,158 | 6,323 | 6,451 | 5,929 |
| Total Shareholders’ Equity | 2,927 | 2,921 | 3,029 | 3,090 | 3,137 | 3,268 | 3,316 | 3,421 | 3,478 |
| (Profitability %) | |||||||||
| ROA | 8.53 | 7.12 | 5.62 | 4.61 | 4.08 | 4.48 | 3.23 | 3.27 | 3.54 |
| ROE | 18.03 | 15.31 | 12.27 | 10.52 | 9.51 | 10.43 | 8.31 | 8.67 | 9.08 |
| (Per-share) Unit: JPY | |||||||||
| EPS | 13.6 | 15.1 | 24.8 | 16.6 | 7.9 | 22.7 | 11.5 | 20.6 | 11.9 |
| BPS | 643.9 | 652.0 | 676.1 | 689.7 | 697.1 | 726.3 | 737.0 | 760.2 | 770.8 |
| Dividend per Share | 0.00 | 0.00 | 0.00 | 0.00 | 0.00 | 0.00 | 0.00 | 0.00 | 0.00 |
| Shares Outstanding(million shares) | 4.55 | 4.55 | 4.55 | 4.55 | 4.55 | 4.55 | 4.55 | 4.55 | 4.55 |
Source: Omega Investment from company materials
Financial data (full-year basis)
| Unit: million yen | 2020 | 2021 | 2022 | 2023 | 2024 | 2025 | 2026 |
| (Income Statement) | |||||||
| Sales | 3,089 | 4,431 | 4,308 | 5,623 | 7,491 | 9,044 | 10,893 |
| Year-on-year | 24.4% | 43.5% | -2.8% | 30.5% | 33.2% | 20.7% | 20.4% |
| Cost of Goods Sold | 1,904 | 2,868 | 2,779 | 3,759 | 5,249 | 6,670 | 8,519 |
| Gross Income | 1,184 | 1,563 | 1,529 | 1,864 | 2,242 | 2,374 | 2,373 |
| Gross Income Margin | 38.3% | 35.3% | 35.5% | 33.1% | 29.9% | 26.2% | 21.8% |
| SG&A Expense | 782 | 961 | 1,091 | 1,317 | 1,576 | 1,915 | 1,997 |
| EBIT (Operating Income) | 402 | 602 | 437 | 547 | 666 | 459 | 377 |
| Year-on-year | 8.3% | 49.6% | -27.3% | 25.0% | 21.7% | -31.1% | -17.8% |
| Operating Income Margin | 13.0% | 13.6% | 10.2% | 9.7% | 8.9% | 5.1% | 3.5% |
| EBITDA | 416 | 617 | 467 | 566 | 691 | 502 | 435 |
| Pretax Income | 403 | 601 | 450 | 567 | 350 | 462 | 357 |
| Consolidated Net Income | 289 | 446 | 327 | 424 | 269 | 356 | 264 |
| Minority Interest | 0 | 0 | 0 | 0 | 0 | 0 | 0 |
| Net Income ATOP | 289 | 446 | 327 | 424 | 269 | 356 | 264 |
| Year-on-year | 13.0% | 54.3% | -26.7% | 29.7% | -36.5% | 32.2% | -25.8% |
| Net Income Margin | 9.4% | 10.1% | 7.6% | 7.5% | 3.6% | 3.9% | 2.4% |
| (Balance Sheet) | |||||||
| Cash & Short-Term Investments | 1,458 | 1,944 | 2,089 | 3,071 | 3,158 | 3,297 | 3,939 |
| Total assets | 1,922 | 3,180 | 2,939 | 4,577 | 5,971 | 6,687 | 9,633 |
| Total Debt | 0 | 0 | 0 | 0 | 0 | 0 | 0 |
| Net Debt | -1,458 | -1,944 | -2,089 | -3,071 | -3,158 | -3,297 | -3,939 |
| Total liabilities | 484 | 1,279 | 684 | 2,103 | 3,203 | 3,658 | 6,316 |
| Total Shareholders’ Equity | 1,437 | 1,901 | 2,255 | 2,474 | 2,768 | 3,029 | 3,316 |
| (Cash Flow) | |||||||
| Net Operating Cash Flow | 316 | 478 | 161 | 978 | 100 | 377 | 697 |
| Capital Expenditure | 13 | 9 | 61 | 25 | 30 | 95 | 18 |
| Net Investing Cash Flow | -43 | -8 | -47 | -27 | -37 | -140 | -35 |
| Net Financing Cash Flow | 152 | 19 | 23 | 18 | 7 | -91 | 0 |
| Free Cash Flow | 303 | 469 | 110 | 968 | 86 | 298 | 687 |
| (Profitability ) | |||||||
| ROA (%) | 16.97 | 17.47 | 10.69 | 11.28 | 5.10 | 5.62 | 3.23 |
| ROE (%) | 23.80 | 26.70 | 15.73 | 17.92 | 10.26 | 12.27 | 8.31 |
| Net Margin (%) | 9.35 | 10.06 | 7.59 | 7.54 | 3.59 | 3.93 | 2.42 |
| Asset Turn | 1.81 | 1.74 | 1.41 | 1.50 | 1.42 | 1.43 | 1.33 |
| Assets/Equity | 1.40 | 1.53 | 1.47 | 1.59 | 2.01 | 2.18 | 2.57 |
| (Per-share) Unit: JPY | |||||||
| EPS | 68.5 | 103.6 | 74.5 | 94.4 | 59.2 | 78.6 | 58.7 |
| BPS | 336.0 | 436.6 | 507.2 | 547.4 | 608.3 | 676.1 | 737.0 |
| Dividend per Share | 0.00 | 0.00 | 0.00 | 0.00 | 0.00 | 0.00 | 0.00 |
| Shares Outstanding (million shares) | 4.20 | 4.29 | 4.37 | 4.51 | 4.55 | 4.55 | 4.55 |
Source: Omega Investment from company materials