2025-07-01
Home
Japanese

Omega Investment Co., Ltd.
Kidswell Bio (Company note 2Q update)

| Share price (11/24) | ¥511 | PER(21/3 CE) | – X |
| 52weeks high/low | ¥864/393 | PBR(21/3 act) | 8.67 X |
| ADVT ( ¥ mn, monthly) | ¥76 mn | ROE(21/3act) | -68.50% |
| Shrs out. | 31.434 mn, shrs | Mkt cap | ¥16.0 bn |
| Listed market | TSE Mothers | Shr eqty ratio (21/9) | 48.0% |
| Click here for the PDF version of this page |
| 4584KWB2021Q2_EN1125 |
The company’s business progresses as planned at the beginning of the term, and the production of the master cell bank for SHED starts in accordance with GMP (good manufacturing practice)
◇Financial results in 2Q of FY 3/2022:Sales increased 4 times year-on-year, and loss shrank
For 2Q of FY 3/2022, the company posted net sales of 740 million yen (up 324.5% year-on-year), an operating loss of 450 million yen (an operating loss of 682 million yen in the same period of the previous year), an ordinary loss of 463 million yen (an ordinary loss of 693 million yen in the same period of the previous year) and a net loss of 463 million yen (a net loss of 696 million yen in the same period of the previous year).
Filgrastim BS (GBS-001) and Darbepoetin alfa BS (GBS-011), which are the mainstay biosimilars (BS), performed well. In addition, sales of APIs related to the development of API manufacturing process for the 4th biosimilar product were recorded. On the other hand, the final development cost for the completion of the Master Cell Bank (MCB) for SHED in the regenerative medicine business was recorded in the cost of sales. Gross profit margin fell 14.3 pts. year-on-year. R&D expenses in SG&A included development investment for approval for Ranibizumab BS (GBS-007), whose posting was delayed from the previous term. Other SG&A expenses decreased by 27 million yen from the previous fiscal year due to continuous efforts to improve cost efficiency. As a result, deficit has narrowed from the same period of the previous year for all kinds of profits, including operating profit.
On the balance sheet, cash and deposits decreased by 486 million yen from the end of March 2021. On the other hand, work in process increased by 237 million yen, and total assets reached 3,859 million yen (3,933 million yen at the end of March 2021).
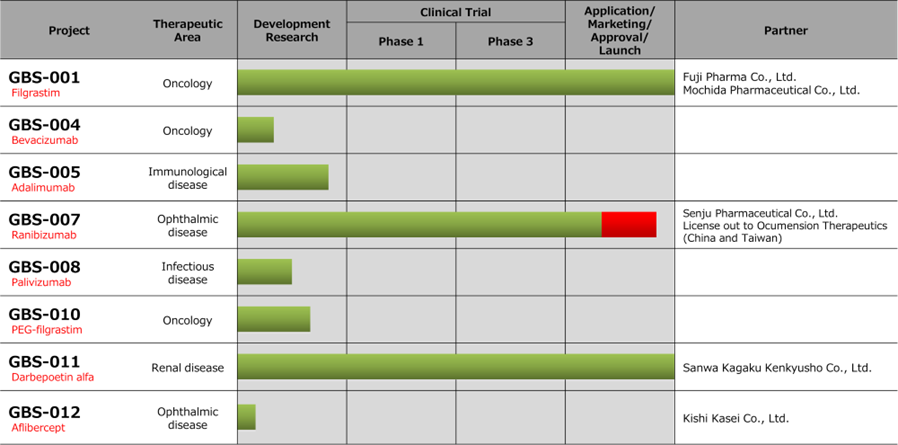
◇Biosimilar business: The company obtained the approval for manufacturing and marketing of GBS-007
*GBS-007 : The company has obtained the approval for the manufacturing and sales of the third product in the biosimilar business. Senju Pharmaceutical is a development partner for the biosimilar of ranibizumab, an anti-VEGF antibody drug for the treatment of AMD (age-related macular degeneration). It will be the first BS in the field of ophthalmology. The anti-VEGF antibody drug market in Japan alone is less than 100 billion yen in FY 2020. Of these, Lucentis (Novartis Pharma), which is considered to be a direct competitor, accounts for about 27 billion yen. Although it depends on the drug, some biosimilars take more than half the market share on a quantity basis after the launch. The details of the contract with Senju Pharmaceutical have not been disclosed, but the acquisition of manufacturing and sales approval is expected to contribute to profits from this term.
*GBS-001, GBS-011 : For GBS-001 and GBS-011, which have already been launched by the business partners, the revenues from sale of APIs and royalties have been steadily increasing. The company is also taking continuous cost reduction measures to improve profitability.
*Fourth biosimilar : In addition to the above three items, the company is developing a fourth biosimilar. In 2Q, the sales of APIs related to the development of API manufacturing process were recorded, and in the medium-term strategic plan, the company aims to launch the product by FY 2025.
|
JPY,mn,% |
Net sales |
YoY |
Oper. |
YoY |
Ord. |
YoY (%) |
Profit |
YoY (%) |
EPS |
|
2018/3 |
1,059 |
-2.7 |
-913 |
– |
-903 |
– |
-904 |
– |
-47.27 |
|
2019/3 |
1,021 |
-3.6 |
-805 |
– |
-816 |
– |
-856 |
– |
-43.84 |
|
2020/3 |
1,077 |
– |
-1,161 |
– |
-1,187 |
– |
-7,316 |
– |
-264.65 |
|
2021/3 |
996 |
-7.5 |
-969 |
– |
-991 |
– |
-1,001 |
– |
-34.79 |
|
2022/3 (CE) |
1,900 |
90.7 |
-1,720 |
– |
-1,740 |
– |
-1,323 |
– |
-58.18 |
|
2021/3 2Q |
174 |
-44.4 |
-682 |
– |
-693 |
– |
-696 |
– |
-24.49 |
|
2022/3 2Q |
740 |
324.5 |
-450 |
– |
-463 |
– |
-463 |
– |
-15.30 |
Progress of biosimilar business pipeline
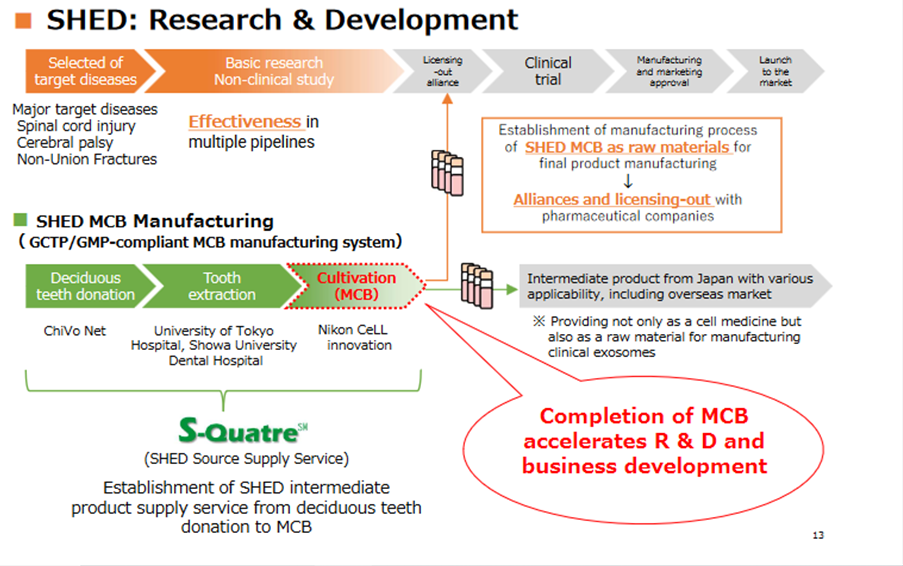
◇Regenerative medicine (cell therapy) business: Creation of a master cell bank and start of joint research on designer cells
In the regenerative medicine business, which the company will focus on in the future, progress has been made in the SHED supply system and the designer cell field.
*SHED: In advancing the SHED business, it is essential to establish a stable raw materials supply system for research and development. The company has made upfront investments in building the system over the past few years as it entered this business field. The progress of the SHED business has accelerated significantly by the start of GMP production, which is oriented toward the creation of the master cell bank (MCB). The company named the manufacturing system S-Quatre SM (SHED Source Supply Service). The service is scheduled to be provided not only as a cell medicine, but also as a raw material for manufacturing clinical exosomes.
MCB accelerates regenerative medicine business (SHED)
*Designer Cell:The company is also working on the development of “designer cells,” which are enhanced cell therapies, in order to achieve high therapeutic goals. The company announced on September 8 that it has signed a joint research agreement with NanoCarrier Co., Ltd. By combining the gene delivery technology that utilizes nanomicelles possessed by nanocarriers with the company’s SHED, the company will mainly develop an efficient method for introducing mRNAs into SHED, improve the therapeutic effect and disease site orientation with this method, and carry out joint research on the effectiveness of the gene transfer type designer SHED.
◇ Full-year outlook and progress of medium-term strategic plan
*Full-year outlook for FY 3/2022: At the interim announcement, the company retained its full-year guidance revealed at the beginning of the fiscal year. Sales achieved less than 40% of the full-year target, which assumes the income from GBS-007 during the remainder of the fiscal year. Excluding the one-off factors, gross profit is forecast to be 1 billion yen for the full year. One-time factors include sales and COGS resulting from the completion of the MCB and the drug substance sales and COGS related to the development of the drug substance manufacturing process for the 4th BS product.
*Goal of moving into the black in FY 3/2023: In the medium-term management plan, the company plans to make a profit in FY 3/2023. In FY 3/2023, GBS-007 will generate a full-year sales contribution, and milestone revenues look likely. As mentioned above, the company has already secured an underlying gross profit of 1 billion yen while the manufacturing and development costs of GBS-007 have peaked out. The company will keep R&D investments under control to accelerate licensing-out activities. With other SG&A expenses thoroughly controlled, the company aims to move into the black in FY 3/2023.
Financial data
|
FY (¥mn) |
2020/3 |
2021/3 |
2022/3 |
|||||||
|
1Q |
2Q |
3Q |
4Q |
1Q |
2Q |
3Q |
4Q |
1Q |
2Q |
|
|
[Statements of income] |
||||||||||
|
Net sales |
284 |
30 |
419 |
345 |
121 |
53 |
547 |
276 |
303 |
438 |
|
Cost of sales |
77 |
8 |
359 |
209 |
5 |
35 |
46 |
34 |
122 |
154 |
|
Gross profit |
207 |
22 |
60 |
136 |
116 |
19 |
500 |
242 |
182 |
283 |
|
SG&A expenses |
417 |
423 |
381 |
365 |
354 |
463 |
465 |
565 |
491 |
425 |
|
R&D expenses |
235 |
249 |
201 |
213 |
138 |
265 |
198 |
363 |
297 |
236 |
|
Operating loss |
-210 |
-401 |
-321 |
-229 |
-238 |
-445 |
36 |
-323 |
-309 |
-142 |
|
Non-operating income |
0 |
0 |
1 |
0 |
0 |
1 |
1 |
1 |
2 |
0 |
|
Non-operating expenses |
2 |
1 |
20 |
4 |
7 |
5 |
4 |
8 |
6 |
8 |
|
Ordinary loss |
-212 |
-402 |
-340 |
-233 |
-244 |
-450 |
33 |
-330 |
-314 |
-150 |
|
Extraordinary income |
4 |
0 |
0 |
2 |
||||||
|
Extraordinary expenses |
5,939 |
0 |
0 |
194 |
0 |
1 |
8 |
0 |
||
|
Loss before income taxes |
-6,147 |
-402 |
-340 |
-425 |
-244 |
-451 |
26 |
-331 |
-314 |
-148 |
|
Total income taxes |
1 |
0 |
3 |
-2 |
1 |
0 |
0 |
1 |
0 |
1 |
|
Net loss |
-6,147 |
-403 |
-342 |
-424 |
-245 |
-451 |
25 |
-330 |
-314 |
-149 |
|
[Balance Sheets] |
||||||||||
|
Current assets |
2,761 |
2,390 |
3,238 |
3,322 |
3,573 |
3,218 |
3,329 |
3,346 |
2,794 |
3,203 |
|
Cash equivalents and short-term securities |
1,654 |
1,602 |
2,482 |
2,033 |
2,658 |
2,502 |
1,830 |
1,461 |
874 |
974 |
|
Non-current assets |
330 |
427 |
418 |
270 |
379 |
393 |
340 |
588 |
728 |
656 |
|
Tangible assets |
2 |
2 |
2 |
2 |
2 |
2 |
2 |
3 |
3 |
2 |
|
Investments and other assets |
328 |
425 |
416 |
268 |
374 |
389 |
336 |
582 |
722 |
651 |
|
Total assets |
3,091 |
2,817 |
3,656 |
3,592 |
3,952 |
3,611 |
3,670 |
3,934 |
3,522 |
3,859 |
|
Current liabilities |
421 |
550 |
529 |
881 |
772 |
858 |
925 |
1,114 |
823 |
1,034 |
|
Short-term borrowings |
25 |
25 |
25 |
25 |
25 |
|||||
|
Non-current liabilities |
25 |
24 |
1,224 |
1,224 |
1,384 |
1,287 |
1,231 |
1,209 |
1,051 |
826 |
|
Long-term debt |
1,200 |
1,200 |
1,340 |
1,240 |
1,200 |
1,100 |
900 |
700 |
||
|
Long-term borrowing |
600 |
600 |
600 |
600 |
600 |
600 |
600 |
600 |
||
|
Convertible bonds |
600 |
600 |
740 |
640 |
600 |
500 |
300 |
100 |
||
|
Total liabilities |
446 |
573 |
1,752 |
2,105 |
2,156 |
2,145 |
2,156 |
2,324 |
1,873 |
1,860 |
|
Total net assets |
2,644 |
2,244 |
1,904 |
1,487 |
1,796 |
1,466 |
1,514 |
1,610 |
1,648 |
1,999 |
|
Total shareholders’ equity |
2,644 |
2,244 |
1,904 |
1,487 |
1,796 |
1,466 |
1,514 |
1,610 |
1,648 |
1,999 |
|
Capital stock |
612 |
612 |
612 |
612 |
842 |
892 |
912 |
1,032 |
1,150 |
1,420 |
|
Legal capital reserve |
9,917 |
9,917 |
9,917 |
9,917 |
10,147 |
10,197 |
10,217 |
10,338 |
10,456 |
10,725 |
|
Retained earnings |
-7,908 |
-8,311 |
-8,653 |
-9,077 |
-9,322 |
-9,773 |
-9,748 |
-10,079 |
-10,393 |
-10,542 |
|
Stock acquisition right |
38 |
43 |
51 |
57 |
70 |
82 |
101 |
116 |
134 |
145 |
|
Total liabilities and net assets |
3,091 |
2,817 |
3,656 |
3,592 |
3,952 |
3,611 |
3,670 |
3,934 |
3,522 |
3,859 |
|
[Statements of cash flows] |
||||||||||
|
Cash flow from operating activities |
-604 |
-1,325 |
-104 |
-1,267 |
-857 |
|||||
|
Loss before income taxes |
-6,548 |
-7,314 |
-695 |
-999 |
-462 |
|||||
|
Cash flow from investing activities |
-106 |
-137 |
-5 |
-22 |
– |
|||||
|
Expenditure on acquisition of |
– |
– |
-3 |
-3 |
– |
|||||
|
Purchase of investment securities |
-100 |
-100 |
– |
– |
– |
|||||
|
Cash flow from financing activities |
40 |
1,221 |
579 |
718 |
370 |
|||||
|
Income from the issuance of convertible |
– |
599 |
599 |
599 |
– |
|||||
|
Income from issuance of shares by exercising |
40 |
40 |
– |
138 |
370 |
|||||
|
Income from issuance of stock acquisition rights |
– |
3 |
4 |
4 |
– |
|||||
|
Net increase in cash and cash equiv. |
-670 |
-240 |
468 |
-571 |
-486 |
|||||
|
Cash and cash equiv. at beginning of period |
2,009 |
2,009 |
2,032 |
2,032 |
1,461 |
|||||
|
Cash and cash equiv. at end of period |
1,602 |
2,032 |
2,501 |
1,461 |
974 |