2026-07-27
Home
Japanese

Omega Investment Co., Ltd.
Yukiguni Maitake

| Securities Code |
| TYO : 1375 |
| Market Capitalization |
| 65,214 million yen |
| Industry |
| Agriculture and Forestry |
The second largest mushroom manufacturing and sales company in Japan. Relisted in September 2020.
Conclusion
Since the IPO in September CY2020 the stock price has fallen and is trading at ca 30% below the initial public offering price of 2200 yen, in spite of a small pickup at the moment. Clearly, the IPO price was set too high. PBR remains high at around 7x book, but PER has settled down at just under 14 times. As per the real business, the biggest attraction should be the strong and predictable cash flow generation. Long-term investors such as Hikari Tsushin (TYO9435), who like the ability to generate cash flow, may well buy the shares eventually. In addition, the company’s return on capital is way above that of Hokuto (TYO1379) in the same mushroom industry, and some investors may consider switching into the shares of Yukiguni Maitake. Furthermore, the parent company Shinmei Holdings (unlisted and owns 50.0% stake), which intends to go public, could take over Yukiguni Maitake at some stage in future to make it private. It is felt that share price is approaching a stage where declines start to cease rather than not.
Business
The company is Japan’s second largest mushroom manufacturing and sales company with an estimated market share of 15%. The mainstay mushroom is Maitake, whose unit price is remarkably higher than those of other mushrooms. It is the only mushroom whose sales are growing unlike others. The company commands a top market share of 57% in the Maitake market, whilst selling Eringi, Bunashimeji and other mushrooms as well. The biggest mushroom company in Japan is HOKUTO (TYO1379), which has an estimated market share of 20%. Their mainstay is Bunashimeji. In 2013, accounting fraud was detected at Yukiguni Maitake, and the business was seriously disturbed. In June 2015, the company was delisted as a result of the TOB by Bain Capital, a US investment fund. Five years later, it was re-listed on September 17, 2020. The public offering price was 2200 yen and the initial price in the market was 2100 yen. Prior to the listing, Shinmei Holdings Co., Ltd., a major rice milling wholesaler, acquired a 49% stake in September 2017, bringing Bain Capital’s stake down to 51%. Back in long-time history the inception of Yukiguni Maitake’s business was the start of production and sales with the establishment of the company in 1983. As of now the Ohira family, who was the founder and the biggest shareholder, is non-existent in the business. Shinmei HD is a holding company headquartered in Kobe City, Hyogo Prefecture. It is a long-established wholesale rice milling company founded in 1902. (Table 4)
Business Segments (million yen)
| FY2020 | Revenue | % Mix | Op Income | % Op Margin | Assets | Capex |
|---|---|---|---|---|---|---|
| Mushroom | 33,995 | 98.4% | 7,766 | 22.8% | – | – |
| Others | 547 | 1.6% | 137 | 25.0% | – | – |
| (Adjustment) | 0 | -81 | ||||
| Total | 34,543 | 100.0% | 7,823 | 22.6% | 35,644 | 3,218 |
Japan Mushroom Sales (oku-yen, 100mn yen)
<FY2009~FY2014>
| CY | 2009 | 2010 | 2011 | 2012 | 2013 | 2014 |
|---|---|---|---|---|---|---|
| All Mushroom | 2,210 | 2,186 | 2,003 | 1,905 | 2,049 | 2,138 |
| Maitake | 278 | 326 | 292 | 276 | 296 | 339 |
| Buna Shimeji | 551 | 519 | 457 | 481 | 509 | 505 |
| Eringi | 229 | 229 | 192 | 166 | 202 | 201 |
| Enokitake | 343 | 328 | 326 | 330 | 325 | 340 |
| Nameko | 101 | 101 | 90 | 76 | 80 | 87 |
| Nama Shiitake | 704 | 674 | 624 | 575 | 633 | 663 |
| Matsutake | 2 | 7 | 3 | 1 | 3 | 4 |
<FY2015~FY2019>
| CY | 2015 | 2016 | 2017 | 2018 | 2019 | CAGR 10YR |
|---|---|---|---|---|---|---|
| All Mushroom | 2,147 | 2,181 | 2,160 | 2,265 | 2,238 | 0.1% |
| Maitake | 317 | 348 | 364 | 453 | 482 | 5.7% |
| Buna Shimeji | 511 | 490 | 491 | 518 | 514 | -0.7% |
| Eringi | 189 | 208 | 211 | 214 | 207 | -1.0% |
| Enokitake | 342 | 313 | 277 | 307 | 267 | -2.5% |
| Nameko | 97 | 105 | 107 | 106 | 104 | 0.3% |
| Nama Shiitake | 684 | 711 | 709 | 662 | 663 | -0.6% |
| Matsutake | 7 | 6 | 2 | 6 | 1 | -6.7% |
Investment view
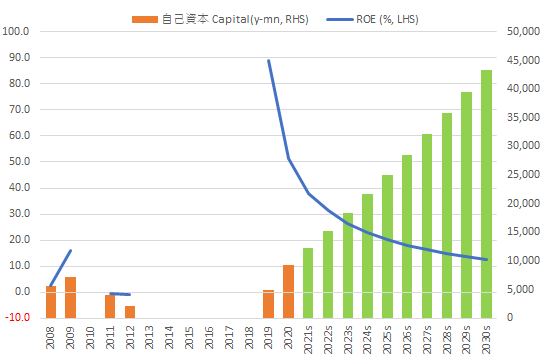
Current ROE is over 50% and ROIC is running at 15% in this fiscal year to March 2022. Perhaps, no investor thinks that this is sustainable. After five years of structural reforms under Bain Capital, the company must have re-listed in an extremely lean state, with all the inefficiencies removed. The 20% operating profit margin and the rich operating cash flow generation are quite impressive. The key to calculating the fair value of the shares is how well the return on capital will hold up in the long term. If the profitability of P/L is maintained in the future, equity will build up rapidly, financial leverage will drop sharply, and ROE should drop precipitously. Also, ROIC will go down. Ten years out, our long-term simulation indicates that ROE will decline to a little less than 13%, and then will converge to 10% over a longer period. Put more simply, the easy solution to this query is the net profit margin of 13.0% x asset turnover of 0.8 ≒ ROE of 10%, assuming no leverage and the sustained P/L profitability. The expected ROIC after ten years is 11.2%. Current share price implies PBR of 1.5 times and PER of 11.8 times ten years out. Some investors may already think the shares trade in the reasonable price range.
10 Year ROE Simulation
Dupont
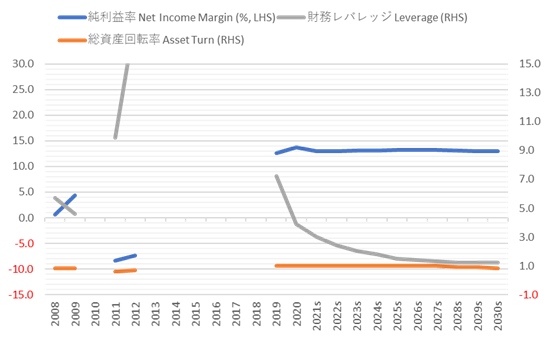
Balance sheet has yet to stablise and our assumption of sustained profit margins should be a little too unrealistic. In fact, the management states that they want to take expansive actions such as M&A and overseas business. Though none of them are clearly defined yet, it is safer to anticipate that somewhat return on capital will be traded for business scale-up. Various inefficiencies should emerge in the process of redeveloping the core business, which has once been made extremely lean. On the contrary, the rapid buildup of equity capital should encourage the management to consider borrowings and raise ROE, while at the same time lowering WACC. The timing is thought to be three years later when the equity ratio hits around 50%. WACC goes down as invested capital increases, and it will be possible to stop a large decline in economic profit *. In addition, if the company’s IR, which seems to be a little weak at present, is improved, it will also help lower WACC.
* Economic profit: ROIC spread (ROIC –WACC) x Invested capital
The company has few analyst coverage. It should be an interesting stock to look for nice buying opportunities for long-term investment by carefully monitoring how the business develops going forward.
Share price observation
Current share price is 30% below the IPO price. This is very poor performance being in the bottom quartile amongst all IPOs since the outset of CY2020. From January 2020 to the end of July 2021, 148 companies went public in the Japanese equities market. At present, the stock prices of 52 of these companies trade below the IPO prices, averaging decline of 19.9%. Dropping 30% vis-a-vis the IPO price, Yukiguni Maitake shares are the worst 19th out of 148 companies. The share price rebounded in early 2021 following the declaration of state of emergency on January 7, which made some investors expect that people would eat at home and that sales of mushrooms such as Maitake, which were at the top of the demand season, would increase. Currently, top management states that the demand was one-off and can no longer be expected.
Total Shareholder Return
| 1M | 3M | 6M | YTD | 1Y | IPO (Dec 2011) | |
|---|---|---|---|---|---|---|
| 1375 | -3.6 | -15.6 | -15.6 | -15.6 | -15.6 | -37.1 |
| TOPIX | 0.9 | 2.9 | 2.9 | 2.9 | 2.9 | 11.4 |
The shares of Hokuto, which runs a very similar business model to that of Yukiguni Maitake, trade at PBR of 1.1 times and PER of 19 times. Considering ROE of ca 5% to 6%, the shares look sensibly valued. The share price firmed last year on the expectations of special demand due to the spread of corona infection.
Price, Ratios
| 2018 | 2019 | 2020 | 2021 | |
|---|---|---|---|---|
| Price Change | – | – | – | -4.1 |
| vs TOPIX (%^) | – | – | – | -11.0 |
| Div Yield (%) | – | – | – | 2.6 |
| 3/2019 | 3/2020 | 3/2021 | 3/2022CE | |
| Sales (Y-mn、JGAAP) | 31,398 | 34,517 | 34,543 | 35,376 |
| Sales (IFRS) | 47,592 | 50,759 | 51,380 | 51,553 |
| EBITDA | 8,154 | 8,463 | 9,802 | – |
| EBIT | 6,491 | 6,691 | 7,823 | 7,434 |
| Net Inc | 4,389 | 4,345 | 4,743 | 4,581 |
| EPS (Dil) (Y) | 110.1 | 109.1 | 119.0 | 114.8 |
| Divs PS (Y) | – | – | 42.00 | 42.00 |
| Shs Out (Dil) | 40 | 40 | 40 | – |
| BPS | 58 | 123 | 231 | – |
| Cash&ST Inv (Y-mn) | 6,617 | 4,461 | 3,777 | – |
| Assets | 38,181 | 35,199 | 35,644 | – |
| Working Capital | 4,856 | 3,765 | 2,588 | – |
| LT Debt | 26,196 | 22,921 | 18,711 | – |
| Net OP CF | 7,994 | 4,891 | 8,204 | – |
| Capex | -2,416 | -2,379 | -3,731 | – |
| FCF | 5,702 | 2,535 | 4,478 | – |
| 3/2019 | 3/2020 | 3/2021 | 2/2021CE | |
| Gross Margin % | 42.8 | 54.2 | 46.9 | – |
| EBITDA Margin % | 26.0 | 24.5 | 28.4 | – |
| EBIT Margin % | 20.7 | 19.4 | 22.6 | 21.0 |
| Net Margin % | 14.0 | 10.2 | 13.7 | 12.9 |
| ROA % | – | 11.8 | 13.4 | – |
| ROE % | – | 120.5 | 67.1 | – |
| ROIC % | – | 15.7 | 19.3 | – |
| Asset Turnover | – | 1.2 | 1.0 | – |
| Assets/Equity | 16.5 | 7.2 | 3.9 | – |
| Current Ratio | 1.5 | 1.5 | 1.3 | – |
| Quick Ratio | 1.1 | 0.9 | 0.8 | – |
Before mentioning Bull / Bear, the company discloses the details of its mushroom business by sales value and production volume, whilst Hokuto does by in-house production volume. Therefore, the precise unit sales price is not known to each other. For this reason, the comparison of the mushroom businesses of both companies in this paper is no more than a rough estimate.
Bull
- The company is the top Maitake company with a 57% share (2019) in the Maitake market, which registers the fastest sales growth amongst all mushrooms. The overall mushroom market in Japan appears to have saturated in value, having grown just at a CAGR of + 0.1% over the past 10 years, while Maitake grew at a CAGR of + 6%. The company’s sales are half those of its competitor Hokuto (47%). However, the company focuses on high-priced Maitake mushrooms, while Hokuto’s main product is Bunashimeji, whose unit price is half that of Maitake. In FY03/2021, the company’s sales were divided into 58% for Maitake, 20% for Bunashimeji, 10% for Eringi, and 11% for other mushrooms. HOKUTO’s domestic mushroom sales are estimated to break into 25% Maitake, 42% Bunashimeji, 20% Eringi, and 13% for other mushrooms in the same fiscal year.
- Domestic market prices of mushrooms are found to be rather stable over a 10-year period, despite short-term fluctuation due to vegetable market price, which tends to move by climate, as well as the consumer preference. However, it should be noted that the price of Maitake, which is the company’s mainstay, has fallen rather significantly in recent years. Price premium may have detached to some extent for some reason. The 2019 spike in the Eringi price was due to the typhoon that damaged Hokuto’s production facilities and the consequent production squeeze.
- It is estimated that the combined market share of the company and Hokuto is a little less than 40% in the domestic mushroom markets. It is thought that if duopoly gradually increases backed by their competitiveness over marginal producers, the dynamics of the market should stabilise more accordingly.
- Outstandingly high operating margin and high return on capital. The management’s JGAAP-based OP margin estimate for the current fiscal year is 21%. Only 209 listed companies forecast operating profit margin above 20% this year, and in this regard the company ranks 184th in the Japanese equities market. Presumably, the background of the high operating profit margin is the high unit price of Maitake and the successful restructuring of the business under Bain Capital. B/S is very lean, and the secular ROE should be around 10% despite the outlook of further declines due to rapid accumulation of equity capital. If the management controls invested capital and business strategy well, secular ROE can be higher than 10%.
- Cash flow is rich and thought as predictable as price and volume growth are considered to fluctuate little in the long run, and because competition is not thought to intensify so much. Over the past three years, the management has spent 70% of the operating cash flow on capital investment, so cash flow recycling is rated well.
- If the company succeeds in overseas markets, profits could increase visibly. The management sets the overseas expansion of its own business model as one of the possible strategies. The global mushroom market is estimated to be about USD 452 million in 2019, and a lot of research suggests an annual growth rate of +7% to +8% in the 2020s, which will be driven by increasing health consciousness and the inclination for eating out. Currently, the company’s sales are all domestic. In the case of Hokuto, which operated the overseas mushroom business from earlier, the business grew from operating losses in the FY03/2016 to what earns an operating profit margin close to 12% in the FY03/2021. During the same period, the overseas sales grew at a CAGR of + 2.7%. (Table 2)
- TOB by parent company Shinmei HD is conceivable. In 2018, before the spread of corona disease, Mr. Mitsuo Fujio, president of Shinmei HD, said that he would like to list the shares a little earlier than 2025. Shinmei HD is aiming for group sales of 1 trillion yen in 2025 and is currently a shareholder of eight listed companies. Of these, Yukiguni Maitake (stake: 50.0%), Shokubun (TYO9969, 43.7%), and Genki Sushi (TYO9828, 40.5%) are included in the consolidated accounts. The reasons for Shinmei to want to fully acquire a listed subsidiary should be strengthening consolidated profits while gaining a free-hand on all the management decisions. (Table 4)
Bear
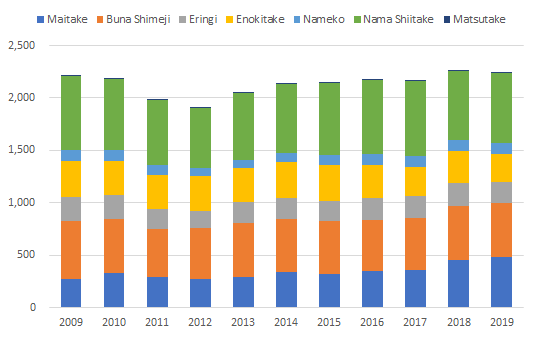
- Government’s industry statistics suggest that the secular growth of the domestic mushroom market has almost disappeared. The market temporarily shrank due to the vicious rumors at the time of the Great East Japan Earthquake but has been recovering since CY2013. However, there has been almost no growth in the past 10 years. Although the growth of Maitake, which is the mainstay of Yukiguni Maitake, is positive, the company also trades other mushrooms, and the overall secular top line sales growth is thought to be low. Investors looking for growth should find this uninspiring. (Graph 1)
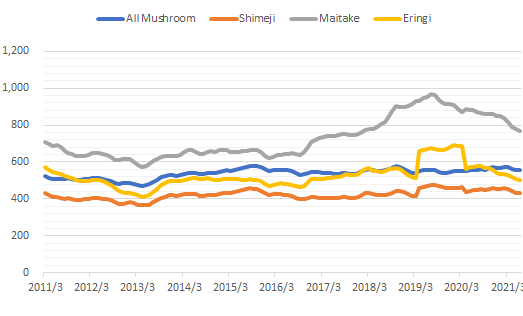
- The recent downward market price momentum of Maitake is strong. Market prices have fallen 13% in the last three years, and the declines since November 2020 have been sharp. In the meantime, the prices of Bunashimeji and Eringi are far less weak. Regarding the latest price decline of mushrooms, Mr. Iwao Ashikaga, President of Yukiguni Maitake, and Mr. Masayoshi Mizuno, President of Hokuto, raised the cool down in consumer appetite that fell on the demand season of fall and winter, and the sluggish vegetable prices due to good harvest under the warm climate. (Graph 2).
- From where the high operating margin comes is not necessarily clear and it is a big risk for investors. The company’s high return on capital is a direct reflection of high operating margin. The company’s operating margin surpasses that of Hokuto, and the management’s forecast for the current fiscal year is 21%. Possibly thorough structural reform led by Bain Capital, which made the company extremely lean, and the bias toward the high-priced Maitake provide some background, but the real structural factors are not detected from the company disclosure materials. As per Hokuto, its OP margin of domestic mushroom segment averaged a rather stable 11.1% for the last five years by FY03/2021.
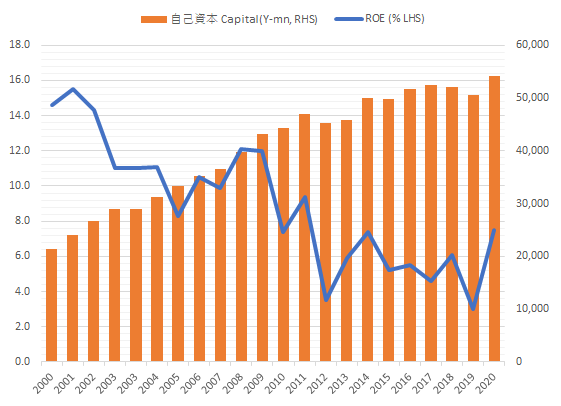
- Rapid capital buildup will cause a sharp drop in leverage, and ROE will continue to decline significantly. If ROE converges to around 10%, PBR should also decline significantly. If the asset turnover is raised significantly, it will have a positive multiplier effect on ROE. But in the case of Hokuto, which runs on a similar business structure such as manufacturing and distribution, asset turnover has almost stopped moving at 0.7x after a gradual decrease over a long period of time. It is not realistic to assume that the business structures of the two companies are significantly different, and it is anticipated that Yukiguni Maitake will follow the same trend. (Graph 3)
- ROIC is also expected to continue to fall, though not as much as ROE, as invested capital inflates. Lowering of ROIC will reduce economic profit. ROIC in simulations that do not assume debt increase is calculated to be 15.2% this fiscal year. It will go down to 11.2% in 10 years. ROIC spread will narrow from 9.1% to 1.2% and economic profits will decrease by 80%. In reality, this should be a fairly unrealistic worst-case scenario, as the management is expected to move to increase debt earlier to dilute dependency on equity capital.
- Clearly the IPO price was set unreasonably high due to overvaluation, and the subsequent fall of share price severely damaged the credibility of investors. The fact that the management leaves plenty of scope for the improvement of IR also fuels dissatisfaction of shareholders.
- The proportion of independent external director is 29% on the board of seven members, and it is difficult to reflect the opinions of minority shareholders. Shinmei HD holds a 50.01% stake, and Shinmei President Mr. Mitsuo Fujio sits as a director. The management can be easily influenced by the parent company, and there are natural limits to the monitoring by minority shareholders.
Graph1:Japan Mushroom Sales (oku-en, 100mn yen)
Graph2:Price of Mushroom – TTM (Y/kg)
Shareholder activities
Current shareholders consist of insiders 51.5 %, institutional investors 14.0% and the unknown remainder. The breakdown of the insiders is Shinmei HD (50.0%), Bain Capital Snow Hong Kong (1.3%), and Iwao Ashikaga, the current president (0.1%). Directors other than President Ashikaga do not hold shares. Besides these, Houtoku Inari Taisha owns 1.0%. It is a religious corporation of a Shinto shrine in Nagaoka City, Niigata Prefecture. The company explains that there is no relation with them.
Institutional investors are diverse including domestic and foreign. Somewhat surprising is that there are many value investors. The stake of value style investors is 7.6% and that of growth investors is 0.4%. The biggest institutional investor is Impax Asset Management Ltd in London. The company manages almost all the FUM of 3.5 trillion yen in equities.
The stake of foreign investors is 14.5% as of the end of March 2021 according to the Toyo Keizai Shikiho. Foreign investors have been net buyers in the last six months, and at least six new foreign institutions held the shares. As a result, 9 out of the top 15 institutional shareholders are foreign institutional investors. Impax Asset has continued to build positions since the IPO. A certain foreign investor disposed of some positions they bought at the IPO, albeit slightly.
In 2015, Bain Capital acquired all the shares in the TOB, and Yukiguni Maitake was closed to the public. The company was originally held 67.3% by the founding family, including the founder Yoshinobu Ohira, the former president, so any attempt of TOB was considered impossible. However, the banking group cooperated with the management team, which took over presidency from Mr.Ohira, and the US investment fund, and the takeover was made possible. Specifically, the founder had borrowings from multiple banks, including the Daishi Bank, the main bank, with his company’s stocks as collateral. The collateral value decreased as share price fell due to poor business performance, and loan repayment was delayed. The banking group exercised the security interest and acquired the shares of the founder, and then tendered those shares to the TOB by Bain Capital. In September 2017, rice wholesale giant Shinmei Holdings Co., Ltd. acquired a 49% stake, and Bain Capital’s stake became 51%.
Useful Stats of HOKUTO (1379)
Table 1: HOKUTO (1379) – Business Segments
| FY2020 | Revenue | % Mix | OP Income | % OP Margin | Assets | Capex |
|---|---|---|---|---|---|---|
| Mushroom – Japan | 50,538 | 68.4% | 6,939 | 13.7% | 73,658 | 2,713 |
| Mushroom – Overseas | 5,074 | 6.9% | 589 | 11.6% | 10,612 | 63 |
| Processed Food | 8,274 | 11.2% | 539 | 6.5% | 5,748 | 299 |
| Chemicals (Wrapping Sheet) | 10,001 | 13.5% | -102 | -1.0% | 8,310 | 372 |
| (Adjustment) | -1,952 | 1,907 | 1 | |||
| Total | 73,889 | 100.0% | 7,964 | 10.8% | 100,237 | 3,451 |
Graph 3 : HOKUTO (1379) – ROE, Capital
Graph 4:HOKUTO (1379) – Dupont
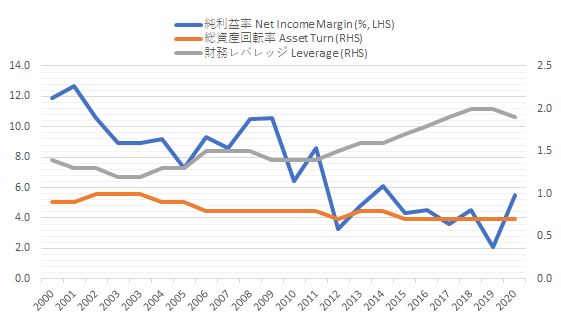
Table 2:HOKUTO (1379) – Overseas Mushroom Segment
| (Y-mn) | 3/2016 | 3/2017 | 3/2018 | 3/2019 | 3/2020 | 3/2021 |
|---|---|---|---|---|---|---|
| Sales | 4,451 | 4,515 | 4,790 | 5,092 | 5,301 | 5,074 |
| Operating Profit | -142 | 178 | 119 | 371 | 603 | 589 |
| OP Margin % | -3.2% | 3.9% | 2.5% | 7.3% | 11.4% | 11.6% |
Table 3:HOKUTO (1379) – Price, Ratios
| 2015 | 2016 | 2017 | 2018 | 2019 | 2020 | 2021 | 5Yr Avg(%) | |
|---|---|---|---|---|---|---|---|---|
| Price Change | 16.4 | -9.5 | -2.8 | -6.1 | 2.7 | 5.5 | -8.4 | -2.0 |
| vs TOPIX (%^) | 6.5 | 5.9 | -39.5 | -27.9 | 0.3 | 43.6 | -15.3 | -6.0 |
| Div Yield (%) | – | 2.8 | 2.9 | – | – | – | 3.1 | 2.9 |
| 3/2016 | 3/2017 | 3/2018 | 3/2019 | 3/2020 | 3/2021 | 5Yr CAGR (%) | ||
| Sales (Y-mn) | 60,938 | 63,119 | 66,907 | 70,183 | 71,220 | 73,889 | 3.9 | |
| EBITDA | 8,902 | 9,751 | 9,980 | 10,781 | 11,133 | 12,989 | 7.8 | |
| EBIT | 3,428 | 3,431 | 3,183 | 3,504 | 3,924 | 6,013 | 11.9 | |
| Net Inc | 2,598 | 2,828 | 2,418 | 3,188 | 1,531 | 4,038 | 9.2 | |
| EPS (Dil) (Y) | 81.1 | 88.1 | 75.2 | 90.5 | 42.2 | 111.9 | 6.6 | |
| Divs PS (Y) | 60.00 | 60.00 | 60.00 | 60.00 | 60.00 | 60.00 | 0.0 | |
| Shs Out (Dil) | 32 | 32 | 32 | 35 | 36 | 36 | 2.4 | |
| BPS | 1,557 | 1,611 | 1,631 | 1,642 | 1,617 | 1,720 | 2.0 | |
| Cash&ST Inv (Y-mn) | 5,212 | 6,047 | 8,508 | 9,055 | 12,178 | 13,891 | 21.7 | |
| Assets | 83,476 | 94,738 | 100,556 | 103,606 | 100,602 | 100,237 | 3.7 | |
| LT Debt | 5,060 | 12,538 | 11,703 | 25,477 | 26,662 | 21,461 | 33.5 | |
| Net OP CF | 8,744 | 8,000 | 9,938 | 9,572 | 10,778 | 10,471 | 3.7 | |
| Capex | -9,357 | -14,869 | -7,865 | -10,297 | -2,726 | -3,995 | – | |
| -FCF | -613 | -6,869 | 2,073 | -725 | 8,052 | 6,476 | – | |
| 3/2016 | 3/2017 | 3/2018 | 3/2019 | 3/2020 | 3/2021 | 5Yr Avg (%) | ||
| Gross Margin % | 27.4 | 27.8 | 27.1 | 27.1 | 28.0 | 29.6 | 27.9 | |
| EBITDA Margin % | 14.6 | 15.4 | 14.9 | 15.4 | 15.6 | 17.6 | 15.8 | |
| EBIT Margin % | 5.6 | 5.4 | 4.8 | 5.0 | 5.5 | 8.1 | 5.8 | |
| Net Margin % | 4.3 | 4.5 | 3.6 | 4.5 | 2.1 | 5.5 | 4.1 | |
| ROA % | 3.1 | 3.2 | 2.5 | 3.1 | 1.5 | 4.0 | 2.9 | |
| ROE % | 5.2 | 5.6 | 4.6 | 6.1 | 3.0 | 7.7 | 5.4 | |
| ROIC % | 2.4 | 2.5 | 2.0 | 2.6 | 3.0 | 4.4 | 2.9 | |
| Asset Turnover | 0.7 | 0.7 | 0.7 | 0.7 | 0.7 | 0.7 | 0.7 | |
| Assets/Equity | 1.7 | 1.8 | 1.9 | 2.0 | 2.0 | 1.9 | 1.9 | |
| Current Ratio | 0.6 | 0.6 | 0.6 | 0.9 | 1.1 | 1.2 | 0.9 | |
| Quick Ratio | 0.4 | 0.4 | 0.5 | 0.6 | 0.8 | 0.9 | 0.7 |
Useful Stats of Shinmei Holdings (not listed)
Table 4:Shinmei HD – Price, Ratios
| (Consolidated) | 3/2016 | 3/2017 | 3/2018 | 3/2019 | 3/2020 |
|---|---|---|---|---|---|
| Sales (Y-mn) | 160,010 | 182,474 | 246,600 | 264,155 | 256,239 |
| COGS | 132,763 | 148,910 | 206,210 | 221,396 | 212,375 |
| Gross Profit | 27,247 | 33,563 | 40,390 | 42,759 | 43,863 |
| SGAE | 22,864 | 28,543 | 37,308 | 40,051 | 42,343 |
| OP | 4,382 | 5,020 | 3,081 | 2,708 | 1,520 |
| Non-OP Inc | 352 | 409 | 1,549 | 4,831 | 3,146 |
| Non-OP Exp | 403 | 401 | 1,028 | 662 | 1,231 |
| RP | 4,331 | 5,028 | 3,602 | 6,877 | 3,435 |
| Extraordinary profit | 2,915 | 116 | 619 | 780 | 9,809 |
| Extraordinary loss | 186 | 339 | 1,127 | 1,754 | 1,318 |
| Pretax Inc | 7,059 | 4,805 | 3,094 | 5,903 | 11,926 |
| Tax | 1,704 | 2,158 | 1,496 | 978 | 5,775 |
| Net Inc | 5,355 | 2,647 | 1,597 | 4,924 | 6,151 |
| Minority Inc | 3,891 | 264 | 231 | 1,094 | 12 |
| Net Inc | 4,974 | 2,382 | 1,366 | 3,828 | 6,138 |
| 3/2016 | 3/2017 | 3/2018 | 3/2019 | 3/2020 | |
| Current Asset | 28,262 | 34,745 | 43,658 | 46,368 | 55,094 |
| LT Asset | 39,876 | 48,787 | 101,133 | 107,050 | 104,236 |
| Tangibles | 23,877 | 27,246 | 26,799 | 29,043 | 33,719 |
| Intangibles | 7,056 | 8,518 | 9,950 | 9,711 | 33,196 |
| Investment, Others | 8,943 | 13,022 | 64,383 | 68,295 | 37,323 |
| Total Asset | 68,138 | 83,532 | 144,791 | 153,418 | 159,333 |
| Current Debt | 19,563 | 27,737 | 51,950 | 46,197 | 49,962 |
| LT Debt | 18,692 | 23,537 | 59,563 | 70,258 | 65,312 |
| Total Debt | 38,255 | 51,275 | 111,513 | 116,455 | 115,275 |
| Shareholder Fund | 25,511 | 27,062 | 27,227 | 29,832 | 33,225 |
| Other Profit | 495 | 1,216 | 1,613 | 1,059 | 3,023 |
| Minority | 3,575 | 3,978 | 4,437 | 6,070 | 7,809 |
| Total Capital | 29,833 | 32,257 | 33,277 | 36,962 | 44,058 |
| 3/2016 | 3/2017 | 3/2018 | 3/2019 | 3/2021 | |
| Gross Margin % | 17.0 | 18.4 | 16.4 | 16.2 | 17.1 |
| EBITDA Margin % | – | – | – | – | – |
| EBIT Margin % | 2.7 | 2.8 | 1.2 | 1.0 | 0.6 |
| Net Margin % | 3.3 | 1.5 | 0.6 | 1.9 | 2.4 |
| ROA % | 7.3 | 2.9 | 0.9 | 2.5 | 3.9 |
| ROE % | 16.7 | 7.4 | 4.1 | 10.4 | 13.9 |
| ROIC % | – | – | – | – | – |
| Asset Turnover | 0.4 | 0.5 | 0.6 | 0.6 | 0.6 |
| Assets/Equity | 2.3 | 2.6 | 4.4 | 4.2 | 3.6 |
| Current Ratio | 1.4 | 1.3 | 0.8 | 1.0 | 1.1 |
| Quick Ratio | – | – | – | – | – |
*Liquid Assets / Current Liabilities = Quick Ratio
Made by Omega Investment by various materials