2026-07-27
Home
Japanese

Omega Investment Co., Ltd.
World Holdings (Price Discovery)
| Securities Code |
| TYO:2429 |
| Market Capitalization |
| 42,759 million yen |
| Industry |
| Service |
Profile
The company runs human resource services, real estate and telecommunications. Under HR services, it operates temp staff placement and training services for manufacturers, logistic companies, the tech industry and the medical industry. The Real Estate Business segment sells houses and residential lands and operates real estate brokerage, management, and consulting services.
Stock Hunter’s View
Continued growth in outsourced contracting and temporary staffing. To play an active role on the Silicon Island Kyushu.
The opening of a plant by Taiwanese semiconductor giant TSMC has triggered a wave of semiconductor-related investment in Kyushu island. With TSMC’s Kumamoto plant due to start operations in two years, the Sony Group, Kyocera, Rohm and others are also making capital investments in response. Local small and medium-sized enterprises have also started to strengthen their businesses. The Kyushu Bureau of Economy, Trade and Industry has targeted doubling the value of semiconductor-related shipments by 2030 to ¥3 trillion.
Moves to train and secure semiconductor personnel are also gaining momentum to revive ‘Silicon Island Kyushu’. World HDS, which operates a human resources education business (outsourced contracting and temporary staffing) in Kyushu, is also likely to benefit. The human resources education business is divided into the ‘manufacturing’ and ‘service’ sectors, with the former attracting many enquiries from the semiconductor and electronic components industries.
In the most recently announced results for the 3Q FY12/2022 (1 January to 30 September), the human resources education business led the overall increase, with sales up 30% and operating profit up 60%. With many human resources education and real estate projects in the 4Q, the company should meet its full-year forecasts of ¥180bn in sales (+16.4% YoY) and operating profit of ¥8.4bn (+12.3% YoY) with ease. The company is expected to be able to handle the increase in recruitment costs and sustain growth in the current financial year. The current share price adjustment phase is a good entry opportunity.
Investor’s View
Trading Buy
The company’s profits have been growing since bottoming out in FY2019. NTM ROE forecast is 14%, and the dividend yield is 3.3%. With a market capitalisation of ¥43 billion, it is a not-too-small human resources services stock, but why is it valued at a low PER of 9x and 1.3x the book? To answer this query is to answer on the investment decision of the shares.
Valuations will not easily expand
Firstly, although the company is classified as a service provider, it is, in reality, a semi-real estate company. Currently, 70% of profits come from human resources and 30% from real estate. In the past, when real estate revenues were in a strong stage, 50% of the profit was earned from real estate. Real estate shares fell markedly with the rise in market interest rates towards the end of CY2022 and on 20 December, when the BOJ effectively allowed interest rates to rise. In 2018 the share price fell by 40%, discounting the expected earnings plunge due to a sharp fall in property profits in the following year. Since then, the company’s shares have been valued at a low PBR, typical of real estate stocks. At the end of 3Q, 40% of total assets, or ¥47 billion, were properties for sale and in progress, the value of which cannot be estimated by investors. The share price premium is unlikely to expand due to concerns over rising domestic interest rates.
Dupont Model
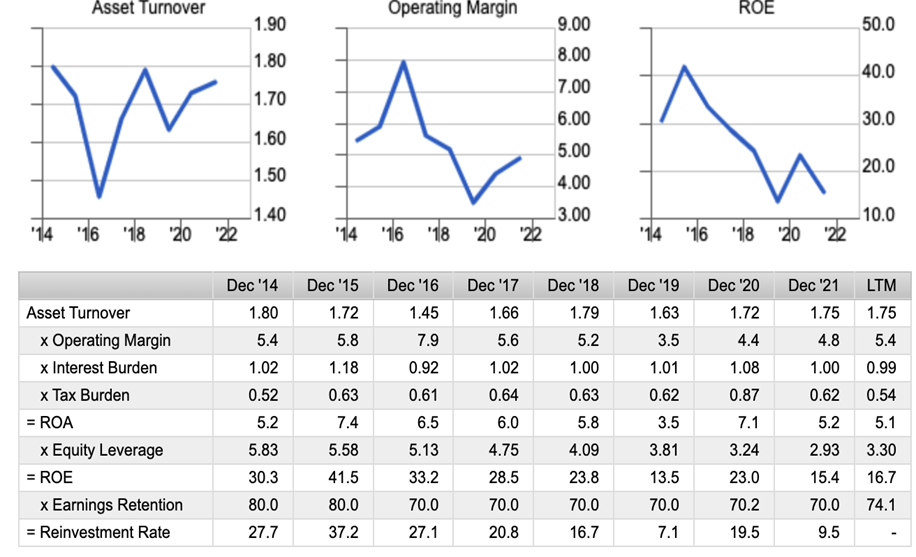
Profit margins are stable in the HR business and cyclical in the real estate business
Secondly, there needs to be more potential for sustained growth in ROE. Relatively high ROE is due to high leverage from real estate business financing. ROA of 5.5% on average over five years could be more attractive. The human resources business is showing solid sales growth and could benefit from the increasing Silicon Islandisation of Kyushu, as noted by the Stock Hunter. However, operating margins appear to be saturated at around 7%. If the real estate business booms, a higher ROA will raise ROE. Still, investors who view the real estate business as cyclical in terms of profitability should do without upgrading the fair value of the shares on a long-term basis.
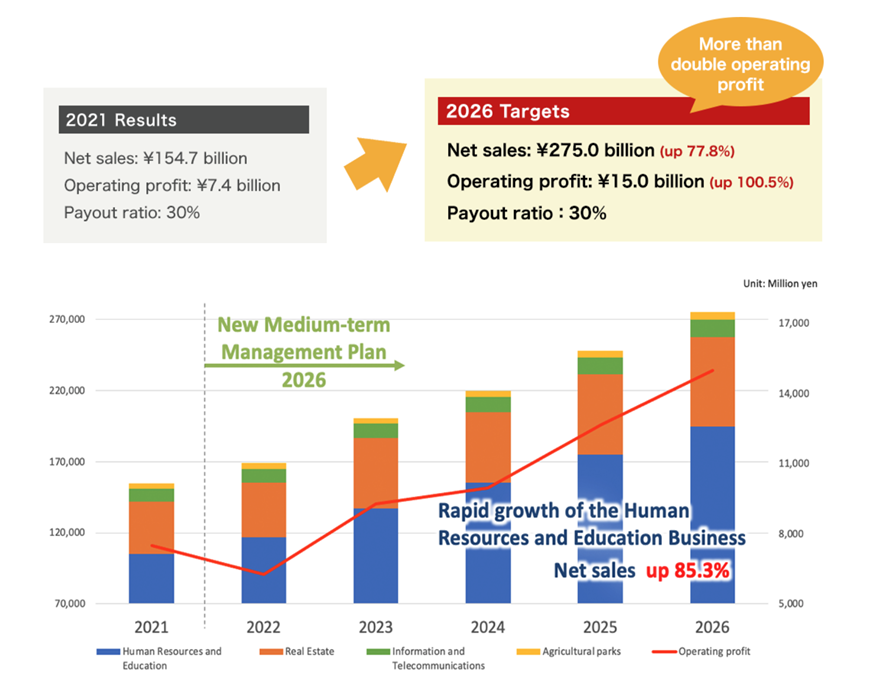
Any PER drivers?
The management targets to double its operating profit in five years to ¥15 billion in FY2026. PER, which is only 9x now, would expand if profit is to grow at a CAGR of 15%. They explain that the growth driver is human resource services, but so far, no convincing explanation has been given. The revival of manufacturing in Kyushu is highly likely and has an excellent thematic interest, which could move share price. However, we should be cautious about how much benefit it will bring to the company in a highly competitive market, even though Kyushu is its home turf.
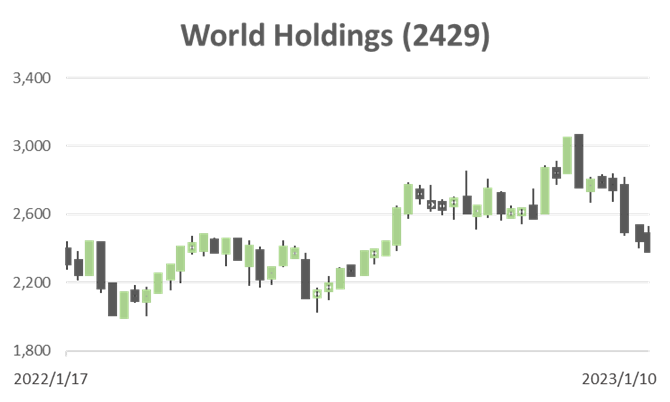
Nevertheless, the shares look interesting in the near term
The technical indicators are reassuring for long investors, as the share price has fallen so much in the short term. It is also thought that the current stock market may have entered a bear market rally after a move to test the bottom in October last year. Volatility is likely to be high for the time being, with alternating stock investors’ concerns and relief about domestic interest rates moving the share price. It may therefore be possible to take money on any improvement in sentiment. Hence, an appropriate grading for the shares would be a Trading Buy.
Sales, OP, OP Margins
Sales (million yen)
| DEC ’12 | DEC ’13 | DEC ’14 | DEC ’15 | DEC ’16 | DEC ’17 | DEC ’18 | DEC ’19 | DEC ’20 | DEC ’21 | |
| Total | 53,005 | 56,448 | 68,826 | 87,982 | 94,331 | 127,142 | 142,890 | 136,316 | 143,568 | 154,702 |
| HR Services | 27,074 | 28,855 | 40,099 | 45,184 | 51,632 | 66,039 | 75,036 | 77,772 | 83,140 | 104,486 |
| Factory | 17,893 | 18,738 | 24,928 | 26,910 | 30,111 | 41,654 | 49,524 | 50,001 | 55,102 | 70,707 |
| Technology | 6,197 | 6,424 | 8,430 | 9,547 | 10,334 | 12,155 | 15,200 | 16,902 | 17,003 | 18,474 |
| Research & Development | 2,984 | 3,693 | 4,062 | 4,755 | 5,533 | 6,489 | 6,779 | 7,108 | 7,200 | 8,012 |
| Sales & Marketing | – | – | 2,679 | 3,972 | 5,654 | 5,741 | 3,533 | 3,761 | 3,835 | 7,293 |
| Real Estate | 8,794 | 8,683 | 15,545 | 31,785 | 34,481 | 49,080 | 52,011 | 42,082 | 48,081 | 36,977 |
| Information & Communication | 11,658 | 13,092 | 12,608 | 10,522 | 7,742 | 9,167 | 12,376 | 12,344 | 9,133 | 9,367 |
| Other | 5,479 | 5,818 | 574 | 491 | 476 | 2,856 | 3,467 | 4,118 | 3,214 | 3,872 |
Operating Income (million yen)
| DEC ’12 | DEC ’13 | DEC ’14 | DEC ’15 | DEC ’16 | DEC ’17 | DEC ’18 | DEC ’19 | DEC ’20 | DEC ’21 | |
| Total | 2,195 | 3,081 | 4,907 | 6,606 | 9,394 | 9,091 | 9,287 | 6,780 | 9,102 | 10,202 |
| HR Services | 1,114 | 1,848 | 2,848 | 3,526 | 3,962 | 4,703 | 4,965 | 5,178 | 5,512 | 7,101 |
| Factory | 489 | 1,083 | 1,918 | 1,801 | 2,080 | 2,587 | 3,169 | 2,679 | 2,632 | 3,631 |
| Technology | 356 | 571 | 699 | 989 | 1,015 | 1,263 | 1,337 | 1,761 | 2,019 | 2,233 |
| Research & Development | 269 | 194 | 159 | 518 | 571 | 634 | 559 | 711 | 843 | 885 |
| Sales & Marketing | 72 | 218 | 296 | 219 | -100 | 27 | 18 | 352 | ||
| Real Estate | 462 | 511 | 1,869 | 3,061 | 5,171 | 4,635 | 4,589 | 1,460 | 3,550 | 2,977 |
| Information & Communication | 408 | 441 | 172 | 4 | 244 | 25 | 3 | 10 | 240 | 118 |
| Other | 211 | 281 | 18 | 15 | 17 | -272 | -270 | 132 | -200 | 6 |
OP – Percent of Total (%)
| DEC ’12 | DEC ’13 | DEC ’14 | DEC ’15 | DEC ’16 | DEC ’17 | DEC ’18 | DEC ’19 | DEC ’20 | DEC ’21 | |
| Total | 100 | 100 | 100 | 100 | 100 | 100 | 100 | 100 | 100 | 100 |
| HR Services | 51 | 60 | 58 | 53 | 42 | 52 | 53 | 76 | 61 | 70 |
| Factory | 22 | 35 | 39 | 27 | 22 | 28 | 34 | 40 | 29 | 36 |
| Technology | 16 | 19 | 14 | 15 | 11 | 14 | 14 | 26 | 22 | 22 |
| Research & Development | 12 | 6 | 3 | 8 | 6 | 7 | 6 | 10 | 9 | 9 |
| Sales & Marketing | 1 | 3 | 3 | 2 | -1 | 0 | 0 | 3 | ||
| Real Estate | 21 | 17 | 38 | 46 | 55 | 51 | 49 | 22 | 39 | 29 |
| Information & Communication | 19 | 14 | 4 | 0 | 3 | 0 | 0 | 0 | 3 | 1 |
| Other | 10 | 9 | 0 | 0 | 0 | -3 | -3 | 2 | -2 | 0 |
OP Growth (%)
| DEC ’12 | DEC ’13 | DEC ’14 | DEC ’15 | DEC ’16 | DEC ’17 | DEC ’18 | DEC ’19 | DEC ’20 | DEC ’21 | |
| Total | 50 | 40 | 59 | 35 | 42 | -3 | 2 | -27 | 34 | 12 |
| HR Services | 66 | 54 | 24 | 12 | 19 | 6 | 4 | 6 | 29 | |
| Factory | -18 | 121 | 77 | -6 | 15 | 24 | 22 | -15 | -2 | 38 |
| Technology | 9 | 60 | 22 | 41 | 3 | 24 | 6 | 32 | 15 | 11 |
| Research & Development | 12 | -28 | -18 | 226 | 10 | 11 | -12 | 27 | 19 | 5 |
| Sales & Marketing | 203 | 36 | -26 | -146 | -33 | 1856 | ||||
| Real Estate | 11 | 266 | 64 | 69 | -10 | -1 | -68 | 143 | -16 | |
| Information & Communication | 92 | 8 | -61 | -98 | 6000 | -90 | -88 | 233 | 2300 | -51 |
| Other | 34 | 33 | -94 | -17 | 13 | -1700 | 1 | -252 | – |
OP Margin (%)
| DEC ’12 | DEC ’13 | DEC ’14 | DEC ’15 | DEC ’16 | DEC ’17 | DEC ’18 | DEC ’19 | DEC ’20 | DEC ’21 | |
| Total | 4.1 | 5.5 | 7.1 | 7.5 | 10.0 | 7.2 | 6.5 | 5.0 | 6.3 | 6.6 |
| HR Services | 4.1 | 6.4 | 7.1 | 7.8 | 7.7 | 7.1 | 6.6 | 6.7 | 6.6 | 6.8 |
| Factory | 2.7 | 5.8 | 7.7 | 6.7 | 6.9 | 6.2 | 6.4 | 5.4 | 4.8 | 5.1 |
| Technology | 5.7 | 8.9 | 8.3 | 10.4 | 9.8 | 10.4 | 8.8 | 10.4 | 11.9 | 12.1 |
| Research & Development | 9.0 | 5.3 | 3.9 | 10.9 | 10.3 | 9.8 | 8.2 | 10.0 | 11.7 | 11.0 |
| Sales & Marketing | – | – | 2.7 | 5.5 | 5.2 | 3.8 | -2.8 | 0.7 | 0.5 | 4.8 |
| Real Estate | 5.3 | 5.9 | 12.0 | 9.6 | 15.0 | 9.4 | 8.8 | 3.5 | 7.4 | 8.1 |
| Information & Communication | 3.5 | 3.4 | 1.4 | 0.0 | 3.2 | 0.3 | 0.0 | 0.1 | 2.6 | 1.3 |
| Other | 3.9 | 4.8 | 3.1 | 3.1 | 3.6 | -9.5 | -7.8 | 3.2 | -6.2 | 0.2 |
(Source) Omega Investment