2026-07-15
Home
Japanese

Omega Investment Co., Ltd.
Kidswell Bio (Company note – 4Q update)

| Share price (5/18) | ¥229 | Dividend Yield (24/3 CE) | – % |
| 52weeks high/low | ¥388/200 | ROE(23/3) | -51.4 % |
| Avg Vol (3 month) | 112.8 thou shrs | Operating margin (23/3) | -19.8 % |
| Market Cap | ¥7.3 bn | Beta (5Y Monthly) | 1.12 |
| Enterprise Value | ¥8.2 bn | Shares Outstanding | 32.059 mn shrs |
| PER (24/3 CE) | – X | Listed market | TSE Growth |
| PBR (23/3 act) | 7.08 X |
| Click here for the PDF version of this page |
| PDF Version |
In FY2023/3, sales of GBS-007 were strong, increasing by about 80%. In FY2024/3, the company forecasts sales of 3.5 billion yen.
◇Summary of FY2023/3 results
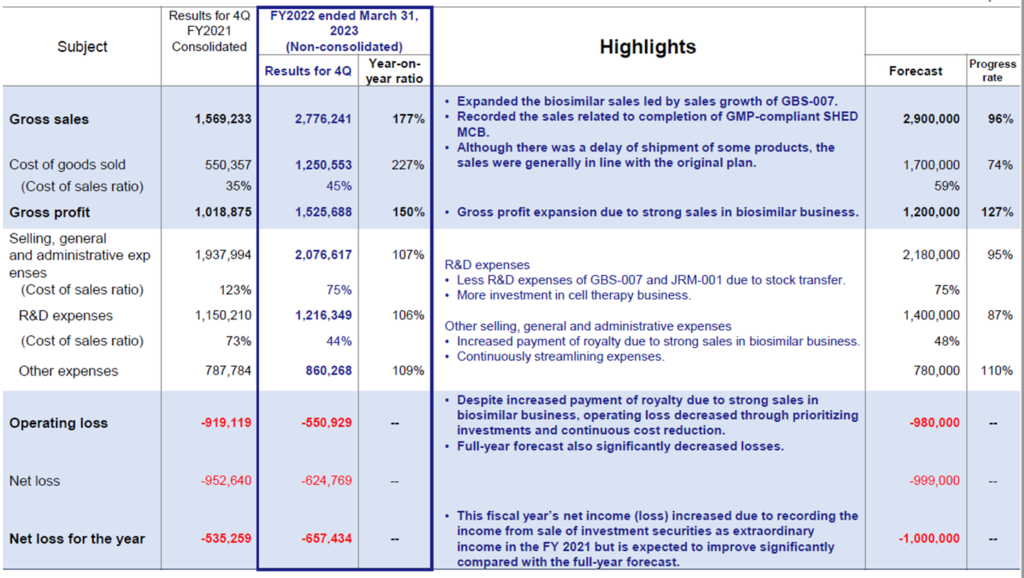
Kidwell Bio’s full-year results for FY2023/3 recorded a 76.9% increase in sales YoY, to 2.77 billion yen, thanks to solid biosimilar (BS) GBS-007 sales. In addition to strong BS sales, the operating loss was much smaller than initially forecast due to the curbing of SG&A expenses, including a reduction in research and development costs.
Following the completion of the MCB (Master Cell Bank) for SHED (Stem cells from Human Exfoliated Deciduous teeth) in October 2022, many collaborative studies with academia are progressing toward practical implementation, so the SHED pipeline is steadily progressing. The company also plans to invest aggressively in second-generation SHED to develop them overseas.
For FY2024/3, sales are forecast to increase by 26.1% to 3.5 billion yen, with an operating loss of 1.5 billion yen and a net loss of 1.55 billion yen. The company expects BS sales to continue to expand, with sales expected to reach 3 billion yen ahead of schedule to achieve it in FY2026/3 in the medium-term strategic plan (KWB2.0). On the other hand, losses are expected to increase due to continued investment in development, particularly in SHED.
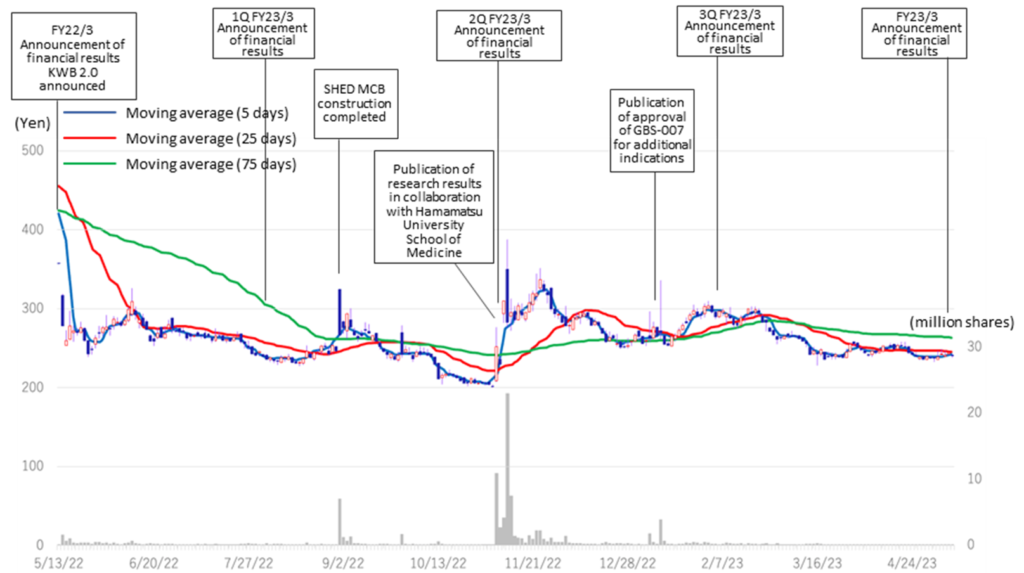
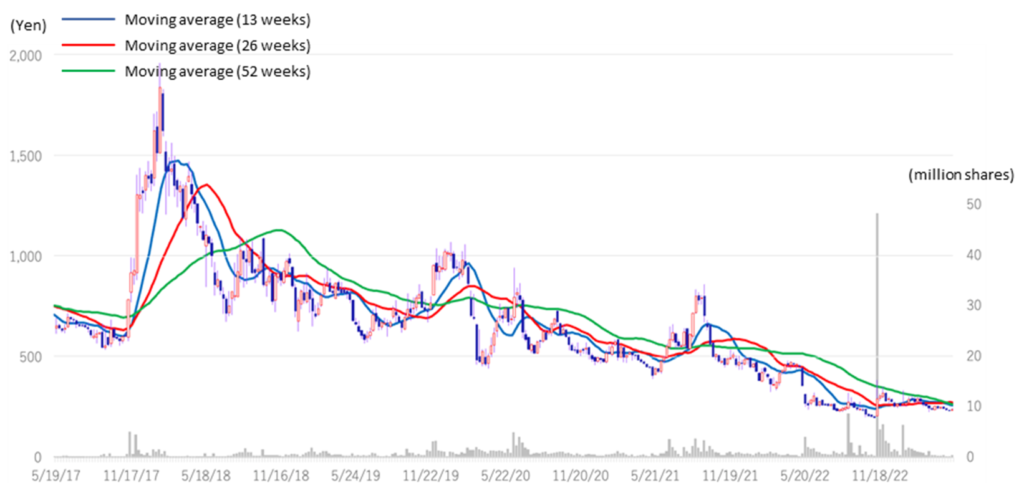
◇Stock price
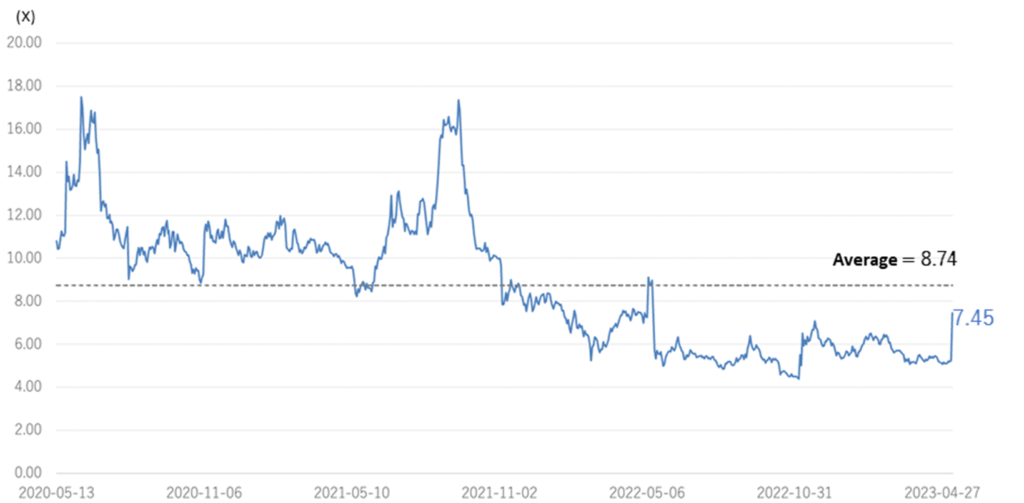
The company’s share price has adjusted since May 2022, ranging between 200 and 300 yen. Currently, PBR is 7.45x, below the three-year average (LTM) of 8.74x. In its medium-term strategic plan (KWB 2.0), the company plans to achieve operating profitability in FY2025 by revenue from its BS business. At the same time, the company has stated its intention to accelerate business development with an eye on the global market by continuing investment in SHED. As mentioned above, the company is on track to achieve the sales targets set out in KWB2.0 two years ahead of schedule in FY2024/3, while some of its first-generation SHED has entered the clinical preparation stage. Further concrete progress is expected in the current fiscal year, and we are interested to see if the share price will be revalued.
◇Full-year results for FY2023/3: significant growth in sales of BS GBS-007.
The company’s full-year results for FY2023/3 showed sales of 2,776 million yen, up 76.9% YoY, an operating loss of 550 million yen, and a net loss of 657 million yen.
Regarding sales, the BS business performed well, including GBS-007 (ranibizumab), the third BS product launched in December 2021. Sales fell slightly short of the full-year forecast (2.9 billion yen) due to timing delays in shipments of some products but were broadly in line with plans. In 2Q, sales associated with the completion of MCB and milestone revenue from the fourth BS product were recorded.
| JPY, mn, % | Net sales |
YoY % |
Oper. profit |
YoY % |
Ord. profit |
YoY % |
Profit ATOP |
YoY % |
EPS (¥) |
| 2019/3 | 1,021 | -3.6 | -805 | – | -816 | – | -856 | – | -43.84 |
| 2020/3 | 1,077 | – | -1,161 | – | -1,187 | – | -7,316 | – | -264.65 |
| 2021/3 | 996 | -7.5 | -969 | – | -991 | – | -1,001 | – | -34.79 |
| 2022/3 | 1,569 | 62.3 | -651 | – | -968 | – | -535 | – | -17.86 |
| 2023/3* | 2,776 | 76.9 | -550 | – | -624 | – | -657 | – | -20.77 |
| 2024/3 (CE) | 3,500 | 26.1 | -1,500 | – | -1,550 | – | -1,550 | – | -48.97 |
* FY2020/3 to FY2021/3 are consolidated results. FY2022/3 and onwards are on a non-consolidated basis. Therefore, figures for the same period of the previous year and YoY comparisons are not given.
Results for FY2023/3 (PL)
Source: Company materials
As per profit, however, gross profit increased due to higher sales of the BS business. Although R&D expenditure in the cell therapy business continued, the launch of GBS-007 and the transfer of JRM-001 have halted the growth of R&D expenses. Other SG&A expenses are also under control, and overall SG&A expenses to sales fell significantly from 123.5% in FY2022/3 to 74.8% in FY2023/3. As a result, the operating loss came in at 550 million yen, a significant improvement from the previous year.
As previously reported, a bank loan of 1 billion yen was taken out at the end of June 2022 to secure working capital for the increased sales of GBS-007. Interest paid (32 million yen) and commission paid (31 million yen) were recorded as non-operating expenses, resulting in an ordinary loss of 624 million yen.
In the BS (balance sheet), cash and deposits at the end of the year amounted to 1,067 million yen due to the above-mentioned bank borrowings and the issue of the 4th unsecured convertible bond with stock acquisition rights. On the other hand, the corresponding non-current liabilities increased to 1,605 million yen. As a result, total assets at the end of March 2023 amounted to 3,894 million yen, rising by 424 million yen from the end of FY2022/3.
Cell therapy business (regenerative medicine): SHED MCB completed, and R&D structure to be strengthened.
*Establishment of an R&D structure aiming to maximise the value of SHED: Established a new Tokyo Laboratory.
The company has been accelerating the development of SHED following the completion of the MCB and has announced the strengthening of its research structure, intending to maximise the value of SHED. The Tokyo Laboratory was established to accelerate research on second-generation SHED and to create new modalities and technologies using SHED as a raw material. It aims to advance new science exploration by utilising the latest technologies and further developing external joint research and other activities. On the other hand, the existing Sapporo Laboratory will continue to carry out basic and developmental research (including studies of manufacturing methods) on SHED as in the past. The two laboratories in Sapporo and East Tokyo aim to accelerate further research and development for the practical application of SHED in Japan and the USA.
*Cell therapy business pipeline: some have progressed to the pre-clinical stage
See the diagram above on the next page for the company’s cell therapy business pipeline status.
Collaboration with Nagoya University and other academia is making progress in first-generation SHED. After filing a patent application, the company’s joint research with Nagoya University on the treatment of cerebral palsy was approved by the university’s Specially Certified Committee for Regenerative Medicine and has progressed to the point just before the start of clinical trials. In addition, three other projects have advanced to the pre-clinical stage.
In addition, the development of second-generation SHED remains an important issue, although they are still in the research and exploratory stage. Second-generation SHED is positioned as a key to the company’s overseas expansion, and the company intends to focus more on it going forward.
Pipeline Highlights: Cell therapy business (Regenerative medicine)
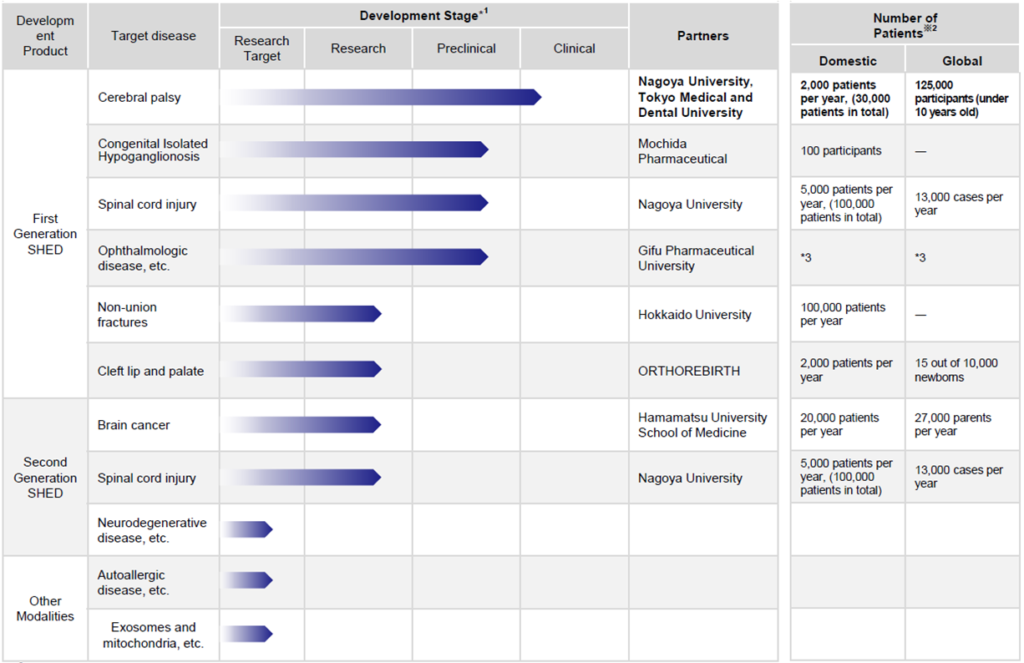
※2: Prepared by the company based on Global Data, Global Cancer Observatory, etc. ※3: Details not disclosed.
Source: Company materials
Recent topics related to SHED
| Month/Year | Topics |
| May 2023 | Presentation at the 26th American Society for Gene and Cell Therapy (ASGCT) on basic research results on SHED. |
| Feb 2023 | The clinical research plan “Clinical study to investigate the safety and tolerability of a single administration of autologous deciduous dental pulp stem cells to children with cerebral palsy” at Nagoya University was approved by the Nagoya University Specially Certified Committee for Regenerative Medicine. |
| Nov 2022 | Presentation of research results on the therapeutic effects of SHED on a model of chronic-phase cerebral palsy at the 66th Academy Assembly of Japan Society of Neonatal Health and Development. |
| Nov 2022 | Publication of a paper on basic research on the novel treatment of brain tumours using next-generation SHED, which was carried out in collaboration with the Department of Neurosurgery, Hamamatsu University School of Medicine. |
| Oct 2022 | Joint patent application with Tokai National Higher Education and Research System for the treatment of cerebral palsy using SHED. |
Biosimilars business: Strong sales of GBS-007 and approval for additional indications
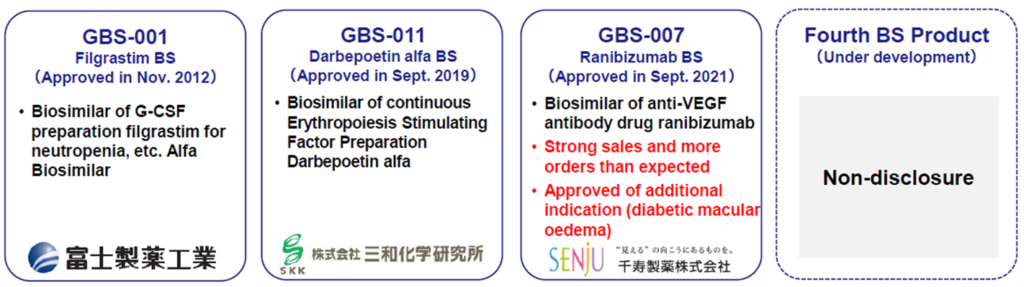
*Ranibizumab (GBS-007): The third product in the BS business, Ranibizumab BS, an anti-VEGF antibody drug for the treatment of age-related macular degeneration, was launched by development partner Senju Pharmaceutical on 9 December 2021. As the BS is the first in the ophthalmology field, it has attracted much attention, sales have been strong, and orders exceeded initial forecasts. Furthermore, on 13 January 2023, the company announced the approval of an additional indication for GBS-007, adding ‘diabetic macular oedema’ to the existing indications of ‘age-related macular degeneration with subcentral choroidal neovascularisation’ and ‘choroidal neovascularisation in pathological myopia’. It is expected to broaden the drug treatment options for these diseases and reduce the economic burden on patients. The approval of the additional indications is due to the patent expiry for the existing drugs. It is expected to affect the company’s performance little, but strengthening the BS business is positive for its corporate value.
*Filgrastim (GBS-001): BS, GBS-001, which the partner has already launched, has also taken cost-cutting measures and is making a significant contribution to profits.
*BS pipeline: The company is developing a BS to follow GBS-007, and the fourth product has been included in the company’s R&D expenditure for FY2023/3. Details are undisclosed, but it is likely to be launched in the not-too-distant future and is expected to contribute to earnings as early as FY2024/3. For the fifth and subsequent products, the company has already identified development candidates and announced that it has started selecting partner companies.
BS business line-up
New biologics business: Promoting efforts to create antibody drugs with new mechanisms
*Anti-RAMP2 antibody to address unmet needs in retinopathy of prematurity: In its new biologics business, the company collaborates with several academics to create antibody drugs with new mechanisms. One example is the patent approval for an anti-RAMP2 antibody (GND-004). The anti-RAMP2 antibody is a novel antibody created through joint research with Professor Takayuki Shindo’s research group at Shinshu University School of Medicine. It is being developed under the company’s development code GND-004. The patent application states that the anti-RAMP2 antibody binds to the RAMP2 (Receptor Activity-Modifying Protein 2)/CRLR (Calcitonin Receptor-Like Receptor) complex. This inhibits the promotion of pathological angiogenesis. As a result, it is expected to be clinically applicable for retinopathy of prematurity. Anti-VEGF drugs are already known as angiogenesis inhibitors, but the anti-RAMP2 antibody acts via a different pathway to anti-VEGF. The company intends to promote licensing activities for anti-RAMP2 antibodies while differentiating them from existing drugs.
◇FY2024/3 forecast: Sales of 3.5 billion yen planned. Achieving the sales target of the medium-term strategic plan two years ahead of schedule.
The company has announced FY2024/3 forecasts of sales of 3.5 billion yen, an operating loss of 1.5 billion yen and a net loss of 1.55 billion yen. The company expects to achieve the sales target set out in its medium-term strategic plan two years ahead of schedule. It expects GBS-007 to grow and a fourth biosimilar to contribute to revenues. GBS-007 orders have exceeded expectations, and with the approval of an additional indication, sales are expected to increase further. On the other hand, R&D expenditure is expected to increase to 1.6 billion yen per year from 1.2 billion yen in the previous year, as the company plans to retain its investment focus on the cell therapy business, including SHED. In addition to the increase in R&D costs, the deficit is expected to widen due to a worsening COGS because of the change in the product mix of BS, resulting in an operating loss of 1.5 billion yen.
◇Stock price: Is more concrete progress of SHED a key?
In its medium-term strategic plan (KWB 2.0), the company plans to achieve profitability in operating profit in FY2025 (1 billion yen) by generating solid earnings from the BS business. At the same time, the company has stated its intention to accelerate business development with an eye on the global market through continuous investment in SHED. These plans are intended to move away from business development that has until now been focused almost exclusively on the domestic market and to expand overseas in one fell swoop, with SHED as a pillar. To achieve this, the company expects to invest an order of magnitude more than in the past and to raise funds, so the hurdles it must clear in the future are high. These numerous uncertainties are also considered a drag on the share price. On the other hand, BS sales are growing faster than expected, and the SHED project is making steady progress. With further concrete progress expected during the current fiscal year, we are interested to see if the shares are revalued.
Kidswell Bio (4584) Share price and events over the past year
Stock price transition (last 6 years)
Historical PBR(4584, last three years, LTM)
Financial data
| FY (¥mn) | 2020/3 | 2021/3 | 2022/3 | 2023/3 | ||||||||||||
| 1Q | 2Q | 3Q | 4Q | 1Q | 2Q | 3Q | 4Q | 1Q | 2Q | 3Q | 4Q | 1Q | 2Q | 3Q | 4Q | |
| [Statements of income] | ||||||||||||||||
| Net sales | 284 | 30 | 419 | 345 | 121 | 53 | 547 | 276 | 303 | 438 | 642 | 186 | 610 | 505 | 610 | 1,049 |
| Cost of sales | 77 | 8 | 359 | 209 | 5 | 35 | 46 | 34 | 122 | 154 | 183 | 91 | 292 | 128 | 233 | 597 |
| Gross profit | 207 | 22 | 60 | 136 | 116 | 19 | 500 | 242 | 182 | 283 | 460 | 94 | 318 | 377 | 377 | 453 |
| SG&A expenses | 417 | 423 | 381 | 365 | 354 | 463 | 465 | 565 | 491 | 425 | 442 | 580 | 356 | 328 | 524 | 869 |
| R&D expenses | 235 | 249 | 201 | 213 | 138 | 265 | 198 | 363 | 297 | 236 | 237 | 380 | 105 | 147 | 327 | 637 |
| Operating profit (loss) | -210 | -401 | -321 | -229 | -238 | -445 | 36 | -323 | -309 | -142 | 18 | -486 | -37 | 49 | -146 | -415 |
| Non-operating income | 0 | 0 | 1 | 0 | 0 | 1 | 1 | 1 | 2 | 0 | 0 | 1 | 0 | 2 | 0 | 1 |
| Non-operating expenses | 2 | 1 | 20 | 4 | 7 | 5 | 4 | 8 | 6 | 8 | 15 | 7 | 43 | 13 | 5 | 17 |
| Ordinary profit (loss) | -212 | -402 | -340 | -233 | -244 | -450 | 33 | -330 | -314 | -150 | 4 | -493 | -80 | 39 | -151 | -431 |
| Extraordinary income | 4 | 0 | 0 | 2 | 418 | 0 | – | – | – | – | ||||||
| Extraordinary expenses | 5,939 | 0 | 0 | 194 | 0 | 1 | 8 | 0 | – | – | – | – | ||||
| Profit (loss) before income taxes | -6,147 | -402 | -340 | -425 | -244 | -451 | 26 | -331 | -314 | -148 | 421 | -493 | -80 | 39 | -151 | -462 |
| Total income taxes | 1 | 0 | 3 | -2 | 1 | 0 | 0 | 1 | 0 | 1 | 52 | -51 | 0 | 1 | 0 | 0 |
| Net profit (loss) | -6,147 | -403 | -342 | -424 | -245 | -451 | 25 | -330 | -314 | -149 | 369 | -441 | -80 | 38 | -152 | -462 |
| [Balance Sheets] | ||||||||||||||||
| Current assets | 2,761 | 2,390 | 3,238 | 3,322 | 3,573 | 3,218 | 3,329 | 3,346 | 2,794 | 3,203 | 3,722 | 3,326 | 4,079 | 4,035 | 3,948 | 3,,697 |
| Cash equivalents and short-term securities |
1,654 | 1,602 | 2,482 | 2,033 | 2,658 | 2,502 | 1,830 | 1,461 | 874 | 974 | 1,253 | 1,187 | 1,532 | 1,874 | 1,499 | 1,067 |
| Non-current assets | 330 | 427 | 418 | 270 | 379 | 393 | 340 | 588 | 728 | 656 | 178 | 177 | 225 | 224 | 224 | 197 |
| Tangible assets | 2 | 2 | 2 | 2 | 2 | 2 | 2 | 3 | 3 | 2 | 2 | 2 | 1 | 1 | 1 | 1 |
| Investments and other assets | 328 | 425 | 416 | 268 | 374 | 389 | 336 | 582 | 722 | 651 | 173 | 173 | 220 | 220 | 220 | 193 |
| Total assets | 3,091 | 2,817 | 3,656 | 3,592 | 3,952 | 3,611 | 3,670 | 3,934 | 3,522 | 3,859 | 3,901 | 3,503 | 4,304 | 4,259 | 4,173 | 3,894 |
| Current liabilities | 421 | 550 | 529 | 881 | 772 | 858 | 925 | 1,114 | 823 | 1,034 | 1,045 | 1,129 | 1,175 | 651 | 780 | 1,055 |
| Short-term borrowings | 25 | 25 | 25 | 25 | 25 | |||||||||||
| Long-term debts to be repaid within one year |
75 | 250 | 300 | 400 | 375 | |||||||||||
| Non-current liabilities | 25 | 24 | 1,224 | 1,224 | 1,384 | 1,287 | 1,231 | 1,209 | 1,051 | 826 | 718 | 656 | 1,485 | 1,908 | 1,704 | 1,605 |
| Long-term debt | 1,200 | 1,200 | 1,340 | 1,240 | 1,200 | 1,100 | 900 | 700 | 700 | 625 | 1,450 | 1,875 | 2,275 | 1,575 | ||
| Long-term borrowing | 600 | 600 | 600 | 600 | 600 | 600 | 600 | 600 | 600 | 525 | 1,350 | 1,275 | 1,175 | 1,075 | ||
| Convertible bonds | 600 | 600 | 740 | 640 | 600 | 500 | 300 | 100 | 100 | 100 | 100 | |||||
| Total liabilities | 446 | 573 | 1,752 | 2,105 | 2,156 | 2,145 | 2,156 | 2,324 | 1,873 | 1,860 | 1,763 | 1,785 | 2,661 | 2,560 | 2,485 | 2,661 |
| Total net assets | 2,644 | 2,244 | 1,904 | 1,487 | 1,796 | 1,466 | 1,514 | 1,610 | 1,648 | 1,999 | 2,138 | 1,719 | 1,643 | 1,699 | 1,688 | 1,233 |
| Total shareholders’ equity | 2,644 | 2,244 | 1,904 | 1,487 | 1,796 | 1,466 | 1,514 | 1,610 | 1,648 | 1,999 | 2,138 | 1,719 | 1,444 | 1,500 | 1,490 | 1,037 |
| Capital | 612 | 612 | 612 | 612 | 842 | 892 | 912 | 1,032 | 1,150 | 1,420 | 1,420 | 1,421 | 1,424 | 1,433 | 1,504 | 1,509 |
| Legal capital reserve | 9,917 | 9,917 | 9,917 | 9,917 | 10,147 | 10,197 | 10,217 | 10,338 | 10,456 | 10,725 | 10,726 | 10,727 | 10,730 | 10,739 | 10,810 | 10,815 |
| Retained earnings | -7,908 | -8,311 | -8,653 | -9,077 | -9,322 | -9,773 | -9,748 | -10,079 | -10,393 | -10,542 | -10,173 | -10,614 | -10,710 | -10,672 | -1,0824 | -11,287 |
| Stock acquisition right | 38 | 43 | 51 | 57 | 70 | 82 | 101 | 116 | 134 | 145 | 165 | 185 | 199 | 199 | 197 | 195 |
| Total liabilities and net assets | 3,091 | 2,817 | 3,656 | 3,592 | 3,952 | 3,611 | 3,670 | 3,934 | 3,522 | 3,859 | 3,901 | 3,503 | 4,304 | 4,259 | 4,173 | 3.894 |
| [Statements of cash flows] | ||||||||||||||||
| Cash flow from operating activities | -604 | -1,325 | -104 | -1,267 | -857 | -1,169 | -709 | -1,421 | ||||||||
| Loss before income taxes | -6,548 | -7,314 | -695 | -999 | -462 | -533 | -42 | -656 | ||||||||
| Cash flow from investing activities | -106 | -137 | -5 | -22 | – | 526 | -23 | -28 | ||||||||
| Expenditure on acquisition of intangiblefixed assets |
– | – | -3 | -3 | – | -1 | – | – | ||||||||
| Purchase of investment securities | -100 | -100 | – | – | – | – | -50 | -50 | ||||||||
| Sales of investment securities | – | – | – | – | – | 526 | – | – | ||||||||
| Cash flow from financing activities | 40 | 1,221 | 579 | 718 | 370 | 369 | 1,446 | 1,356 | ||||||||
| Income from the issuance of convertible bond-type bonds with stock acquisition rights |
970 | 970 | ||||||||||||||
| Income from issuance of shares by exercising stock acquisition rights |
– | 599 | 599 | 599 | – | – | 499 | 499 | ||||||||
| Income from issuance of stock acquisition rights |
40 | 40 | – | 138 | 370 | 369 | – | 34 | ||||||||
| Proceeds from issuance of new shares | – | 3 | 4 | 4 | – | – | – | 1 | ||||||||
| Net increase in cash and cash equiv. | -670 | -240 | 468 | -571 | -486 | -273 | 713 | -93 | ||||||||
| Cash and cash equiv. at beginning of period | 2,009 | 2,009 | 2,032 | 2,032 | 1,461 | 1,462 | 1,160 | 1,160 | ||||||||
| Cash and cash equiv. at end of period | 1,602 | 2,032 | 2,501 | 1,461 | 974 | 1,187 | 1,874 | 1,067 |
Note: Consolidated basis until FY2022/3; non-consolidated basis from 1Q FY2023/3. For the statement of cash flows, the figures for 2Q are the cumulative figures for the period from 1Q to 2Q, and the figures for 4Q are the cumulative figures for the period from 1Q to 4Q. Therefore, the opening balance is also the balance at the beginning of each quarter.
Source: Omega Investment from company materials
2013/3 |
2014/3 |
2015/3 |
2016/3 |
2017/3 |
2018/3 |
2019/3 |
2020/3 |
2021/3 |
2022/3 |
2023/3 |
|
[Statements of income] |
|||||||||||
Net sales |
60 |
301 |
321 |
1,160 |
1,089 |
1,059 |
1,021 |
1,077 |
996 |
1,569 |
2,776 |
Cost of sales |
15 |
141 |
147 |
500 |
397 |
422 |
412 |
653 |
119 |
550 |
1,250 |
Gross profit |
45 |
159 |
174 |
660 |
692 |
637 |
609 |
424 |
876 |
1,018 |
1,525 |
SG&A expenses |
403 |
671 |
998 |
1,480 |
1,876 |
1,550 |
1,414 |
1,585 |
1,846 |
1,937 |
2,076 |
R&D expenses |
206 |
412 |
689 |
1,075 |
1,433 |
1,107 |
945 |
898 |
963 |
1,150 |
1,216 |
Operating loss |
-358 |
-512 |
-824 |
-820 |
-1,184 |
-913 |
-806 |
-1,161 |
-969 |
-919 |
-550 |
Non-operating income |
0 |
0 |
34 |
50 |
35 |
11 |
3 |
1 |
2 |
2 |
3 |
Non-operating expenses |
16 |
5 |
0 |
15 |
27 |
0 |
14 |
27 |
24 |
36 |
77 |
Ordinary loss |
-373 |
-516 |
-790 |
-785 |
-1,176 |
-903 |
-816 |
-1,187 |
-991 |
-952 |
-624 |
Extraordinary income |
|
|
|
|
|
0 |
7 |
5 |
|
418 |
– |
Extraordinary expenses |
|
|
0 |
|
45 |
|
45 |
6,132 |
8 |
31 |
|
Loss before income taxes |
-373 |
-517 |
-790 |
-785 |
-1,222 |
-902 |
-854 |
-7,314 |
-999 |
-533 |
-656 |
Total income taxes |
3 |
2 |
1 |
1 |
2 |
1 |
1 |
2 |
1 |
1 |
1 |
Net loss |
-377 |
-519 |
-792 |
-787 |
-1,224 |
-904 |
-856 |
-7,316 |
-1,001 |
-535 |
-657 |
[Balance Sheets] |
|||||||||||
Current assets |
919 |
1,881 |
1,092 |
1,520 |
3,421 |
2,692 |
2,821 |
3,322 |
3,346 |
3,325 |
3,697 |
Cash and cash equivalents |
887 |
1,610 |
599 |
817 |
2,379 |
1,891 |
2,009 |
2,032 |
1,461 |
1,187 |
1,067 |
Non-current assets |
3 |
4 |
54 |
173 |
284 |
332 |
329 |
269 |
587 |
177 |
197 |
Tangible assets |
1 |
0 |
0 |
2 |
1 |
1 |
1 |
1 |
3 |
1 |
1 |
Investments and other assets |
2 |
3 |
53 |
171 |
282 |
330 |
328 |
267 |
581 |
172 |
193 |
Total assets |
922 |
1,886 |
1,146 |
1,694 |
3,706 |
3,025 |
3,151 |
3,592 |
3,933 |
3,503 |
3,894 |
Current liabilities |
24 |
50 |
92 |
1,279 |
189 |
404 |
400 |
880 |
1,114 |
1,128 |
1,055 |
Short-term borrowings |
|
|
|
810 |
|
|
|
25 |
|
75 |
375 |
Non-current liabilities |
9 |
783 |
783 |
11 |
16 |
16 |
19 |
1,223 |
1,209 |
656 |
1,605 |
Total liabilities |
34 |
833 |
876 |
1,290 |
205 |
421 |
420 |
2,104 |
2,323 |
1,784 |
2,661 |
Total net assets |
888 |
1,052 |
270 |
403 |
3,500 |
2,604 |
2,731 |
1,487 |
1,610 |
1,718 |
1,233 |
Total shareholders’ equity |
888 |
1,031 |
249 |
383 |
3,472 |
2,568 |
2,695 |
1,451 |
1,291 |
1,533 |
1,037 |
Capital stock |
1,239 |
1,571 |
1,576 |
2,037 |
4,194 |
100 |
591 |
611 |
1,032 |
1,421 |
1,509 |
Legal capital reserve |
1,143 |
1,474 |
1,479 |
1,940 |
4,097 |
3,372 |
3,864 |
9,917 |
10,337 |
10,726 |
10,815 |
Retained earnings |
-1,495 |
-2,014 |
-2,806 |
-3,594 |
-4,818 |
-904 |
-1,760 |
-9,077 |
-10,078 |
-10,613 |
-11,287 |
Evaluation/conversion difference |
|
|
|
-0 |
3 |
2 |
1 |
-21 |
202 |
||
Subscription rights to shares |
|
21 |
21 |
21 |
23 |
32 |
34 |
57 |
116 |
184 |
195 |
Total liabilities and net assets |
922 |
1,886 |
1,146 |
1,694 |
3,706 |
3,025 |
3,151 |
3,592 |
3,933 |
3,503 |
3,894 |
[Statements of cash flows] |
|||||||||||
Cash flow from operating activities |
-304 |
-729 |
-970 |
-607 |
-1,759 |
-438 |
-860 |
-1,325 |
-1,267 |
-1,169 |
-1,421 |
Loss before income taxes |
-373 |
-517 |
-790 |
-785 |
-1,222 |
-902 |
-854 |
-7,314 |
-999 |
-533 |
-656 |
Cash flow from investing activities |
-0 |
-1 |
-49 |
-121 |
-149 |
-50 |
-0 |
-137 |
-22 |
526 |
-28 |
Purchase of investment securities |
|
|
-49 |
-116 |
-149 |
|
|
-100 |
|
|
-50 |
Cash flow from financing activities |
907 |
1,454 |
9 |
946 |
3,471 |
|
978 |
1,221 |
718 |
369 |
1,356 |
Proceeds from issuance of
|
917 |
234 |
9 |
486 |
3,932 |
|
973 |
40 |
138 |
369 |
34 |
Net increase in cash and cash equiv. |
601 |
722 |
-1,010 |
217 |
1,562 |
-488 |
118 |
-240 |
-571 |
-273 |
-93 |
Cash and cash equiv. at beginning
|
285 |
887 |
1,610 |
599 |
817 |
2,379 |
1,891 |
2,009 |
2,032 |
1,461 |
1,160 |
Cash and cash equiv. at end of
|
887 |
1,610 |
599 |
817 |
2,379 |
1,891 |
2,009 |
2,032 |
1,461 |
1,187 |
1,067 |
FCF |
-305 |
-732 |
-1,021 |
-729 |
-1,909 |
-488 |
-860 |
-1,462 |
-1,289 |
-643 |
-1,450 |
Note: Consolidated basis until FY2022/3; non-consolidated basis from FY2023/3.
Source: Omega Investment from company materials