2026-07-15
Home
Japanese

Omega Investment Co., Ltd.
Itoki (Company note – 1Q update)

| Share price (5/29) | ¥854 | Dividend Yield (23/12 CE) | 2.93 % |
| 52weeks high/low | ¥879/360 | ROE(TTM) | 10.32 % |
| Avg Vol (3 month) | 232.3 thou shrs | Operating margin (TTM) | 4.32 % |
| Market Cap | ¥38.99 bn | Beta (5Y Monthly) | 0.97 |
| Enterprise Value | ¥36.18 bn | Shares Outstanding | 45.664 mn shrs |
| PER (23/12 CE) | 10.45 X | Listed market | TSE Prime |
| PBR (22/12 act) | 0.75 X |
| Click here for the PDF version of this page |
| PDF Version |
Demand for office furniture remains robust.
Record quarterly operating profit.
◇ Summary of 1Q results for FY12/2023: 5% net sales growth backed by strong demand for office furniture, with quarterly operating profit reaching a record high.
Itoki announced its 1Q results for FY12/2023 on 12 May, showing a 5% increase in net sales and a 20% increase in operating profit, and achieved a record-high operating profit on a quarterly basis. Sales were strong, mainly due to renewal projects and office relocations. Profits exceeded company forecasts thanks to sales increases and an improved profit margin which reflected enhanced customer value.
By segment, the mainstay Workplace business recorded sales of 27.7 billion yen (+3.0% YoY) and an operating profit of 4 billion yen (+14.3%), while Equipment / Public business recorded sales of 8.7 billion yen (+9.6%) and operating profit of 500 million yen (+87.8%). Both segments achieved increases in sales and profit.
The company’s sales and profits are biased for 1Q. Still, as of the end of the 1Q of the current fiscal year, the company had achieved 28.4% of its full-year sales estimate, 73.5% of the operating profit target and 89.1% of the forecast net profit attributable to owner of parent.
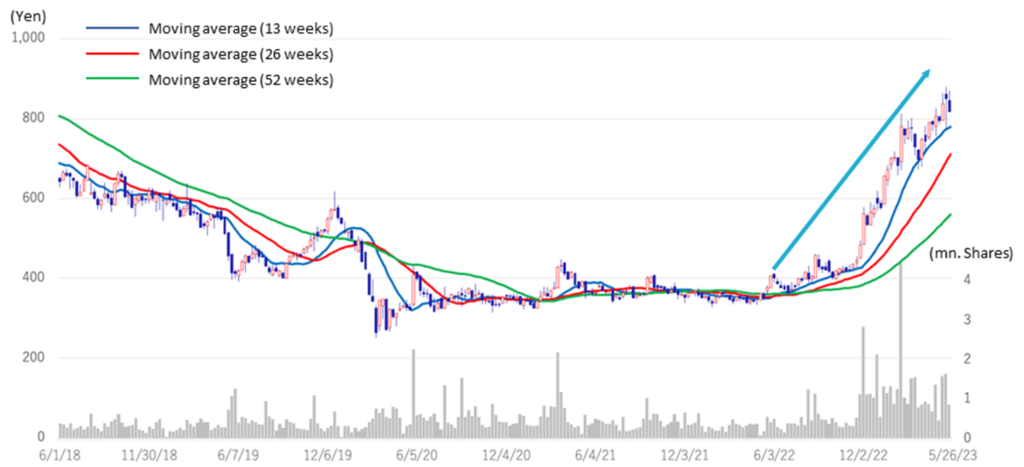
◇ Stock price: Up 45.4% since the beginning of the year; further upside expected, driven by the expansion of PBR.
The company’s share price has risen 45.4% YTD. In the same period, those of the peers in the sector rose between 5.5% and 24.1%, illustrating the superior performance of the company’s shares. This results from investors’ appreciation of the consistently robust demand for office furniture due to renewal projects to accommodate new ways of working and Itoki’s improving profitability due to sales activities focusing on increasing the value it provides for customers.
On 12 May, Itoki published a document entitled “Measures to realise management conscious of the cost of capital and share price”. The board of directors has decided on specific measures to achieve sustainable growth and increase corporate value over the medium to long term (see below for details). The company has stated that it will improve its PBR by taking these measures. This should raise the valuation of the shares further.
◇ Results for 1Q FY12/2023: 5% increase in sales and record operating profit on a quarterly basis.
The company’s 1Q results for FY12/2023 show sales of 36,965 million yen (+4.6% YoY), operating profit of 4,777 million yen (+20.5%) and net profit attributable to owner of parent 3,296 million yen (-2.7%). Operating profit reached a record high on a quarterly basis (the top chart on the next page).
In 1Q, the COGS ratio improved by 0.7 percentage points to 60.1% from 60.8% QoQ. The SGAE ratio fell by 1.0 percentage points from 28.0% to 27.0% QoQ, resulting in an operating margin of 12.9%, an improvement of 1.7 percentage points YoY.
| JPY, mn, % | Net sales | YoY % |
Oper. profit |
YoY % |
Ord. profit |
YoY % |
Profit ATOP |
YoY % |
EPS (¥) |
DPS (¥) |
| 2019/12 | 122,174 | 2.9 | 903 | -53.1 | 945 | -60.1 | -550 | – | -12.08 | 13.00 |
| 2020/12 | 116,210 | -4.9 | 1,798 | 99.1 | 1,881 | 99.0 | -235 | – | -5.18 | 13.00 |
| 2021/12 | 115,839 | -0.3 | 2,536 | 41.0 | 2,437 | 29.5 | 1,166 | – | 25.82 | 15.00 |
| 2022/12 | 123,324 | 6.4 | 4,582 | 79.0 | 4,177 | 71.4 | 5,294 | 353.9 | 116.99 | 37.00 |
| 2023/12 (CE) | 130,000 | 5.4 | 6,500 | 41.8 | 6,500 | 55.6 | 3,700 | -30.1 | 81.70 | 25.00 |
| 2022/12 1Q | 35,345 | 9.9 | 3,964 | 133.4 | 3,974 | 139.7 | 3,388 | 74.4 | 74.95 | – |
| 2023/12 1Q | 36,965 | 4.6 | 4,777 | 20.5 | 4,824 | 21.4 | 3,296 | -2.7 | 72.80 | – |
Sales/operating profit (Quarterly)
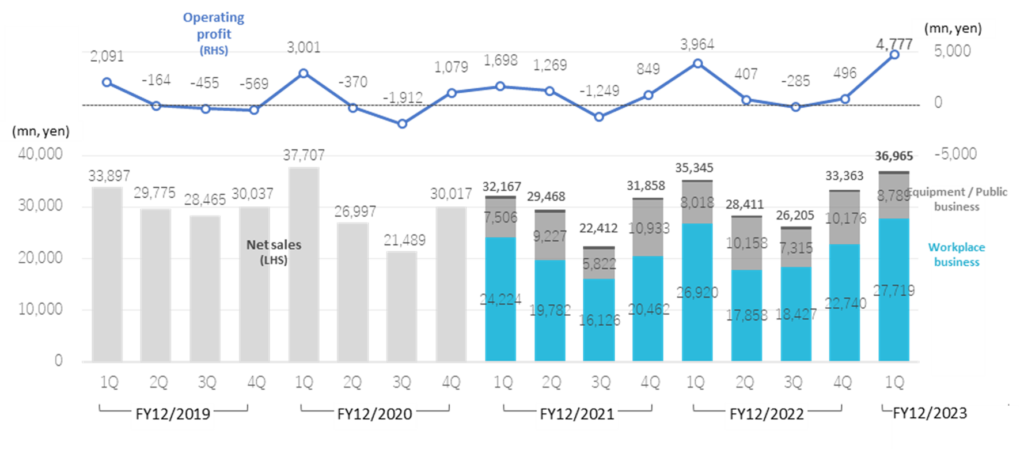
Note: Figures for IT/sharing projects are not shown in the figure as they are small.
Source: Omega Investment from company materials
See the chart below for the factors behind the change in operating profit. The increase in profits due to higher sales, improved gross margins thanks to restructuring projects, and lower logistics costs absorbed the increase in strategic expenditure, resulting in a significant profit increase.
◇ Segmental trends
1)Workplace business: Sales: 27,719 million yen, +3.0%; operating profit: 4,059 million, +14.3%.
Renewal projects increased in line with new hybrid ways of working after the outbreak of COVID-19. In addition, office furniture sales were strong, mainly due to office relocations. Meanwhile, the profit margin improved (13.2% in 1Q FY12/2022 → 14.6% in 1Q FY12/2023) as a result of increased sales and a focus on enhancing the value provided while anticipating the impact of rising raw material prices, resulting in a significant increase in profit (see next page, top chart).
Factor analysis of changes in operating profit
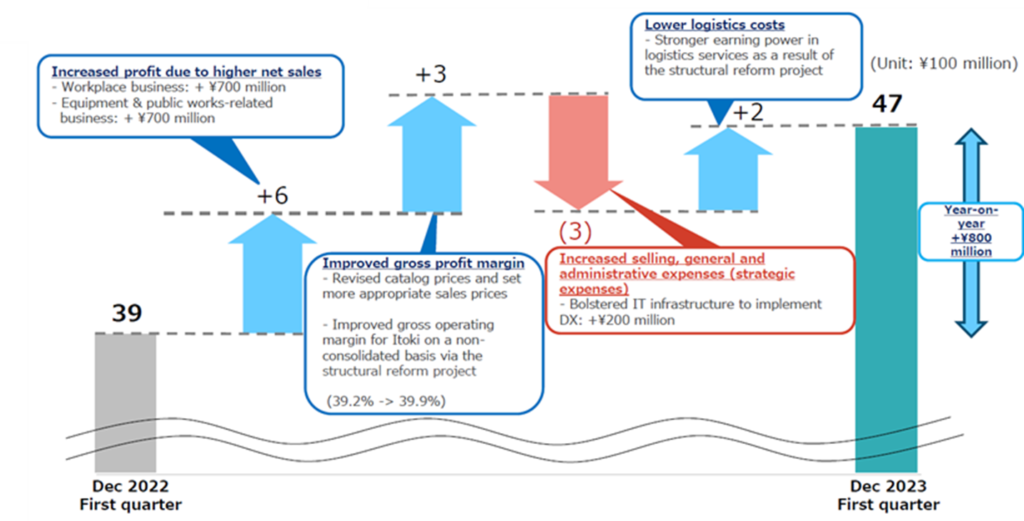
Source: The company materials for the 1Q results for FY12/2023 (published on 12 May, 2023)
Workplace business (quarterly)
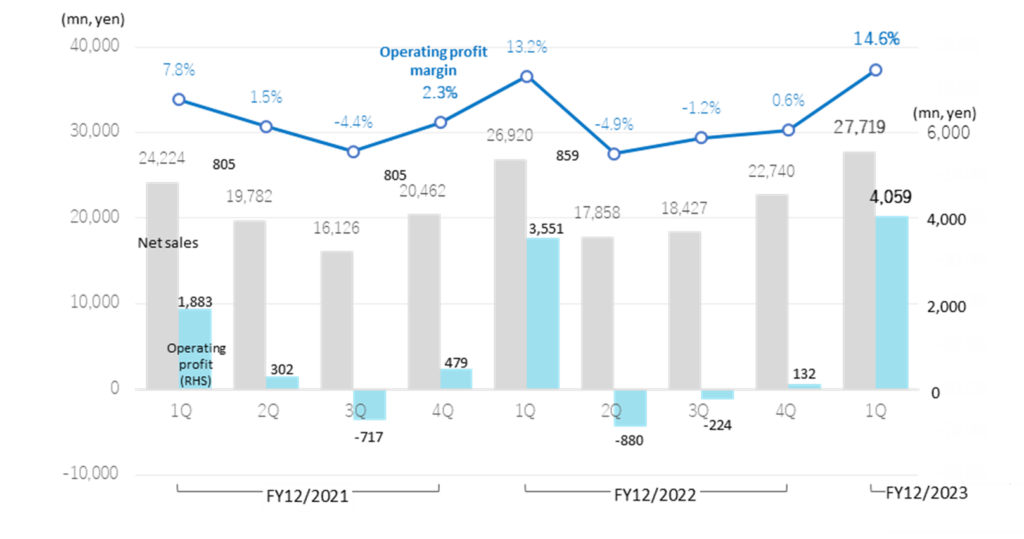
Source: Omega Investment from company materials
2) Equipment / Public business: Sales: 8,789 million yen, +9.6%; operating profit: 553 million yen, +87.8%.
Demand for equipment for public facilities, such as display cases for museums and art galleries and digital signage, was strong, leading to an increase in sales of nearly 10%. Profit margins improved (from 3.7% in 1Q FY12/2022 to 6.3% in 1Q FY12/2023) due to increased sales and higher value provided by equipment for public facilities, resulting in a significant profit increase (see chart below).
Equipment / Public business (quarterly)

Source: Omega Investment from company materials
◇ Full-year forecasts for FY12/2023: No change in the company guidance.
The company forecasts for FY12/2023 include sales of 130 billion yen (+ 5.4% YoY), operating profit of 6.5 billion yen (+41.8%), ordinary profit of 6.5 billion yen (+55.6%) and net profit attributable to owner of parent 3.7 billion yen (-30.1%). The decrease in net profit for the year is due to the absence of an extraordinary gain on the sale of land in FY12/2022. Excluding this, profits will increase in the current financial year.
The company’s sales and profits tend to be biased for 1Q. As of the end of the last 1Q, the progress ratio against the full-year forecasts was 28.4% for sales, 73.5% for operating profit, 74.2% for ordinary profit and 89.1% for net profit attributable to owner of parent. This is slightly behind the 86.5% operating profit progress ratio registered in 1Q 2022/12. However, the company should be fine achieving its full-year forecasts comfortably as sales of projects for logistics facilities in Equipment / Public business segment are biased for 2H of the year.
◇Explicitly states to realise “the management conscious of the cost of capital and share price”.
With the release of financial results, the company stated its actions to realise the management conscious of the cost of capital and share price. The announcement says that the company is committed to achieving sustainable growth and increasing its corporate value over the medium to long term and that, to this end, it will further strengthen its earnings power, disclose ESG and other information in a timely and appropriate manner, steadily implement measures to improve the cost of capital, including capital policies, and improve the equity spread, thereby improving the PBR.
The company’s approach to achieving these goals, and the specific measures it intends to implement, are shown in the diagram below. These include 1. strengthening earnings generation capacity, 2. improving ROE by reinforcing financial and capital strategies, and 3. raising PER by practising proactive investor relations and deepening dialogue with them. As a result, the plan is to achieve PBR≧1 as soon as possible, which is currently one of the major challenges for companies listed on the TSE Prime market.
Actions to realise the management conscious of the cost of capital and share price
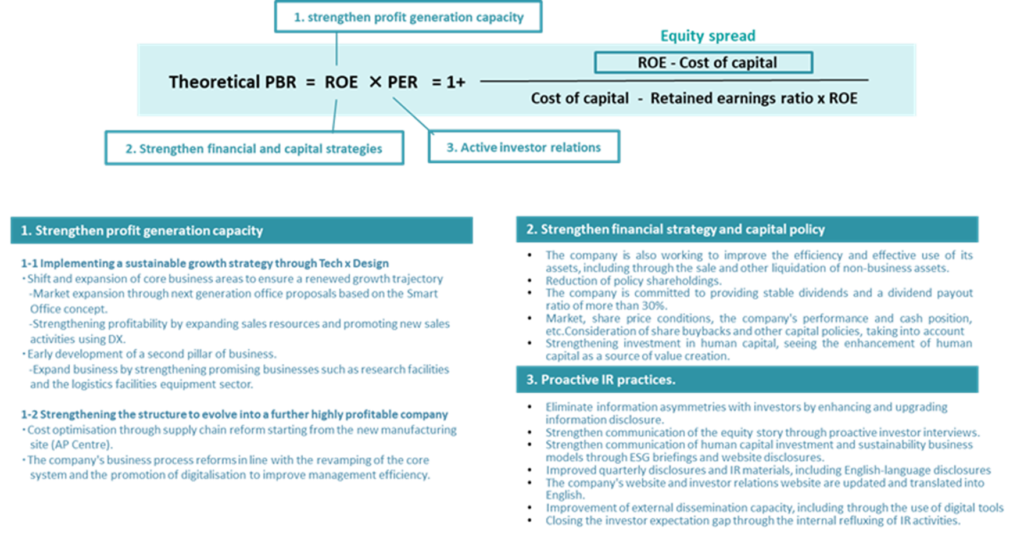
Source: Omega Investment from company materials
7972:5-year stock price move
Share price compared to TOPIX (last three years)

Financial data (quarterly basis)
| FY (¥mn) | 2020/12 | 2021/12 | 2022/12 | 2023/12 | |||||||||
| 1Q | 2Q | 3Q | 4Q | 1Q | 2Q | 3Q | 4Q | 1Q | 2Q | 3Q | 4Q | 1Q | |
| [Statements of income] | |||||||||||||
| Net sales | 37,707 | 26,997 | 21,489 | 30,017 | 32,167 | 29,451 | 22,396 | 31,871 | 35,345 | 28,411 | 26,205 | 33,363 | 36,965 |
| Year-on-year basis (%) | 11.2 | -9.3 | -24.5 | -0.1 | -14.7 | 9.2 | 4.3 | 6.1 | 9.9 | -3.6 | 16.9 | 11.2 | 4.7 |
| Cost of sales | 23,710 | 17,765 | 13,811 | 19,036 | 20,101 | 18,729 | 14,443 | 20,872 | 21,483 | 18,030 | 16,678 | 21,384 | 22,216 |
| Gross profit | 13,997 | 9,232 | 7,678 | 10,981 | 12,020 | 10,722 | 7,953 | 10,999 | 13,862 | 10,381 | 9,527 | 11,979 | 14,748 |
| SG&A expenses | 10,996 | 9,602 | 9,590 | 9,901 | 10,352 | 9,453 | 9,203 | 10,150 | 9,898 | 9,973 | 9,812 | 11,484 | 9,970 |
| Operating income | 3,001 | -370 | -1,912 | 1,079 | 1,698 | 1,275 | -1,242 | 829 | 3,964 | 407 | -285 | 496 | 4,777 |
| Year-on-year basis (%) | 43.5 | – | – | – | -43.4 | – | – | -23.2 | 133.4 | -68.7 | – | -40.2 | 20.5 |
| Operating profit ratio (%) | 8.0 | -1.4 | -8.9 | 3.6 | 5.3 | 4.3 | -5.5 | 2.6 | 11.2 | 1.4 | -1.1 | 1.5 | 12.9 |
| Non-operating income | 154 | 162 | 251 | 237 | 240 | 161 | 171 | 122 | 125 | 164 | 171 | 96 | 125 |
| Non-operating expenses | 273 | 168 | 107 | 172 | 250 | 257 | 101 | 185 | 115 | 130 | 177 | 539 | 79 |
| Ordinary income | 2,882 | -376 | -1,768 | 1,143 | 1,657 | 1,173 | -1,179 | 786 | 3,974 | 442 | -291 | 52 | 4,824 |
| Extraordinary income | 0 | 6 | 125 | 980 | 1,255 | 78 | 133 | 88 | 786 | 139 | 118 | 6,762 | 1 |
| Extraordinary expenses | 116 | 42 | 55 | 1,503 | 20 | 456 | 518 | 1,474 | 44 | 64 | 38 | 3,465 | 21 |
| Income before income taxes | 2,766 | -412 | -1,697 | 620 | 2,893 | 795 | -1,565 | -600 | 4,716 | 516 | -211 | 3,351 | 4,804 |
| Total income taxes | 1,039 | 134 | -195 | 654 | 1,028 | 490 | -132 | -796 | 1,381 | 246 | -21 | 1,585 | 1,506 |
| Net income | 1,760 | -557 | -1,491 | 53 | 1,942 | 348 | -1,440 | 316 | 3,388 | 288 | -159 | 1,777 | 3,296 |
| Year-on-year basis (%) | 43.6 | – | – | – | 10. | – | – | 496.2 | 74.4 | -17.2 | – | 462.3 | -2.7 |
| Net income ratio (%) | 4.7 | -2.1 | -6.9 | 0.2 | 6.0 | 1.2 | -6.4 | 1.0 | 9.6 | 1.0 | -0.6 | 5.3 | 8.9 |
| [Balance Sheets] | |||||||||||||
| Current assets | 69,811 | 60,382 | 52,463 | 57,183 | 65,543 | 62,170 | 55,249 | 57,753 | 69,458 | 64,096 | 59,873 | 71,027 | 72,230 |
| Cash and deposits | 18,186 | 21,312 | 18,956 | 18,246 | 19,503 | 22,112 | 18,213 | 17,351 | 19,196 | 20,073 | 17,138 | 26,876 | 20,898 |
| Notes and accounts receivable - trade |
37,611 | 27,230 | 20,298 | 26,599 | 32,061 | 26,596 | 21,385 | 26,783 | – | – | – | – | – |
| Notes and accounts receivable - trade, and contract assets |
– | – | – | – | – | – | – | – | 35,205 | 28,234 | 24,111 | 29,316 | 34,519 |
| Non-current assets | 49,872 | 49,933 | 50,410 | 47,912 | 46,925 | 46,369 | 46,046 | 46,144 | 46,647 | 47,395 | 48,126 | 44,260 | 43,611 |
| Property, plant and equipment | 27,612 | 27,350 | 27,329 | 26,206 | 25,184 | 24,779 | 24,887 | 24,417 | 25,105 | 26,042 | 26,932 | 24,978 | 24,689 |
| Intangible assets | 5,113 | 5,623 | 5,853 | 5,590 | 5,504 | 5,419 | 4,885 | 4,114 | 4,128 | 4,168 | 4,145 | 1,819 | 1,837 |
| Goodwill | 2,391 | 2,207 | 2,189 | 2,093 | 2,018 | 2,016 | 1,407 | 1,317 | 1,214 | 1,222 | 1,200 | 517 | 446 |
| Investments and other assets | 17,146 | 16,959 | 17,227 | 16,116 | 16,236 | 16,170 | 16,273 | 17,612 | 17,413 | 17,184 | 17,048 | 17,462 | 17,084 |
| Total assets | 120,352 | 110,940 | 103,453 | 105,096 | 112,469 | 108,540 | 101,295 | 103,898 | 116,105 | 111,492 | 108,000 | 115,288 | 115,841 |
| Current liabilities | 55,449 | 46,097 | 40,198 | 43,646 | 49,245 | 45,266 | 40,307 | 42,544 | 51,837 | 47,138 | 43,655 | 49,099 | 47,854 |
| Short-term borrowings | 15,616 | 13,289 | 14,239 | 13,234 | 13,458 | 12,061 | 12,409 | 12,500 | 15,014 | 11,976 | 11,738 | 11,239 | 10,874 |
| Non-current liabilities | 18,327 | 18,220 | 18,079 | 17,259 | 17,506 | 17,088 | 16,257 | 16,277 | 16,334 | 16,020 | 16,178 | 16,278 | 16,238 |
| Long-term borrowings | 9,475 | 9,574 | 9,453 | 8,508 | 8,711 | 8,193 | 7,435 | 7,591 | 7,427 | 7,174 | 7,266 | 7,530 | 7,453 |
| Total liabilities | 73,777 | 64,318 | 58,277 | 60,906 | 66,751 | 62,354 | 56,565 | 58,822 | 68,172 | 63,158 | 59,833 | 65,377 | 64,092 |
| Total net assets | 46,575 | 46,621 | 45,175 | 44,189 | 45,717 | 46,186 | 44,730 | 45,076 | 47,933 | 48,333 | 48,166 | 49,910 | 51,748 |
| Shareholders’ equity | 46,123 | 46,197 | 44,768 | 43,812 | 45,419 | 45,872 | 44,454 | 44,931 | 47,837 | 48,254 | 48,117 | 49,871 | 50,806 |
| Share capital | 5,294 | 5,294 | 5,294 | 5,294 | 5,294 | 5,294 | 5,294 | 5,294 | 5,294 | 5,294 | 5,294 | 5,294 | 5,294 |
| Capital surplus | 9,201 | 9,642 | 9,641 | 9,628 | 9,628 | 9,632 | 9,632 | 9,638 | 9,638 | 9,638 | 9,638 | 9,638 | 9,638 |
| Retained earnings | 31,030 | 30,461 | 28,884 | 28,950 | 30,306 | 30,654 | 29,213 | 29,530 | 32,477 | 32,769 | 32,610 | 34,387 | 36,008 |
| Treasury shares | -46 | -6 | -33 | -182 | -182 | -161 | -161 | -161 | -161 | -134 | -134 | -134 | -314 |
| Share acquisition rights | 45 | 45 | 45 | 45 | 45 | 45 | 45 | 45 | 45 | 45 | 45 | ||
| Total liabilities and net assets | 120,352 | 110,940 | 103,453 | 105,096 | 112,469 | 108,540 | 101,295 | 103,898 | 116,105 | 111,492 | 108,000 | 115,288 | 115,841 |
| [Statements of cash flows] | |||||||||||||
| Cash flow from operating activities | 5,404 | -843 | 4,577 | -1,803 | 4,581 | 1,223 | |||||||
| Cash flow from investing activities | -1,442 | 290 | 503 | -1,673 | -1,410 | 6,333 | |||||||
| Cash flow from financing activities | 293 | -2,560 | -1,418 | -1,240 | -661 | -765 | |||||||
| Free cash flow | 3,962 | -553 | 5,080 | -3,476 | 3,171 | 7,556 | |||||||
| Net increase in cash and cash equiv. | 4,240 | -3,037 | 3,787 | -4,687 | 2,711 | 6,911 | |||||||
| Cash and cash equiv. at beginning of period | 15,494 | 19,735 | 16,697 | 20,485 | 15,797 | 18,509 | |||||||
| Cash and cash equiv. at end of period | 19,735 | 16,697 | 20,485 | 15,797 | 18,509 | 25,420 |
Source: Omega Investment from company materials
Financial data (full-year basis)
| FY (¥mn) | FY2012/12 | FY2013/12 | FY2014/12 | FY2015/12 | FY2016/12 | FY2017/12 | FY2018/12 | FY2019/12 | FY2020/12 | FY2021/12 | FY2022/12 |
| [Statements of income] | |||||||||||
| Net sales | 105,508 | 103,461 | 102,993 | 106,516 | 101,684 | 108,684 | 118,700 | 122,174 | 116,210 | 115,839 | 123,324 |
| Year-on-year basis (%) | 14.6 | -1.9 | -0.5 | 3.4 | -4.5 | 6.9 | 9.2 | 2.9 | -4.9 | -0.3 | 6.4 |
| Cost of sales | 70,027 | 67,118 | 66,797 | 68,374 | 65,021 | 69,966 | 77,436 | 80,495 | 74,322 | 74,145 | 77,575 |
| Gross profit | 35,481 | 36,343 | 36,196 | 38,142 | 36,663 | 38,718 | 41,264 | 41,679 | 41,888 | 41,694 | 45,749 |
| Gross profit ratio (%) | 33.6 | 35.1 | 35.1 | 35.8 | 36.1 | 35.6 | 34.8 | 34.1 | 36.0 | 36.0 | 37.1 |
| SG&A expenses | 32,040 | 32,203 | 33,723 | 33,836 | 33,862 | 35,761 | 39,339 | 40,776 | 40,089 | 39,158 | 41,167 |
| Operating income | 3,441 | 4,140 | 2,472 | 4,306 | 2,800 | 2,956 | 1,925 | 903 | 1,798 | 2,536 | 4,582 |
| Operating profit ratio (%) | 3.3 | 4.0 | 2.4 | 4.0 | 2.8 | 2.7 | 1.6 | 0.7 | 1.5 | 2.2 | 3.7 |
| Non-operating income | 813 | 813 | 841 | 898 | 771 | 750 | 889 | 677 | 804 | 694 | 556 |
| Non-operating expenses | 518 | 528 | 495 | 605 | 483 | 412 | 448 | 634 | 720 | 793 | 961 |
| Ordinary income | 3,735 | 4,425 | 2,818 | 4,599 | 3,087 | 3,295 | 2,365 | 945 | 1,881 | 2,437 | 4,177 |
| Extraordinary income | 269 | 685 | 615 | 171 | 97 | 228 | 919 | 27 | 1,111 | 1,554 | 7,805 |
| Extraordinary expenses | 352 | 238 | 262 | 524 | 267 | 121 | 204 | 35 | 1,716 | 2,468 | 3,611 |
| Income before income taxes | 3,653 | 4,872 | 3,171 | 4,246 | 2,918 | 3,401 | 3,081 | 938 | 1,277 | 1,523 | 8,372 |
| Total income taxes | 689 | 876 | 813 | -385 | 1,068 | 959 | 1,339 | 1,517 | 1,632 | 590 | 3,191 |
| Net income | 2,702 | 3,910 | 2,160 | 4,530 | 1,907 | 2,402 | 1,722 | -550 | -235 | 1,166 | 5,294 |
| Net income ratio (%) | 2.6 | 3.8 | 2.1 | 4.3 | 1.9 | 2.2 | 1.5 | -0.5 | -0.2 | 1.0 | 4.3 |
| [Balance Sheets] | |||||||||||
| Current assets | 49,294 | 52,925 | 55,714 | 56,342 | 52,410 | 58,147 | 62,143 | 58,109 | 57,183 | 57,753 | 71,027 |
| Cash and deposits | 17,441 | 19,553 | 21,211 | 21,456 | 19,839 | 19,977 | 16,229 | 17,030 | 18,246 | 17,351 | 26,876 |
| Notes and accounts receivable - trade |
24,935 | 26,243 | 25,965 | 26,138 | 23,241 | 26,869 | 33,160 | 28,244 | 26,599 | 26,783 | |
| Notes and accounts receivable - trade, and contract assets |
29,316 | ||||||||||
| Non-current assets | 39,961 | 42,335 | 41,007 | 41,832 | 43,271 | 44,073 | 46,559 | 49,955 | 47,912 | 46,144 | 44,260 |
| Property, plant and equipment | 27,928 | 28,193 | 27,041 | 26,395 | 25,322 | 24,426 | 26,362 | 27,781 | 26,206 | 24,417 | 24,978 |
| Intangible assets | 705 | 1,230 | 1,109 | 1,313 | 1,142 | 3,651 | 4,437 | 4,945 | 5,590 | 4,114 | 1,819 |
| Goodwill | 6 | 34 | 26 | 240 | 208 | 2,793 | 3,005 | 2,413 | 2,093 | 1,317 | 517 |
| Investments and other assets | 11,327 | 12,911 | 12,857 | 14,123 | 16,806 | 15,995 | 15,760 | 17,229 | 16,116 | 17,612 | 17,462 |
| Total assets | 89,256 | 95,261 | 96,721 | 98,175 | 95,681 | 102,221 | 108,703 | 108,778 | 105,096 | 103,898 | 115,288 |
| Current liabilities | 36,455 | 35,359 | 36,677 | 36,106 | 35,390 | 39,683 | 45,133 | 47,559 | 43,646 | 42,544 | 49,099 |
| Short-term borrowings | 11,222 | 11,473 | 11,087 | 10,940 | 11,760 | 12,564 | 11,721 | 15,533 | 13,234 | 12,500 | 11,239 |
| Non-current liabilities | 14,560 | 16,874 | 16,854 | 14,756 | 14,888 | 15,211 | 16,076 | 15,385 | 17,259 | 16,277 | 16,278 |
| Long-term borrowings | 4,122 | 5,124 | 5,089 | 5,171 | 5,296 | 5,328 | 5,113 | 6,633 | 8,508 | 7,591 | 7,530 |
| Total liabilities | 51,016 | 52,234 | 53,532 | 50,863 | 50,278 | 54,894 | 61,210 | 62,944 | 60,906 | 58,822 | 65,377 |
| Total net assets | 38,240 | 43,026 | 43,189 | 47,311 | 45,402 | 47,326 | 47,492 | 45,834 | 44,189 | 45,076 | 49,910 |
| Shareholders’ equity | 35,960 | 41,079 | 41,632 | 45,677 | 44,949 | 46,863 | 46,854 | 45,370 | 43,812 | 44,931 | 49,871 |
| Share capital | 5,277 | 5,277 | 5,277 | 5,277 | 5,277 | 5,277 | 5,277 | 5,294 | 5,294 | 5,294 | 5,294 |
| Capital surplus | 13,020 | 13,061 | 13,061 | 13,222 | 13,140 | 12,404 | 9,786 | 9,201 | 9,628 | 9,638 | 9,638 |
| Retained earnings | 18,520 | 22,073 | 23,556 | 29,223 | 30,504 | 32,315 | 31,104 | 29,862 | 28,950 | 29,530 | 34,387 |
| Treasury shares | -1,178 | -833 | -834 | -3,000 | -4,700 | -4,701 | 0 | -46 | -182 | -161 | -134 |
| Share acquisition rights | 45 | 45 | 45 | ||||||||
| Total liabilities and net assets | 89,256 | 95,261 | 96,721 | 98,175 | 95,681 | 102,221 | 108,703 | 108,778 | 105,096 | 103,898 | 115,288 |
| [Statements of cash flows] | |||||||||||
| Cash flow from operating activities | 8,259 | 3,162 | 5,715 | 4,522 | 5,072 | 3,565 | 1,384 | 3,586 | 4,561 | 2,774 | 5,804 |
| Cash flow from investing activities | -14 | -1,978 | -1,742 | -803 | -4,044 | -2,971 | -3,094 | -3,221 | -1,152 | -1,170 | 4,923 |
| Cash flow from financing activities | -1,652 | 51 | -2,179 | -3,807 | -2,571 | -706 | -2,463 | 0 | -2,267 | -2,658 | -1,426 |
| Free cash flow | 8,245 | 1,184 | 3,973 | 3,719 | 1,028 | 594 | -1,710 | 365 | 3,409 | 1,604 | 10,727 |
| Net increase in cash and cash equiv. | 6,601 | 1,944 | 1,814 | 184 | -1,619 | 88 | -4,031 | 952 | 1,203 | -900 | 9,622 |
| Cash and cash equiv. at beginning of period | 9,555 | 16,156 | 18,102 | 19,918 | 20,103 | 18,483 | 18,571 | 14,540 | 15,494 | 16,697 | 15,797 |
| Cash and cash equiv. at end of period | 16,156 | 18,102 | 19,918 | 20,103 | 18,483 | 18,571 | 14,540 | 15,494 | 16,697 | 15,797 | 25,420 |
Source: Omega Investment from company materials