2026-07-15
Home
Japanese

Omega Investment Co., Ltd.
Cosmo Bio (Company note – 1Q update)

| Share price (5/31) | ¥945 | Dividend Yield (23/12 CE) | 3.17 % |
| 52weeks high/low | ¥1,117/937 | ROE(TTM) | 5.16 % |
| Avg Vol (3 month) | 7,142 thou shrs | Operating margin (TTM) | 6.84 % |
| Market Cap | ¥5.7 bn | Beta (5Y Monthly) | 0.63 |
| Enterprise Value | ¥3.0 bn | Shares Outstanding | 6.048 mn shrs |
| PER (23/12 CE) | 12.16 X | Listed market | TSE Standard |
| PBR (22/12 act) | 0.67 X |
| Click here for the PDF version of this page |
| PDF Version |
Sales and profits were down but broadly in line with the company’s expectations. The company is addressing the impact of the weak yen and the cost increase by raising prices.
◇Summary of 1Q results for FY12/2023: Largely in line with expectations.
Cosmo Bio’s 1Q results for FY12/2023 were largely in line with company expectations, despite lower sales and profits YoY. Due to the nature of its customer transactions, the trades tend to be biased for 1Q. In this 1Q, two-thirds of the full-year operating profit estimate was earned.
As a nature of an import trading company, the company has been significantly affected by the yen’s depreciation since the middle of last year. Inflationary cost increases have also weighed on the business. Price hikes on some products are penetrating and appear to neutralise some of these cost pressures.
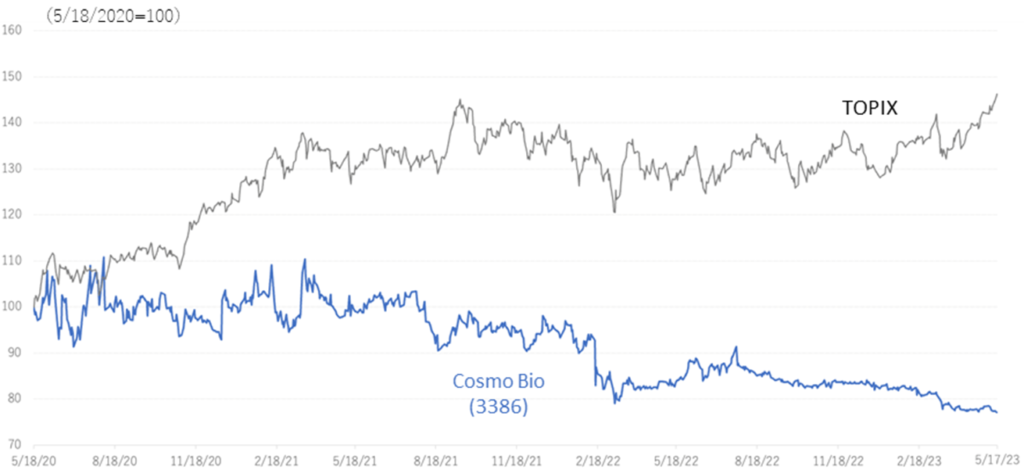
The company’s shares have traded mostly below 1,000 yen since the beginning of this year. From a macroeconomic perspective, the yen will likely remain weak. There is also pressure on research budgets at demand destinations, so the business environment in the immediate future is challenging. The company’s sales are expected to improve if sales activities return to pre-pandemic levels in line with the downgrading of COVID-19 to category five and the penetration of selling price changes implemented in response to rising purchase costs. PBR of less than 1x is also a concern we expect to address going forward.
◇ Results for 1Q FY12/2023
The 1Q results for FY12/2023 show sales of 2,828 million yen (-7.2% YoY), operating profit of 400 million (-30.7% YoY) and net profit attributable to owner of parent of 264 million yen (-27.8% YoY).
In terms of sales, in addition to the high sales in the same period of the previous year, sales have been sluggish as research expenses at universities and research institutions were recently affected by the inflationary economy.
As per profit, the yen’s depreciation has had a significant impact since the middle of last year. In 1Q of the previous year, the exchange rate was around 115 yen against the US dollar, 19 yen weaker than the most recent exchange rate of 134 yen. Although the company mitigates the risk of foreign exchange fluctuations to some extent by forward exchange rate contracts, the impact is significant. On the other hand, the company has been gradually raising prices on some products since last autumn (by several to 20% depending on the product). These put together, the gross profit margin fell from 38.1% in 1Q FY12/2022 to 36.7% in 1Q FY12/2023, a relatively low decline. SG&A expenses remained under control.
As mentioned, the company’s earnings tend to be high in 1Q due to the nature of customer budgets and other factors. In this 1Q, sales and operating profit were 28.9% and 66.7% against the full-year forecasts, respectively. In the 1Q of the previous FY12/2022, these ratios were 31.9% and 70.8%, so the current progress is almost on par YoY (see the diagram above on the next page).
| JPY, mn, % | Net sales | YoY % |
Oper. profit |
YoY % |
Ord. profit |
YoY % |
Profit ATOP |
YoY % |
EPS (¥) |
DPS (¥) |
| 2019/12 | 7,590 | 4.5 | 405 | 23.5 | 470 | 16.5 | 237 | -8.6 | 40.14 | 14.00 |
| 2020/12 | 8,092 | 6.6 | 752 | 85.6 | 817 | 73.7 | 674 | 183.2 | 113.70 | 34.00 |
| 2021/12 | 9,231 | 14.1 | 1,048 | 39.4 | 1,099 | 34.5 | 737 | 9.4 | 126.94 | 36.00 |
| 2022/12 | 9,553 | 3.5 | 816 | -22.2 | 790 | -28.1 | 517 | -29.8 | 89.13 | 36.00 |
| 2023/12 (CE) | 9,800 | 2.6 | 600 | -26.5 | 660 | -16.5 | 450 | 13.0 | 77.41 | 30.00 |
| 2022/12 1Q | 3,047 | 5.9 | 578 | 5.3 | 565 | 5.7 | 366 | 9.9 | 63.23 | – |
| 2023/12 1Q | 2,828 | -7.2 | 400 | -30.7 | 416 | -26.2 | 264 | -27.8 | 45.46 | – |
Sales and operating profit (quarterly)
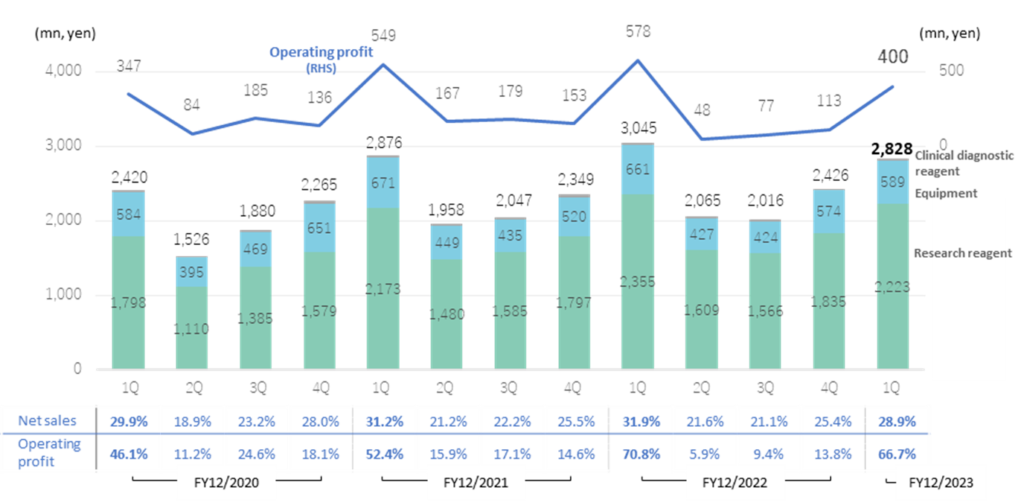
Note: Clinical diagnostics reagent sales are insignificant, and figures have not been shown. The table at the bottom shows the composition of the quarterly record to the full-year figures; The figures for FY12/2023 are a progress ratio to the full-year forecast.
Source: Omega Investment from company materials
By product, sales were down in each following categories: research reagent, 2,223 million yen (-5.6%); equipment, 589 million yen (-10.9%); and clinical diagnostics reagent, 16 million yen (-45.6%). The main reasons for these declines are as mentioned above. Still, it also appears that the company could not conduct sufficient sales activities and develop enough customers for new products when COVID-19 spread.
In the BS, cash and deposits at end-March 2023 amounted to 2,926 million yen, down 110 million yen from the end of the previous fiscal year. Due to the above-mentioned sales bias in 1Q, accounts receivable increased by 517 million yen to 3,242 million yen. Total assets at the end of March 2023 amounted to 10,695 million yen, an increase of 382 million yen from the end of the previous year.
Changes in the USD/Yen exchange rate
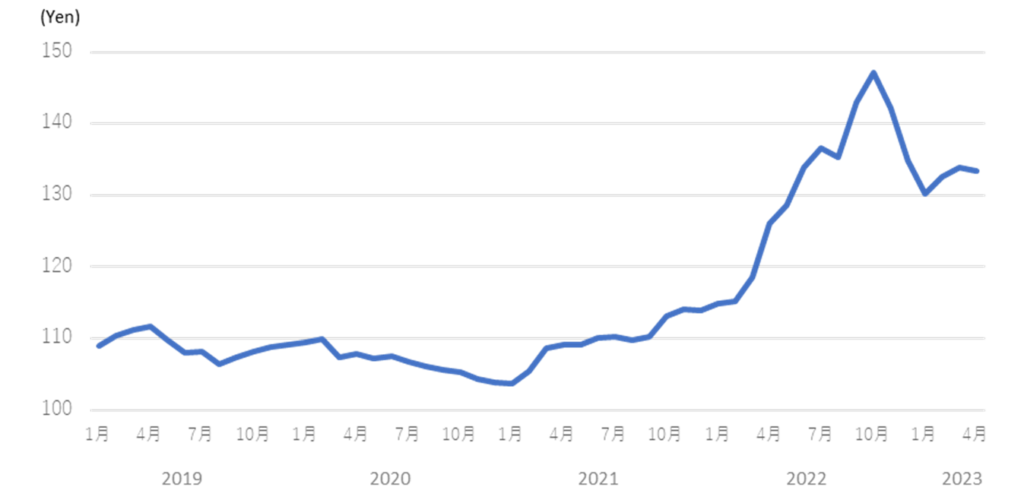
Source: Bank of Japan, Tokyo interbank quotes, monthly average.
◇ Forecast for FY12/2023: no change.
The company’s forecasts for 1H of FY12/2023 are sales of 5.2 billion yen (up 1.7% YoY), operating profit of 440 million yen (down 29.7%), ordinary profit of 490 million yen (down 21.0%) and net profit attributable to owner of parent of 330 million yen (down 19.0%). For the full year to FY12/2023, the company forecasts sales of 9.8 billion yen (up 2.6% YoY), operating profit of 0.6 billion yen (down 26.5%), ordinary profit of 0.66 billion yen (down 16.5%) and net profit attributable to owners of the parent company of 0.45 billion yen (down 13.0%). The company has kept these forecasts the same as of the end of 1Q.
The company views foreign exchange rates cautiously; the possibility of a significant correction to the yen appreciation is unlikely in the near term. On the other hand, there are expectations for a recovery in the 2H of FY2023 and beyond, considering the penetration of selling price increases, etc.
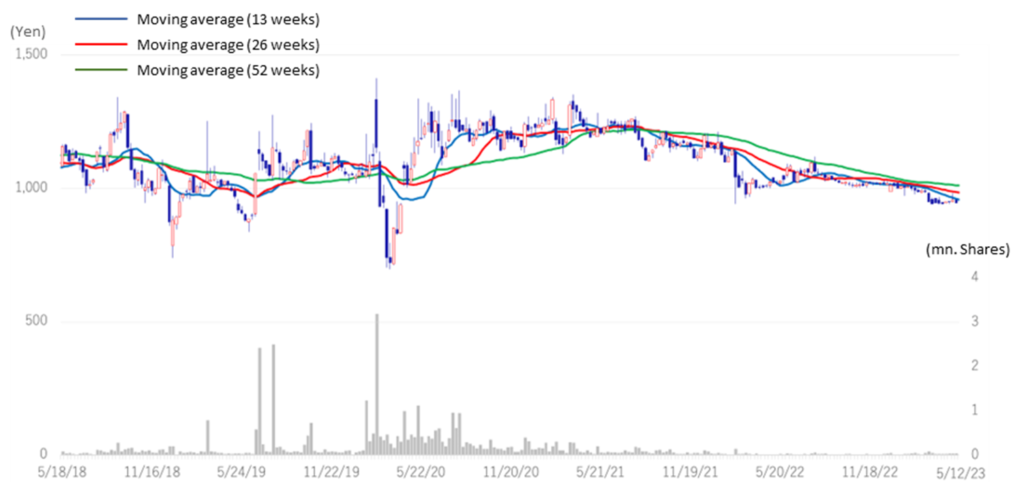
3386: 5-year stock price move
Share price compared to TOPIX (last three years)
Financial data
2020/12 |
2021/12 |
2022/12 |
2023/12 |
||||||||||
1Q |
2Q |
3Q |
4Q |
1Q |
2Q |
3Q |
4Q |
1Q |
2Q |
3Q |
4Q |
1Q |
|
[Statements of income] |
|||||||||||||
Net sales |
2,420 |
1,526 |
1,880 |
2,266 |
2,878 |
1,957 |
2,046 |
2,350 |
3,047 |
2,064 |
2,016 |
2,426 |
2,828 |
Year-on-year basis |
12.7% |
-7.3% |
4.4% |
13.6% |
18.9% |
28.2% |
8.8% |
3.7% |
5.9% |
5.5% |
-1.5% |
3.2% |
-7.2% |
Research reagent |
1 |
1 |
0 |
1 |
103 |
0 |
0 |
0 |
2,355 |
1,609 |
1,566 |
1,835 |
2,223 |
Equipment |
661 |
427 |
424 |
574 |
589 |
||||||||
Clinical diagnostic reagent |
90 |
82 |
138 |
168 |
143 |
138 |
157 |
171 |
29 |
29 |
26 |
17 |
16 |
Cost of sales |
1,486 |
930 |
1,123 |
1,401 |
1,736 |
1,157 |
1,242 |
1,437 |
1,886 |
1,345 |
1,305 |
1,576 |
1,789 |
Gross profit |
934 |
595 |
757 |
866 |
1,142 |
800 |
803 |
913 |
1,160 |
719 |
712 |
849 |
1,039 |
Gross profit margin |
38.6% |
39.0% |
40.3% |
38.2% |
39.7% |
40.9% |
39.2% |
38.9% |
38.1% |
34.8% |
35.3% |
35.0% |
36.7% |
SG&A expenses |
586 |
512 |
572 |
729 |
593 |
632 |
625 |
759 |
581 |
672 |
635 |
736 |
638 |
Operating profit |
347 |
84 |
185 |
136 |
549 |
167 |
179 |
153 |
578 |
48 |
77 |
113 |
400 |
Year-on-year basis |
53.5% |
460.0% |
62.3% |
172.0% |
58.2% |
98.8% |
-3.2% |
12.5% |
5.3% |
-71.3% |
-57.0% |
-26.1% |
-30.7% |
Operating profit margin |
14.3% |
5.5% |
9.8% |
6.0% |
19.1% |
8.5% |
8.7% |
6.5% |
19.0% |
2.3% |
3.8% |
4.7% |
14.1% |
Non-operating profit |
8 |
43 |
9 |
11 |
7 |
42 |
9 |
13 |
6 |
27 |
11 |
13 |
16 |
Non-operating expenses |
0 |
0 |
0 |
6 |
22 |
-8 |
2 |
4 |
20 |
19 |
18 |
26 |
0 |
Ordinary Profit |
355 |
127 |
194 |
141 |
534 |
218 |
185 |
162 |
565 |
55 |
70 |
100 |
416 |
Extraordinary profit |
|
|
0 |
0 |
|
|
|
|
|
|
|
|
|
Extraordinary expenses |
|
|
0 |
0 |
|
|
|
|
|
|
|
|
|
Income before income taxes |
355 |
318 |
194 |
141 |
534 |
218 |
185 |
162 |
565 |
55 |
70 |
100 |
416 |
Total income taxes |
114 |
98 |
60 |
35 |
184 |
55 |
58 |
34 |
179 |
15 |
19 |
25 |
137 |
Net profit |
232 |
218 |
125 |
99 |
333 |
157 |
125 |
122 |
366 |
41 |
47 |
63 |
264 |
Year-on-year basis |
57.8% |
581.3% |
56.3% |
-550.0% |
43.5% |
-28.0% |
0.0% |
23.2% |
9.9% |
-73.9% |
-62.4% |
-48.4% |
-27.8% |
Net profit ratio |
9.6% |
14.3% |
6.6% |
4.4% |
11.6% |
8.0% |
6.1% |
5.2% |
12.0% |
2.0% |
2.3% |
2.6% |
9.3% |
[Balance Sheets] |
|||||||||||||
Current assets |
6,315 |
6,300 |
6,383 |
6,756 |
6,975 |
6,797 |
6,983 |
7,310 |
7,754 |
7,409 |
7,089 |
7,136 |
7,558 |
cash and deposits |
2,407 |
3,171 |
3,251 |
3,159 |
2,702 |
3,235 |
3,147 |
3,255 |
2,994 |
3,370 |
3,347 |
3,036 |
2,926 |
Accounts receivable |
2,911 |
2,033 |
2,188 |
2,784 |
3,262 |
2,431 |
2,434 |
2,714 |
3,390 |
2,567 |
2,436 |
2,799 |
3,332 |
Goods and products |
721 |
861 |
804 |
572 |
551 |
742 |
804 |
805 |
900 |
1,054 |
1,077 |
1,055 |
981 |
Non-current assets |
2,980 |
3,003 |
3,039 |
2,883 |
2,957 |
2,838 |
2,789 |
2,761 |
2,801 |
2,905 |
3,009 |
3,176 |
3,136 |
Property, plant and equipment |
689 |
673 |
649 |
636 |
624 |
606 |
593 |
599 |
591 |
586 |
583 |
577 |
578 |
Investments and other assets |
2,101 |
2,157 |
2,224 |
2,081 |
2,168 |
2,037 |
1,998 |
1,979 |
2,038 |
2,149 |
2,269 |
2,428 |
2,391 |
Total assets |
9,295 |
9,304 |
9,422 |
9,640 |
9,933 |
9,635 |
9,773 |
10,072 |
10,556 |
10,315 |
10,098 |
10,313 |
10,695 |
Current liabilities |
1,158 |
976 |
1,057 |
1,226 |
1,327 |
1,015 |
915 |
1,093 |
1,450 |
1,131 |
927 |
1,038 |
1,203 |
Short-term borrowings |
142 |
199 |
199 |
180 |
180 |
190 |
199 |
183 |
183 |
188 |
188 |
184 |
|
Non-current liabilities |
600 |
593 |
570 |
552 |
609 |
597 |
654 |
658 |
632 |
632 |
639 |
656 |
663 |
Total liabilities |
1,758 |
1,569 |
1,628 |
1,779 |
1,937 |
1,613 |
1,570 |
1,752 |
2,083 |
1,763 |
1,566 |
1,695 |
1,866 |
Total net assets |
7,537 |
7,734 |
7,794 |
7,861 |
7,996 |
8,022 |
8,203 |
8,319 |
8,473 |
8,552 |
8,531 |
8,617 |
8,828 |
Shareholders’ equity |
7,052 |
7,247 |
7,299 |
7,358 |
7,479 |
7,499 |
7,678 |
7,787 |
7,924 |
8,004 |
7,979 |
8,052 |
8,250 |
Share capital |
918 |
918 |
918 |
918 |
918 |
918 |
918 |
918 |
918 |
918 |
918 |
918 |
918 |
Capital surplus |
1,251 |
1,251 |
1,251 |
1,251 |
1,251 |
1,252 |
1,258 |
1,258 |
1,258 |
1,260 |
1,260 |
1,260 |
1,260 |
Retained earnings |
4,366 |
4,584 |
4,662 |
4,761 |
4,940 |
5,097 |
5,153 |
5,274 |
5,502 |
5,543 |
5,496 |
5,560 |
5,708 |
Treasury shares |
-67 |
-67 |
-67 |
-67 |
-207 |
-251 |
-239 |
-239 |
-239 |
-216 |
-216 |
-216 |
-216 |
Accumulated other comprehensive income |
582 |
560 |
533 |
494 |
575 |
483 |
586 |
574 |
484 |
498 |
520 |
530 |
580 |
Non-controlling interests |
485 |
487 |
495 |
503 |
517 |
523 |
525 |
532 |
549 |
548 |
552 |
565 |
578 |
Total liabilities and net assets |
9,295 |
9,304 |
9,422 |
9,640 |
9,933 |
9,635 |
9,773 |
10,072 |
10,556 |
10,315 |
10,098 |
10,313 |
10,695 |
Shareholders’ equity ratio |
75.9% |
77.9% |
77.5% |
76.3% |
75.3% |
77.8% |
78.6% |
77.3% |
75.1% |
77.6% |
79.0% |
78.1% |
77.1% |
[Statements of cash flows] |
|||||||||||||
Cash flow from operating activities |
735 |
803 |
600 |
648 |
480 |
284 |
|||||||
Cash flow from investing activities |
70 |
42 |
-187 |
-145 |
-260 |
-291 |
|||||||
Cash flow from financing activities |
-49 |
-97 |
-343 |
-420 |
-142 |
-236 |
|||||||
Net increase in cash and cash equiv. |
755 |
743 |
76 |
95 |
115 |
-218 |
|||||||
Cash and cash equiv. at beginning of period |
2,416 |
2,416 |
3,159 |
3,159 |
3,255 |
3,255 |
|||||||
Cash and cash equiv. at end of period |
3,171 |
3,159 |
3,235 |
3,255 |
3,370 |
3,036 |
|||||||
Note: For the cash flow statement, the figures for 2Q are the cumulative totals for 1Q-2Q. The figures for 4Q are the cumulative totals for 1Q-4Q. Therefore, the opening balances are also those of the previous 4Q.
Source: Omega Investment from company materials