2026-07-15
Home
Japanese

Omega Investment Co., Ltd.
Chiome Bioscience (Company note – 1Q update)

| Share price (5/31) | ¥204 | Dividend Yield (23/12 CE) | – % |
| 52weeks high/low | ¥261/135 | ROE(TTM) | -67.48 % |
| Avg Vol (3 month) | 1,234 thou shrs | Operating margin (TTM) | -199.53 % |
| Market Cap | ¥9.8 bn | Beta (5Y Monthly) | 1.87 |
| Enterprise Value | ¥8.6 bn | Shares Outstanding | 48.503 mn shrs |
| PER (23/12 CE) | – X | Listed market | TSE Growth |
| PBR (22/12 act) | 6.38 X |
| Click here for the PDF version of this page |
| PDF Version |
Sales increased and operating losses reduced as Drug Discovery Support Business grew.
The company extends its development plan to maximise the value of CBA-1205 for out-licensing.
◇Summary of 1Q results of FY12/2023.
Chiome Bioscience’s 1Q results for FY12/2023 showed a 30% YoY increase in sales and a smaller operating loss due to strong sales of Drug Discovery Support Business. In the company’s main business, Drug Discovery and Development Business, positive news was announced in the lead-up to the out-licensing of CBA-1205, including confirmation of partial response in the second part of Phase 1 clinical trial. The company intends to continue with further clinical development to increase the product’s value at the time of out-licensing.
The company’s share price has been on an upward trend since bottoming out at 136 yen on 28 September 2022. The day after the 1Q results announcement (12 May), it rose 12.4%. Although it is difficult for a drug discovery company to produce results in a short period, this can be regarded as the investor appreciation of the progress of clinical trials and the positive signs being made. The company is continuing its sales activities, intending to conclude a licensing agreement with the possibility of an upfront payment. We are interested to see the progress of the drug discovery pipeline.
◇Results for 1Q FY12/2023: 30% increase in Drug Discovery Support Business sales.
The company’s 1Q results for FY12/2023 were sales of 169 million yen (+31.8% YoY), an operating loss of 225 million yen (vs an operating loss of 486 million yen in the previous year) and a net loss of 227 million yen (vs. a net loss of 492 million yen in the last year). In this 1Q, sales related to Drug Discovery and Development Business, such as upfront licensing payments and milestone income, were not recorded, and only sales from Drug Discovery Support Business were recorded. This business is growing steadily.
For information on the progress of each pipeline in Drug Discovery and Development Business, see the diagram on the next page. Each pipeline progresses well, but no sales were recorded during 1Q FY12/2023. Progress in clinical development led to recording of R&D costs of 193 million yen, a decrease of 252 million yen YoY because of lower CMC costs. Consequently, the segment loss for the business was 193 million yen, corresponding to R&D costs.
Drug Discovery Support Business provides contract antibody production, antibody affinity enhancement and protein preparation services using the company’s antibody production technology platform, centred on the ADLib® system, which is the company’s proprietary antibody generation method, and provides research support to major domestic pharmaceutical companies in relation to antibody drugs. The stable revenue generated by Drug Discovery Support Business helps to secure research and development expenditure for Drug Discovery and Development Business. The business is steadily increasing the number of transactions and projects, with sales in 1Q FY12/2023 amounting to 169 million yen (+40 million yen YoY) and segment profit to 95 million yen (+25 million yen). The segment profit margin was 56.6%, meeting the company target of 50%.
In BS, total assets at end-March 2023 amounted to 2,085 million yen. This is a decrease of 129 million yen compared to end-December 2022. Cash and deposits amounted to 1,566 million yen (end-December 2022: 1,727 million yen). Generally, there is no significant change from the end of FY12/2022.
| JPY, mn, % | Net sales |
YoY % |
Oper. profit |
YoY % |
Ord. profit |
YoY % |
Profit ATOP |
YoY % |
EPS (¥) |
| 2019/12 | 447 | 110.3 | -1,401 | – | -1,410 | – | -1,403 | – | -44.61 |
| 2020/12 | 480 | 7.4 | -1,283 | – | -1,291 | – | -1,293 | – | -36.06 |
| 2021/12 | 712 | 48.3 | -1,334 | – | -1,329 | – | -1,479 | – | -36.74 |
| 2022/12 | 630 | -11.5 | -1,258 | – | -1,243 | – | -1,242 | – | -28.26 |
| 2023/12(CE) | – | – | – | – | – | – | – | – | – |
| 2022/12 1Q | 128 | -47.8 | -486 | – | -491 | – | -492 | – | -11.66 |
| 2023/12 1Q | 169 | 31.8 | -225 | – | -227 | – | -227 | – | -4.70 |
Note: The company discloses only the estimates for the Drug Discovery Support business (sales of 640 million yen), as it is difficult to make reasonable forecasts for the drug discovery and development business.
Drug discovery and development business – pipeline
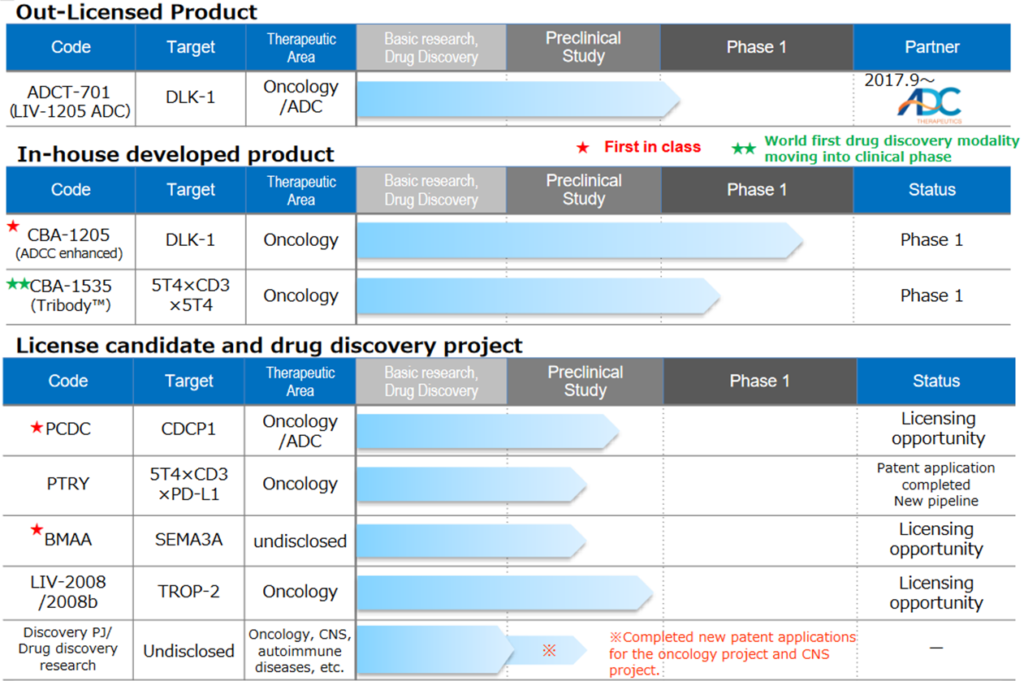
As of May. 11, 2023
Source: Supplementary financial data for 1Q of FY12/2023 (dated 11 May 2023).
◇Progress in the pipeline: The company extends the development plan to maximise the value of CBA-1205 for out-licensing.
<In-house developed products>.
*CBA–1205; Phase 1 clinical trial shows positive signs. The development plan is to be altered.
CBA-1205 is being tested in the first part of Phase 1 clinical trial in patients with solid tumours at the National Cancer Centre. The second part of the study is conducted in patients with hepatocellular carcinoma. The first part of the study has already shown a high safety profile, and the melanoma patients enrolled in the study have continued to receive the drug for more than 18 months with SD (stable) evaluation with tumour shrinkage, which is still ongoing.
In addition, PR (partial response: tumour reduction of 30% or more) was confirmed in one patient with hepatocellular carcinoma enrolled in the latter part of the study. It was decided to manufacture an additional investigational drug for long-term treatment cases. In addition, it was decided to tighten the selection criteria for patients enrolled in the trial and extend the trial period to analyse the scientific relationship between PR cases and the drug’s administration to verify the drug’s potential as a therapeutic agent. However, the out-licensing schedule remains the same.
CBA-1205 Clinical development
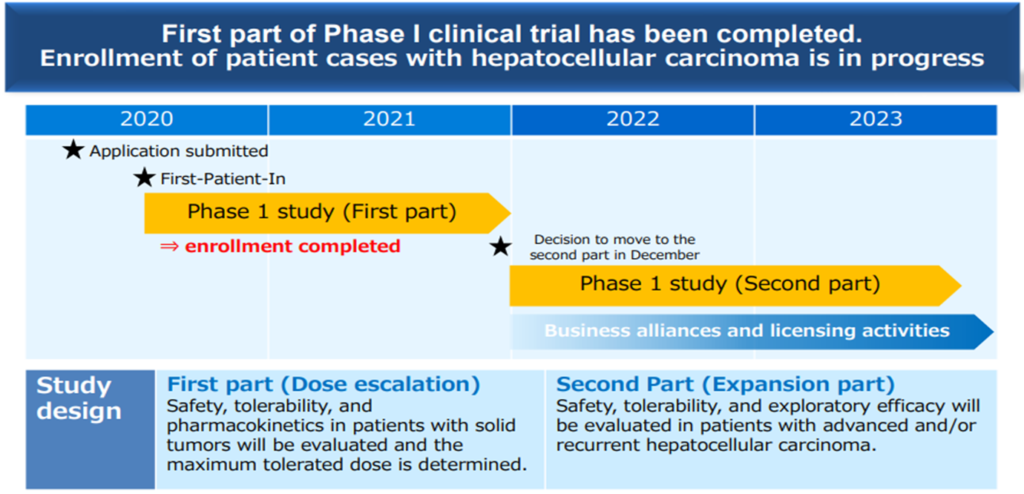
Source: Supplementary financial data for 1Q of FY12/2023 (dated 11 May 2023).
*CBA–1535;First half of Phase I clinical trials (single agent)
The company submitted a clinical trial plan notification to the PMDA in February 2022. It started Phase I clinical trials at the National Cancer Centre Hospital and Shizuoka Cancer Centre from the end of June. In the first half of Phase I clinical trial, safety and efficacy signals were evaluated in patients with solid tumours. The drug will be administered in stages, starting from a low volume to find the maximum dose that can be safely administered and to assess the initial drug effect signal. The second part will assess efficient drug efficacy with immuno-oncology drugs. The first part is scheduled to continue until the first half of 2024. The second part will be conducted in parallel starting in mid-2023, with a development plan to confirm safety and efficacy as quickly as possible.
CBA-1535 is the world’s first clinical trial for TribodyTM and, if the concept is confirmed, will expand the applicability of TribodyTM to many cancer antigens . Combining the number of binding targets and the number of moves to which they bind is expected to provide benefits beyond conventional antibodies. Through the combined administration of multiple drugs, multiple medicinal effects can be expected from administering only one drug, which is expected to improve a patient’s quality of life and provide health economics benefits.
<Out-licenced products>
*LIV-1205;Licensed to ADC Therapeutics, Switzerland, for ADC use only; ADCT, in collaboration with the National Cancer Institute (NCI), is preparing for a clinical trial in neuroblastoma, with a Phase 1 clinical entry trial scheduled to start during 2023. Given ADCT’s financial situation, NCI will be the lead developer for the trial.
<Out-licensing candidates>
*PCDC;Promoting licensing activities focusing on ADC applications and accumulating animal test data. At national and international conferences, the company contacts pharmaceutical companies that want to expand their pipelines as ADCs and pharmaceutical companies that want antibodies for ADCs with their own ADC technology as their out-licensing strategy and target.
*PTRY;A new pipeline. Creation of highly active TribodyTM antibodies by new molecule combination. The new pipeline of PTRY targeting 5T4xCD3xPD-L1. Results of joint research on cancer immunotherapy conducted with the Italian public research institute Ceinge-Biotechnologie Avanzate were published in the Journal of Experimental & Clinical Cancer Research, an international journal. A patent application has been completed for the results obtained through this collaboration. In vivo efficacy data in lung cancer models have confirmed that it exerts a strong tumour growth inhibitory effect.
◇Progress in Drug Discovery Support Business: New master service agreements signed with major Japanese pharmaceutical companies.
Drug Discovery Support Business recorded a 30% YoY increase in sales to 169 million yen in 1Q. The company has gained a high reputation for its technical service capabilities among major Japanese pharmaceutical companies, and business with existing customers has steadily increased. In addition, the company signed a new master service contract with a major domestic pharmaceutical company, although the specific name of the company is not disclosed. The company has also started spot transactions with new clients.
◇Forecasts for FY12/2023: Unchanged.
For FY12/2023, the company has announced sales of 640 million yen only for Drug Discovery Support Business, which is expected to generate constant revenues. In terms of costs, R&D investment will continue to be in the region of 1 billion yen per year, as clinical trial and investigational drug manufacturing costs will increase in line with the progress of each pipeline as in the past. Drug Discovery and Development Business will likely record losses if it receives no upfront licensing payments or other income. At the time of the 1Q results announcement, there was no revision to the full-year forecast.
◇Stock price: Watch for future pipeline value enhancement and the possibility of upfront licensing payments.
The company’s share price bottomed out at 136 yen on 28 September 2022 and began to trend upwards. The day after the announcement of the 1Q results for FY2023/3 (12 May), it recorded a significant 12.4% increase over the previous day. This was presumably because of the announcement of the start of business with a new customer in Drug Discovery Support Business and positive news on the CBA-1205 clinical trial. The company plans to maximise the upfront payment for the out-licensing of CBA-1205 by gaining multiple cases and increasing its economic value. R&D is progressing well in other drug discovery pipelines, and the economic value of the company’s overall pipeline is also expected to increase steadily. In addition to R&D activities and clinical trials, the company is also actively engaged in sales activities for out-licensing. We expect the company to receive an upfront payment in the not-too-distant future and remain interested in monitoring future developments.
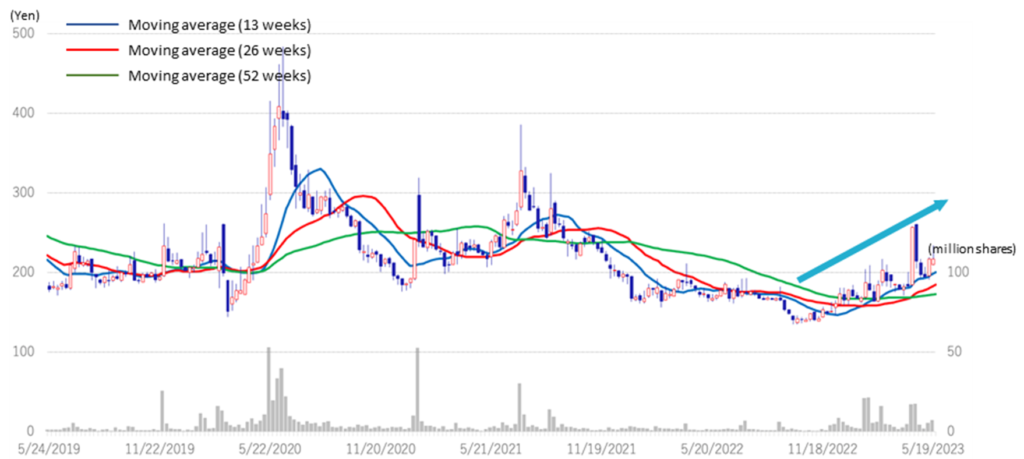
Stock price (4 years)
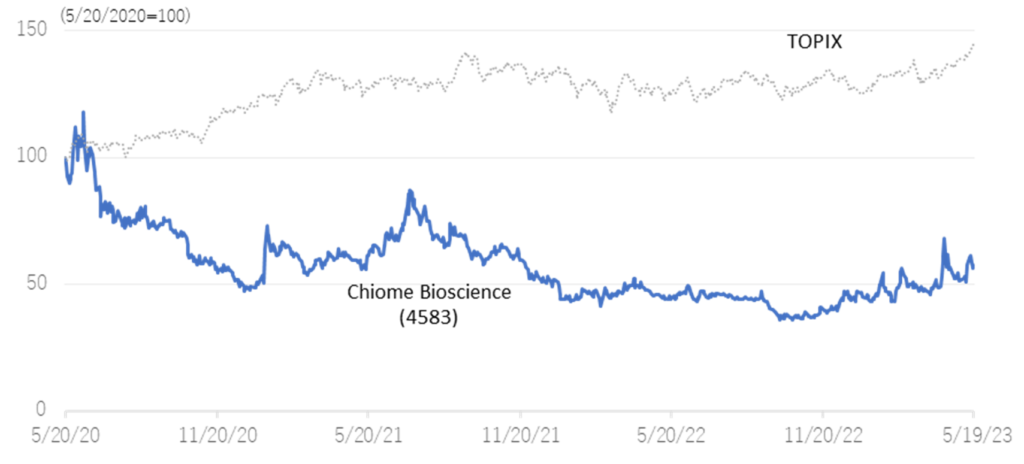
Relative chart; Chiome Bioscience (4583) and TOPIX (3 years)
Financial data
| FY (¥mn) | 2020/12 | 2021/12 | 2022/12 | 2023/12 | |||||||||
| 1Q | 2Q | 3Q | 4Q | 1Q | 2Q | 3Q | 4Q | 1Q | 2Q | 3Q | 4Q | 1Q | |
| [Statements of income] | |||||||||||||
| Net sales | 91 | 82 | 139 | 169 | 246 | 139 | 157 | 171 | 128 | 149 | 156 | 197 | 169 |
| Drug Discovery and Development Business | 1 | 1 | 0 | 1 | 103 | 0 | 0 | 0 | 0 | 0 | 0 | 0 | 0 |
| Drug Discovery Support Business | 90 | 82 | 138 | 168 | 143 | 138 | 157 | 171 | 128 | 149 | 156 | 197 | 169 |
| Cost of sales | 61 | 46 | 59 | 70 | 64 | 62 | 78 | 86 | 57 | 69 | 72 | 83 | 73 |
| Gross profit | 30 | 36 | 80 | 99 | 182 | 77 | 79 | 84 | 70 | 80 | 84 | 114 | 95 |
| SG&A expenses | 456 | 346 | 424 | 303 | 337 | 337 | 515 | 568 | 557 | 373 | 344 | 334 | 321 |
| R&D expenses | 343 | 266 | 342 | 206 | 216 | 243 | 401 | 451 | 446 | 245 | 225 | 219 | 193 |
| Operating profit | -426 | -310 | -344 | -204 | -155 | -260 | -436 | -483 | -486 | -292 | -260 | -220 | -225 |
| Non-operating income | 2 | 0 | 3 | 0 | 7 | 0 | 2 | 4 | 0 | 16 | 0 | 5 | 0 |
| Non-operating expenses | 0 | 2 | 10 | 1 | 1 | 0 | 1 | 6 | 4 | 1 | 1 | -1 | 1 |
| Ordinary profit | -425 | -311 | -351 | -205 | -150 | -259 | -434 | -486 | -491 | -278 | -261 | -214 | -227 |
| Extraordinary income | 0 | 0 | 0 | 6 | 0 | 1 | |||||||
| Extraordinary expenses | |||||||||||||
| Loss before income taxes | -425 | -310 | -351 | -205 | -149 | -247 | -433 | -636 | -491 | -278 | -255 | -214 | -226 |
| Total income taxes | 1 | 0 | 1 | 1 | 11 | 1 | 1 | 0 | 1 | 2 | 1 | 1 | 1 |
| Net income | -425 | -311 | -352 | -206 | -161 | -248 | -434 | -637 | -492 | -279 | -257 | -215 | -227 |
| [Balance Sheets] | |||||||||||||
| Current assets | 2,309 | 2,805 | 3,316 | 3,249 | 3,294 | 3,088 | 2,675 | 2,216 | 2,005 | 1,792 | 1,955 | 2,092 | 1,964 |
| Cash and deposits | 1,967 | 2,472 | 2,881 | 2,686 | 2,580 | 2,302 | 2,071 | 1,790 | 1,744 | 1,471 | 1,592 | 1,727 | 1,566 |
| Non-current assets | 247 | 249 | 249 | 246 | 244 | 241 | 274 | 122 | 121 | 128 | 126 | 123 | 120 |
| Tangible assets | 10 | 9 | 8 | 7 | 6 | 6 | 4 | 4 | 3 | 3 | 2 | 2 | 2 |
| Investments and other assets | 237 | 240 | 241 | 238 | 237 | 235 | 269 | 118 | 117 | 124 | 122 | 120 | 118 |
| Total assets | 2,556 | 3,054 | 3,566 | 3,495 | 3,537 | 3,329 | 2,950 | 2,339 | 2,126 | 1,920 | 2,081 | 2,215 | 2,085 |
| Current liabilities | 315 | 427 | 378 | 343 | 378 | 428 | 468 | 392 | 419 | 390 | 376 | 370 | 469 |
| Short-term borrowings | 142 | 199 | 199 | 180 | 180 | 190 | 199 | 183 | 183 | 188 | 188 | 184 | 304 |
| Non-current liabilities | 42 | 42 | 42 | 42 | 42 | 42 | 53 | 53 | 53 | 54 | 54 | 54 | 54 |
| Total liabilities | 357 | 469 | 420 | 385 | 420 | 470 | 522 | 446 | 473 | 444 | 431 | 424 | 523 |
| Total net assets | 2,199 | 2,585 | 3,146 | 3,110 | 3,118 | 2,859 | 2,428 | 1,893 | 1,653 | 1,476 | 1,650 | 1,790 | 1,562 |
| Total shareholders’ equity | 2,199 | 2,585 | 3,146 | 3,110 | 3,118 | 2,859 | 2,428 | 1,857 | 1,621 | 1,445 | 1,631 | 1,777 | 1,549 |
| Capital stock | 6,133 | 846 | 1,303 | 1,388 | 1,471 | 1,471 | 1,472 | 1,515 | 1,642 | 1,695 | 1,916 | 2,097 | 2,097 |
| Legal capital reserve | 6,123 | 2,446 | 2,903 | 2,987 | 3,071 | 3,071 | 3,072 | 3,115 | 3,242 | 3,295 | 3,516 | 3,696 | 3,696 |
| Retained earnings | -10,080 | -736 | -1,088 | -1,294 | -1,455 | -1,703 | -2,136 | -2,773 | -3,262 | -3,544 | -3,801 | -4,016 | 4,244 |
| Subscription rights to shares | 24 | 30 | 28 | 29 | 30 | 19 | 19 | 35 | 31 | 30 | 18 | 13 | 12 |
| Total liabilities and net assets | 2,556 | 3,054 | 3,566 | 3,495 | 3,537 | 3,329 | 2,950 | 2,339 | 2,126 | 1,920 | 2,081 | 2,215 | 2,085 |
| [Statements of cash flows] | |||||||||||||
| Cash flow from operating activities | -528 | -1,361 | -560 | -1,131 | -660 | -1,191 | |||||||
| Loss before income taxes | -734 | -1,290 | -396 | -1,466 | -768 | -1,237 | |||||||
| Cash flow from investing activities | – | 3 | – | -35 | – | – | |||||||
| Purchase of investment securities | – | – | – | – | – | – | |||||||
| Cash flow from financing activities | 894 | 1,944 | 176 | 271 | 341 | 1,127 | |||||||
| Proceeds from issuance of common shares | 697 | 1,769 | 166 | 253 | 336 | 1,126 | |||||||
| Net increase in cash and cash equiv. | 366 | 580 | -384 | -895 | -319 | -63 | |||||||
| Cash and cash equiv. at beginning of period | 2,105 | 2,105 | 2,686 | 2,686 | 1,790 | 1,790 | |||||||
| Cash and cash equiv. at end of period | 2,472 | 2,686 | 2,301 | 1,790 | 1,471 | 1,727 | |||||||
Note) For the cash flow statement, Q2 is the cumulative of Q1 to Q2, and Q4 is the cumulative of Q1 to Q4. Therefore, the beginning balance will be the beginning balance of Q4 for both Q2 and Q4.
Source: Omega Investment from Company materials.