2026-07-27
Home
Japanese

Omega Investment Co., Ltd.
Digital Hearts Holdings (Company note Q4 update)

| Share price (6/15) | ¥1,303 | Dividend Yield (24/3 CE) | 1.61 % |
| 52weeks high/low | ¥2,053 / 1,235 | ROE(23/3) | 10.1 % |
| Avg Vol (3 month) | 84.5 thou shrs | Operating margin (23/3) | 8.22 % |
| Market Cap | ¥31.1 bn | Beta (5Y Monthly) | 0.89 |
| Enterprise Value | ¥28.2 bn | Shares Outstanding | 23.890 mn shrs |
| PER (24/3 CE) | 13.81 X | Listed market | TSE Prime section |
| PBR (23/3 act) | 3.29 X |
| Click here for the PDF version of this page |
| PDF Version |
Record sales and operating profit. Announced start of preparations for spin-off listing of AGEST, Inc.
◇ Summary of financial results: Record highs in sales and operating profit despite continued investment in growth.
Digital Hearts Holdings’ full-year results for FY2023/3 showed double-digit revenue growth, with both Enterprise Business and Entertainment Business performing well, achieving record revenues of 36.5 billion yen. Despite accelerated investment in growth in Enterprise Business, operating profit reached a record high of 3 billion, supported by robust Entertainment Business earnings. On the other hand, extraordinary losses, including impairment losses at subsidiaries, led to a 55% decline in net profit attributable to owners of the parent.
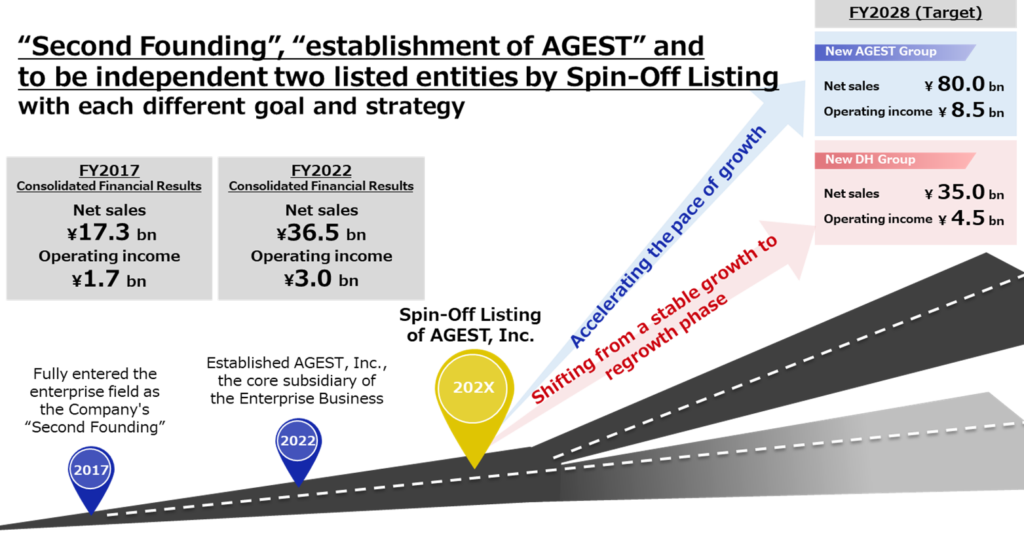
In conjunction with the disclosure of the current financial results, the company announced that it would start preparations for the spin-off listing of AGEST, Inc. By clarifying the business goals and strategies of Enterprise Business and Entertainment Business, the company aims to accelerate the growth of Enterprise Business further and to achieve the regrowth of the Entertainment Business. The new AGEST Group plans to target sales of 80 billion yen and an operating profit of 8.5 billion yen in FY2029/3. Meanwhile, the new Digital Hearts Holdings Group, responsible for Entertainment Business, targets 35 billion yen and 4.5 billion yen for the same period.
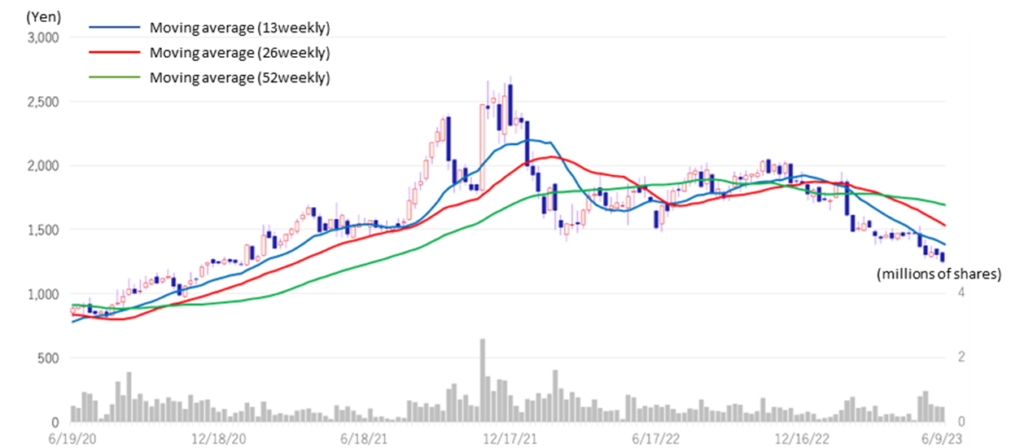
◇ Stock price trend: Adjustment continues.
The company’s share price fell by 9.8% on May 12, the day after the May 11 results announcement. The share price has been on a downward trend since then. In addition to the decline in the bottom-line profit, one reason is thought to be a concern that investors do not fully digest the impact of the spin-off listing of AGEST, Inc., a future growth pillar of the company. The actual spin-off listing is not expected take more than a year, but we would like to pay close attention to whether the company’s share price will be revalued as a result of the scheme and its benefits for investors.
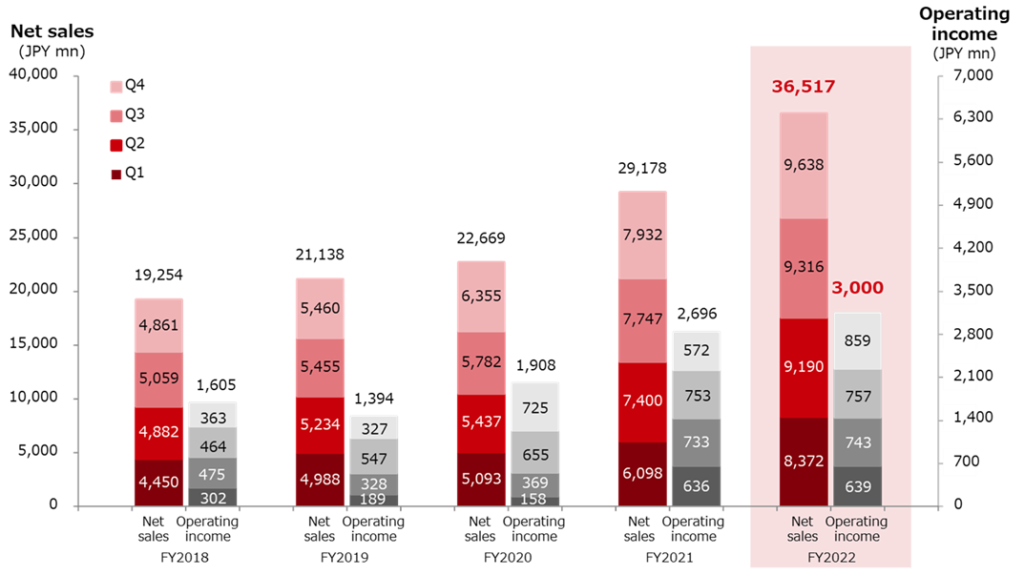
◇Full-year results for FY2023/3: Both businesses performed well and achieved record sales.
The company’s full-year results for FY2023/3 show that both Enterprise Business and Entertainment Business performed well, with double-digit revenue growth. Enterprise Business secured almost the same profit level as the previous year, despite strategic investments in AGEST. Meanwhile, Entertainment Business posted double-digit sales growth in Domestic debugging and Global and others, generating segment profit of 4.2 billion yen. As a result, sales rose to 36,517 million yen (+25.2%) and operating profit to 3,000 million yen (+11.3%), while EBITDA increased by 21.8% to 4,176 million.
On the other hand, the aftermath of the spread of COVID-19 in China and changes in the Chinese game market environment resulted in an impairment loss of goodwill of DIGITAL HEARTS CROSS Marketing and Solutions Limited (1,045 million yen). Together with losses on the transfer of businesses in other Asian regions, extraordinary losses of 1,231 million yen were recorded, resulting in a net profit attributable to owners of the parent of 799 million yen, a 55.0% decrease.
| JPY, mn, % | Net sales | YoY % |
Oper. profit |
YoY % |
Ord. profit |
YoY % |
Profit ATOP |
YoY % |
EPS (¥) |
DPS (¥) |
| 2019/3 | 19,254 | 11.0 | 1,605 | -7.5 | 1,651 | -7.4 | 1,575 | 31.3 | 72.13 | 13.00 |
| 2020/3 | 21,138 | 9.8 | 1,394 | -13.2 | 1,372 | -16.9 | 792 | -49.7 | 36.31 | 14.00 |
| 2021/3 | 22,669 | 7.2 | 1,908 | 36.9 | 1,975 | 43.9 | 974 | 23.0 | 45.15 | 14.00 |
| 2022/3 | 29,178 | 28.7 | 2,696 | 41.3 | 2,774 | 40.4 | 1,778 | 82.5 | 82.25 | 15.00 |
| 2023/3 | 36,517 | 25.2 | 3,000 | 11.3 | 3,152 | 13.6 | 799 | -55.0 | 36.50 | 21.00 |
| 2024/3 (CE) | 40,750 | 11.6 | 3,120 | 4.0 | 3,160 | 0.2 | 2,100 | 162.6 | 95.86 | 21.00 |
Full year consolidated sales / operating profit trend
Source: The company handout for the full year results for FY2023/3 (published on May 11, 2023)
An analysis of changes in EBITDA terms shows that an increase in gross profit from increased sales (877 million yen) and an improvement in gross profit margin (139 million yen) in Enterprise Business contributed to the results, while an increase in SG&A expenses (-952 million yen) due to strategic investments made mainly in AGEST was a negative factor. The impact of a newly consolidated subsidiary (218 million yen) was a positive factor. On the other hand, in Entertainment Business, an increase in gross profit from increased sales (604 million yen) and an improvement in the gross profit margin (99 million yen) were factors for improvement, while an increase in SG&A expenses (23 million yen) was a negative factor. The impact of a newly consolidated subsidiary (1 million yen) was a positive factor. Therefore, looking at the contribution of the increase in EBITDA of 964 million, excluding the negative contribution to the rise in company-wide common expenses, the contribution of EBITDA in Entertainment Business is significant at 70%. On the other hand, while Enterprise Business continues to invest in strengthening its business basement and future growth, the cash-generation capacity of this business has also grown significantly.
The annual dividend for FY2023/3 is 21.00 per share. The dividend payout ratio is 57.5%.
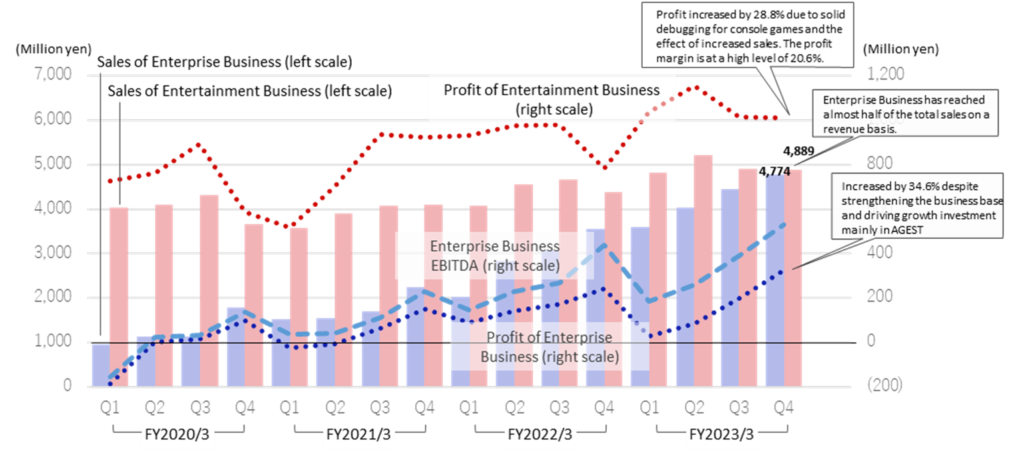
◇ Trends by segment: (see also graph on p. 3 and table on p. 7)
1) Enterprise Business: Sales: 16,840 million yen, +46.5%; operating profit: 639 million yen, -0.9%.
In addition to continued double-digit revenue growth in existing businesses, there was also the additional effect of the M&A conducted in the previous fiscal year, and the business as a whole achieved growth close to 50% YoY.
The company also accelerates strategic investment, centred on AGEST, Inc., which was formed as the core company of Enterprise Business following the group’s reorganisation in April 2022. AGEST led Enterprise Business as a whole and achieved sales growth exceeding the initial plan. While focusing on strengthening the business base and investing in growth, SG&A expenses have been controlled, with segment profit rising steadily from 29 million yen in Q1 (profit margin 0.8%) to 84 million yen in Q2 (2.1%), to 199 million yen in Q3 (4.5%), to 325 million yen in Q4 (record high, 6.8% on quarterly basis). Profit margins have also improved significantly. Enterprise Business secured almost the same operating profit level as the previous year for the full year, having made concentrated investments in growth in the first half of the year.
AGEST, Inc.’s KPIs include: the number of QA engineers from 361 at the end of FY2022/3 to 508 at the end of FY2023/3; the number of clients for which orders were received from 475 at the end of FY2022/3 to 558 at the end of FY2023/3; and AGEST’s non-consolidated sales increased 23% from 7.5 billion yen in FY2022/3 to 9.2 billion yen in FY2023/3. AGEST has achieved high growth in its first year of operation.
Trends in the sub-segments are as follows.
QA Solution: Sales: 10,480 million yen (+52.7%). Continued strong growth mainly in Japan, with the recent DX trend as a tailwind, existing business excluding M&A achieving a significant increase in sales, up 34.3% on the previous year. The cross-selling pursued in recent years continues to be strengthened, and the scale of transactions per company is also expanding. In addition, the succession of the QA business from Sobal Corporation in Q2 contributed to the increase in the number of test engineers, and services that utilise specialist knowledge, such as mutation testing, are also being expanded.
As a result, QA solution sales increased by more than double digits in QoQ, from 2,102 million yen in Q1 to 2,481 million yen in Q2, to 2,730 million yen in Q3, to 3,165 million yen in Q4. The gross profit margin in Q4 was again at a high level of around 35%, although the gross profit margin temporarily declined in Q3 due to deteriorating earnings at overseas subsidiaries.
Sales/Profit by Segment (Quarterly basis)
Source: Omega Investment, based on company data.
QA solution’s KPIs include the number of customers receiving orders: 748 at the end of FY 2022/3 → 808 at the end of FY 2023/3; annual sales per client: 10 million yen at the end of FY 2022/3 → 13 million yen at the end of FY 2023/3; the number of engineers: 924 at the end of FY 2022/3 → 1,009 at the end of FY 2023/3; sales ratio of advanced testing and next-generation QA was 28.9% at the end of FY 2022/3 → 34.9% at the end of FY2023/3, showing steady expansion and growth.
IT services and others: Sales: 6,360 million yen (+37.4%). The business base is expanding steadily, with the number of registered engineers at identity Inc., which became a subsidiary in June 2021, reaching 27,000. Security monitoring services are also growing steadily against the backdrop of the introduction of remote working following the spread of COVID-19.
2) Entertainment Business: Sales: 19,815 million yen, up 12.0%; operating profit: 4,214 million yen, up 14.9%.
The booming console games market and accelerated overseas expansion of game content ensured the company captured increasing demand. Sales of both Domestic debugging and Global and others increased by more than 10%. Segment profit increased by 14.9% due to higher Domestic debugging sales and improved gross margins. The profit margin remained high at 21.3%.
Domestic debugging: Sales: 13,386 million yen (+10.4%). The development of new titles in the console game market has become more active. The company received orders for a number of new major titles, and sales to consoles increased significantly, up around 1.4 times on the previous year. Following a busy first half of the year, high sales levels continued in the second half, with a high gross profit margin of over 30%. In response to inflation, the company plans to increase hourly wages from April 2023 and focus on securing excellent human resources, aiming to strengthen service quality and increase the unit price per order.
Global and others: Sales: 6,429 million yen (+15.6%). Although the outlook for the Chinese market is becoming uncertain due to the response to COVID-19 and gaming regulations in China, the company focused on further strengthening its global solutions capabilities such as human resources for marketing in Korea and localization services for the US and Europe. The company achieved revenue growth in all services by promoting cross-selling to existing major customers and expanding the number of languages for localisation service.
◇ Forecast for FY2024/3: Sales 40.75 billion yen, operating profit 3.12 billion yen.
The company plans to achieve record sales and operating profit in FY2024/3, driven by Enterprise Business. Sales of 40.75 billion yen, up 11.6%, comprise Enterprise Business sales of 20.65 billion yen, up 22.6%, and Entertainment Business sales of 20.1 billion yen, up 1.4%, with Enterprise Business sales expected to exceed Entertainment Business sales for the first time.
Meanwhile, operating profit is expected to increase to 3.12 billion yen, up 4.0%, for the fourth consecutive year. (The forecast incorporates 250 million yen in preparation costs for the spin-off listing of AGEST, Inc., and if these costs are excluded, operating profit is expected to increase by 12.3%.)
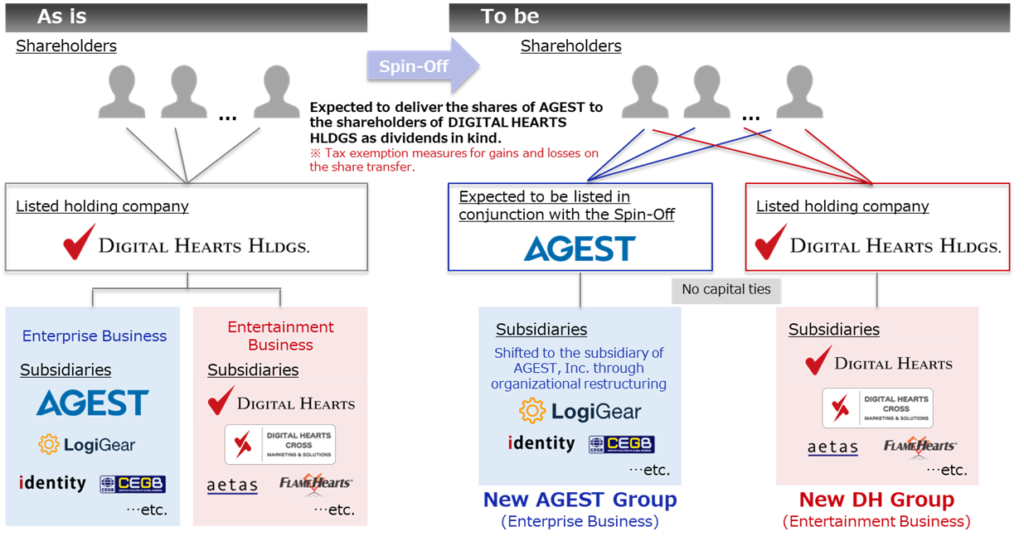
◇ Spin-off listing project of AGEST
In conjunction with disclosing its financial results for FY2023/3, the company announced that it had started preparations for the share-distribution-type spin-off and preparations for listing of AGEST, Inc. The company entered Enterprise Business in earnest as a Second Founding in 2017. Initially, upfront investment weighed on the earnings, but in recent years sales have built up to a level comparable to Entertainment Business, and profitability has also become more established. In April 2022, following a group reorganization, Enterprise Business shifted to an organisational structure centred on the core company AGEST, Inc. The spin-off listing marks the group’s entry into a new growth stage.
The company’s growth image after AGEST’s spin-off listing is shown in the diagram below. Enterprise Business will accelerate its business expansion and investment in growth to become the leading QA solution provider in the global market with the leading-edge quality technology. Meanwhile, Entertainment Business, which already occupies a dominant position as one of the major players in the domestic market, plans to grow as the Global Quality Partner in the Entertainment Industry by developing non-gaming fields and new technology-related fields in Japan, as well as by expanding global business with a view to Asia, Europe and the US.
Image of the spin-off listing of AGEST
Source: The company handout for the full year results for FY2023/3 (published on May 11, 2023)
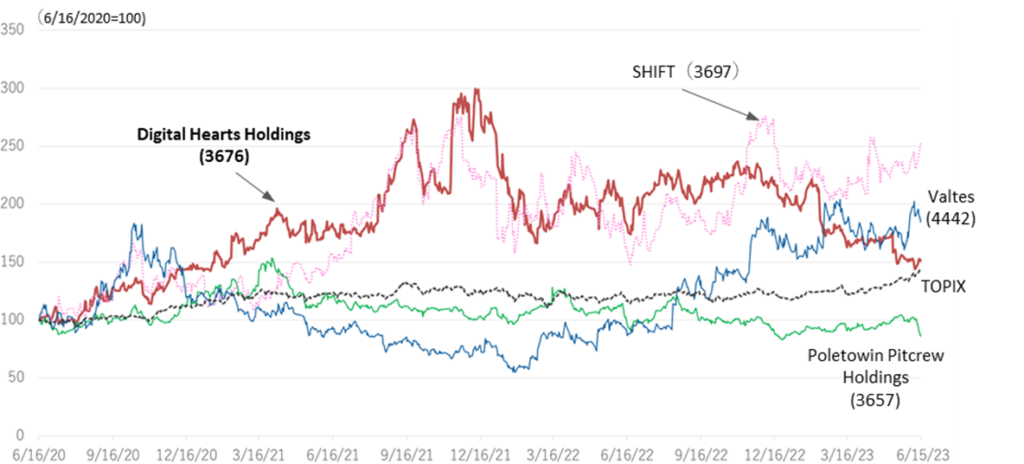
The table on the following page lists the latest developments of the four major software testing companies. As expected, the two companies that specialise, or are close to specialising, in enterprise business are superior in growth, profitability and share price performance and are highly regarded in the market.
In this context, if the spin-off of AGEST, Inc. further accelerates the AGEST Group’s growth, and if it is valued in the enterprise business valuation, it is expected to further increase the corporate value of the Group as a whole.
Performance comparison of four software testing companies
| Code | 3676 | 3657 | 3697 | 4442 | |
| Company name | Digital Hearts Holdings |
Poletowin Pitcrew Holdings |
SHIFT | Valtes | |
| Financial year | March, 2023 | January, 2023 | August, 2022 | March, 2023 | |
| Share price (6/15) | 1,303 | 810 | 26,995 | 3,290 | |
| Market cap. (million yen) | 31,130 | 30,906 | 481,000 | 23,524 | |
| PER (CE, x) | 13.81 | 15.43 | 75.54 | 26.96 | |
| PBR (Act, x) | 3.29 | 1.76 | 17.14 | 9.33 | |
| Financial indicators (%) | |||||
| ROE | 10.12% | 4.50% | 17.66% | 31.61% | |
| ROA | 4.31% | 3.20% | 11.00% | 18.55% | |
| ROIC | 13.63% | 7.69% | 18.68% | 28.49% | |
| DPS (CE, yen) | 21.00 | 15.00 | 0.00 | 0.00 | |
| Financial data (TTM) | |||||
| Net sales (million yen) | 36,517 | 41,267 | 75,358 | 9,059 | |
| Three-year growth rate (%) | 20.0% | 16.1% | 37.9% | 22.9% | |
| Operating profit (million yen) | 3,000 | 2,309 | 8,169 | 2,703 | |
| Three-year growth rate (%) | 29.1% | -11.9% | 51.4% | 44.4% | |
| Operating profit margin (%) | 8.2% | 5.6% | 10.8% | 10.7% | |
| Composition of sales | |||||
| Enterprise Business | 45.9% | – | 92.9% | 100.0% | |
| Entertainment Business | 54.1% | – | 7.1% | 0.0% | |
Source: Prepared by Omega Investment, based on company data and other sources.
Share price performance (four software testing companies, TOPIX)
The company describes the scheme of the spin-off listing as shown in the diagram on the following page. Digital Hearts Holdings, the currently listed holding company, distributes shares of AGEST, Inc. to shareholders in kind. As a result, the capital relationship between AGEST and Digital Hearts Holdings is dissolved, and a parent-subsidiary listing is avoided. After the spin-off listing, the company’s shareholders will own shares in both AGEST and Digital Hearts Holding.
The details will be worked out over the next few years through preparation, finalisation of the scheme and examination by underwriter, auditors and TSE, and it is expected that a certain period will be required before the actual listing.
The company states that the expected effect of the spin-off listing is to maximise the growth potential of both businesses through different management, independent capital and unique human resources. A detailed explanation of the benefits for shareholders of the spin-off listing and the future progress of the project will continue to be required.
Spin-off listing schemes
Source: The company handout for the full year results for FY2023/3 (published on May 11, 2023)
◇ Stock price trend: The adjustment phase continues, but watch for further developments
The company’s share price fell 9.8% on May 12, the day after the May 11 results announcement. The downward trend has continued since then. In addition to a fall in the bottom-line profit in the financial results for FY2023/3, perhaps investors cannot sufficiently digest the implications of the spin-off listing of AGEST, Inc., a future growth pillar, and its impact on shareholder value.
Hopefully, the market’s deeper understanding of the spin-off listing will help to put the company’s share price back on an upward trajectory.
Digital Hearts Holdings (3676) Share Price Trend (3Year-to-date)
Financial data I
2020/3 |
2021/3 |
2022/3 |
2023/3 |
|||||||||||||
1Q |
2Q |
3Q |
4Q |
1Q |
2Q |
3Q |
4Q |
1Q |
2Q |
3Q |
4Q |
1Q |
2Q |
3Q |
4Q |
|
[Sales by segment] |
||||||||||||||||
Net sales |
4,988 |
5,234 |
5,455 |
5,460 |
5,093 |
5,437 |
5,782 |
6,355 |
6,098 |
7,400 |
7,747 |
7,932 |
8,372 |
9,190 |
9,316 |
9,638 |
YoY |
12.1% |
7.2% |
7.8% |
15.0% |
2.1% |
3.9% |
6.0% |
16.4% |
19.7% |
36.1% |
34.0% |
24.8% |
37.3% |
24.2% |
20.3% |
21.5% |
Enterprise business |
954 |
1,140 |
1,133 |
1,794 |
1,523 |
1,540 |
1,710 |
2,246 |
2,029 |
2,833 |
3,074 |
3,553 |
3,589 |
4,025 |
4,451 |
4,774 |
YoY |
46.3% |
41.5% |
32.0% |
82.5% |
59.6% |
35.1% |
50.9% |
25.2% |
33.2% |
83.9% |
79.7% |
58.2% |
76.8% |
42.0% |
44.8% |
34.3% |
Composition of sales |
19.1% |
21.8% |
20.8% |
32.9% |
29.9% |
28.3% |
29.6% |
35.3% |
33.3% |
38.3% |
39.7% |
44.8% |
42.9% |
43.8% |
47.8% |
49.5% |
New sub-segments |
||||||||||||||||
QA solution |
1,129 |
1,127 |
1,267 |
1,633 |
1,395 |
1,572 |
1,772 |
2,121 |
2,102 |
2,481 |
2,730 |
3,166 |
||||
YoY |
– |
– |
– |
– |
23.6% |
39.5% |
39.9% |
29.9% |
50.7% |
57.8% |
54.1% |
49.3% |
||||
Composition of sales |
22.2% |
20.7% |
21.9% |
25.7% |
22.9% |
21.2% |
22.9% |
26.7% |
25.1% |
27.0% |
29.3% |
32.8% |
||||
IT services and others |
393 |
413 |
442 |
613 |
634 |
1,260 |
1,301 |
1,432 |
1,486 |
1,543 |
1,721 |
1,608 |
||||
YoY |
– |
– |
– |
– |
61.3% |
205.1% |
194.3% |
133.6% |
134.3% |
22.4% |
32.3% |
12.4% |
||||
Composition of sales |
7.7% |
7.6% |
7.6% |
9.6% |
10.4% |
17.0% |
16.8% |
18.1% |
17.7% |
16.8% |
18.5% |
16.7% |
||||
Old sub-segments |
||||||||||||||||
System testing |
430 |
570 |
488 |
924 |
788 |
777 |
937 |
1,078 |
1,018 |
1,144 |
1,233 |
1,558 |
– |
– |
– |
– |
YoY |
65.8% |
99.5% |
33.5% |
91.4% |
83.1% |
36.2% |
92.0% |
16.7% |
29.2% |
47.2% |
31.5% |
44.5% |
– |
– |
– |
– |
Composition of sales |
8.6% |
10.9% |
8.9% |
16.9% |
15.5% |
14.3% |
16.2% |
17.0% |
16.7% |
15.5% |
15.9% |
19.6% |
– |
– |
– |
– |
IT services / Security |
523 |
569 |
645 |
869 |
735 |
763 |
772 |
1,167 |
1,011 |
1,688 |
1,841 |
1,995 |
– |
– |
– |
– |
YoY |
33.4% |
9.5% |
30.9% |
73.9% |
40.4% |
34.1% |
19.8% |
34.3% |
37.5% |
121.2% |
138.2% |
70.9% |
– |
– |
– |
– |
Composition of sales |
10.5% |
10.9% |
11.8% |
15.9% |
14.4% |
14.0% |
13.4% |
18.4% |
16.6% |
22.8% |
23.8% |
25.2% |
– |
– |
– |
– |
Entertainment business |
4,033 |
4,093 |
4,321 |
3,666 |
3,566 |
3,900 |
4,072 |
4,109 |
4,069 |
4,566 |
4,672 |
4,378 |
4,818 |
5,201 |
4,906 |
4,889 |
YoY |
6.2% |
0.5% |
2.9% |
-5.4% |
-11.6% |
-4.7% |
-5.8% |
12.1% |
14.0% |
17.1% |
14.7% |
6.6% |
18.4% |
13.9% |
5.0% |
11.7% |
Composition of sales |
80.9% |
78.2% |
79.2% |
67.1% |
70.0% |
71.7% |
70.4% |
64.7% |
66.7% |
61.7% |
60.3% |
55.2% |
57.6% |
56.6% |
52.7% |
50.7% |
New sub-segments |
||||||||||||||||
Domestic debugging |
2,681 |
2,846 |
2,953 |
3,054 |
2,931 |
3,030 |
3,149 |
3,011 |
3,334 |
3,561 |
3,220 |
3,720 |
||||
YoY |
– |
– |
– |
– |
9.3% |
6.4% |
6.7% |
-1.4% |
13.7% |
17.5% |
2.2% |
8.6% |
||||
Composition of sales |
52.7% |
52.4% |
51.1% |
48.1% |
48.1% |
41.0% |
40.7% |
38.0% |
39.8% |
38.8% |
34.6% |
33.9% |
||||
Global and others |
887 |
1,050 |
1,118 |
1,054 |
1,137 |
1,536 |
1,522 |
1,366 |
1,484 |
1,640 |
1,685 |
1,620 |
||||
YoY |
– |
– |
– |
– |
28.2% |
46.3% |
36.1% |
29.6% |
30.4% |
6.8% |
10.7% |
18.5% |
||||
Composition of sales |
17.4% |
19.3% |
19.3% |
16.6% |
18.7% |
20.8% |
19.7% |
17.2% |
17.7% |
17.8% |
18.1% |
16.8% |
||||
Old sub-segments |
||||||||||||||||
Debugging |
3,444 |
3,480 |
3,730 |
3,167 |
3,023 |
3,235 |
3,375 |
3,424 |
– |
– |
– |
– |
– |
– |
– |
– |
YoY |
10.8% |
6.0% |
6.8% |
-1.5% |
-12.2% |
-7.0% |
-9.5% |
8.1% |
– |
– |
– |
– |
– |
– |
– |
– |
Composition of sales |
69.1% |
66.5% |
68.4% |
58.0% |
59.4% |
59.5% |
58.4% |
53.9% |
– |
– |
– |
– |
– |
– |
– |
– |
Game Consoles |
1,186 |
1,056 |
1,341 |
1,126 |
1,023 |
1,147 |
1,258 |
1,402 |
– |
– |
– |
– |
– |
– |
– |
– |
YoY |
21.1% |
5.4% |
15.9% |
10.7% |
-13.7% |
8.6% |
-6.2% |
24.5% |
– |
– |
– |
– |
– |
– |
– |
– |
Composition of sales |
23.8% |
20.2% |
24.6% |
20.6% |
20.1% |
21.1% |
21.8% |
22.1% |
– |
– |
– |
– |
– |
– |
– |
– |
Mobile solutions |
2,013 |
2,171 |
2,141 |
1,848 |
1,819 |
1,959 |
2,005 |
1,870 |
– |
– |
– |
– |
– |
– |
– |
– |
YoY |
1.0% |
1.7% |
2.0% |
-4.9% |
-9.6% |
-9.8% |
-6.4% |
1.2% |
– |
– |
– |
– |
– |
– |
– |
– |
Composition of sales |
40.4% |
41.5% |
39.2% |
33.8% |
35.7% |
36.0% |
34.7% |
29.4% |
– |
– |
– |
– |
– |
– |
– |
– |
Amusement |
245 |
253 |
248 |
193 |
179 |
130 |
111 |
153 |
– |
– |
– |
– |
– |
– |
– |
– |
YoY |
77.5% |
75.7% |
4.6% |
-24.3% |
-26.9% |
-48.6% |
-55.2% |
-20.7% |
– |
– |
– |
– |
– |
– |
– |
– |
Composition of sales |
4.9% |
4.8% |
4.5% |
3.5% |
3.5% |
2.4% |
1.9% |
2.4% |
– |
– |
– |
– |
– |
– |
– |
– |
Creative |
350 |
307 |
282 |
285 |
311 |
367 |
372 |
398 |
– |
– |
– |
– |
– |
– |
– |
– |
YoY |
-31.4% |
-45.2% |
-33.1% |
-27.6% |
-11.2% |
19.6% |
32.0% |
39.2% |
– |
– |
– |
– |
– |
– |
– |
– |
Composition of sales |
7.0% |
5.9% |
5.2% |
5.2% |
6.1% |
6.8% |
6.4% |
6.3% |
– |
– |
– |
– |
– |
– |
– |
– |
Media and others |
238 |
306 |
308 |
212 |
234 |
294 |
324 |
286 |
– |
– |
– |
– |
– |
– |
– |
– |
YoY |
35.5% |
32.6% |
8.7% |
-19.4% |
-1.5% |
-3.9% |
5.0% |
34.5% |
– |
– |
– |
– |
– |
– |
– |
– |
Composition of sales |
4.8% |
5.9% |
5.7% |
3.9% |
4.6% |
5.4% |
5.6% |
4.5% |
– |
– |
– |
– |
– |
– |
– |
– |
Operating profit |
189 |
328 |
547 |
327 |
158 |
369 |
655 |
725 |
636 |
733 |
753 |
572 |
639 |
743 |
757 |
859 |
YoY |
-37.2% |
-30.9% |
18.0% |
-9.9% |
-16.4% |
12.4% |
19.7% |
121.3% |
301.3% |
98.5% |
14.9% |
-21.1% |
0.5% |
1.3% |
0.6% |
50.1% |
Operating profit margin |
3.8% |
6.3% |
10.0% |
6.0% |
3.1% |
6.8% |
11.3% |
11.4% |
10.4% |
9.9% |
9.7% |
7.2% |
7.6% |
8.1% |
8.1% |
8.9% |
Enterprise business |
-184 |
2 |
14 |
100 |
-21 |
-7 |
64 |
152 |
87 |
144 |
171 |
241 |
29 |
84 |
199 |
325 |
YoY |
– |
– |
– |
– |
– |
– |
360.3% |
51.3% |
– |
– |
163.8% |
58.7% |
-66.2% |
-41.5% |
16.8% |
34.6% |
Segment profit margin |
-19.4% |
0.3% |
1.2% |
5.6% |
-1.4% |
-0.5% |
3.8% |
6.8% |
4.3% |
5.1% |
5.6% |
6.8% |
0.8% |
2.1% |
4.5% |
6.8% |
Entertainment business |
727 |
760 |
891 |
585 |
517 |
700 |
936 |
923 |
930 |
975 |
978 |
783 |
1,036 |
1,155 |
1,014 |
1,008 |
YoY |
7.3% |
-8.8% |
6.1% |
-20.3% |
-28.9% |
-8.0% |
5.0% |
57.9% |
79.9% |
39.3% |
4.5% |
-15.2% |
11.4% |
18.5% |
3.6% |
28.8% |
Segment profit margin |
18.0% |
18.6% |
20.6% |
16.0% |
14.5% |
17.9% |
23.0% |
22.5% |
22.9% |
21.4% |
20.9% |
17.9% |
21.5% |
22.2% |
20.7% |
20.6% |
(Unit: million yen)
Note) The sum of this table’s segment sales and operating profit may not match the consolidated results, as there are some sales and operating profit adjustments.
Source: Omega Investment, based on company data.
Financial data II
2020/3 |
2021/3 |
2022/3 |
2023/3 |
|||||||||||||
1Q |
2Q |
3Q |
4Q |
1Q |
2Q |
3Q |
4Q |
1Q |
2Q |
3Q |
4Q |
1Q |
2Q |
3Q |
4Q |
|
[Statements of income] |
||||||||||||||||
Net sales |
4,988 |
5,234 |
5,455 |
5,460 |
5,093 |
5,437 |
5,782 |
6,355 |
6,098 |
7,400 |
7,747 |
7,932 |
8,372 |
9,190 |
9,316 |
9,638 |
Cost of sales |
3,772 |
3,830 |
3,949 |
3,953 |
3,819 |
4,002 |
4,001 |
4,700 |
4,271 |
5,290 |
5,579 |
5,645 |
5,899 |
6,478 |
6,690 |
6,817 |
Gross profit |
1,216 |
1,403 |
1,506 |
1,507 |
1,273 |
1,437 |
1,781 |
1,655 |
1,827 |
2,109 |
2,167 |
2,287 |
2,472 |
2,713 |
2,625 |
2,820 |
SG&A expenses |
1.026 |
1,074 |
958 |
959 |
1,115 |
1,067 |
1,126 |
1,150 |
1,191 |
1,375 |
1,414 |
1,714 |
1,832 |
1,970 |
1,868 |
1,961 |
Operating profit |
189 |
328 |
547 |
327 |
158 |
369 |
655 |
725 |
636 |
733 |
753 |
572 |
639 |
743 |
757 |
859 |
Non-operating income |
3 |
2 |
1 |
1 |
38 |
10 |
24 |
5 |
38 |
31 |
12 |
30 |
5 |
150 |
78 |
-14 |
Non-operating expenses |
3 |
7 |
7 |
7 |
2 |
3 |
4 |
10 |
4 |
4 |
5 |
21 |
7 |
4 |
11 |
44 |
Ordinary profit |
189 |
323 |
542 |
542 |
194 |
376 |
675 |
720 |
670 |
760 |
759 |
582 |
637 |
889 |
824 |
800 |
Extraordinary income |
0 |
0 |
0 |
19 |
32 |
|
13 |
66 |
1 |
1 |
– |
– |
41 |
33 |
||
Extraordinary expenses |
0 |
0 |
75 |
82 |
13 |
16 |
415 |
2 |
42 |
32 |
35 |
– |
6 |
171 |
1,052 |
|
Net profit before income taxes |
189 |
323 |
542 |
240 |
113 |
381 |
691 |
318 |
681 |
785 |
730 |
547 |
637 |
882 |
694 |
-218 |
Total income taxes |
77 |
159 |
162 |
99 |
38 |
122 |
224 |
145 |
189 |
281 |
233 |
35 |
201 |
306 |
216 |
418 |
Net profit attributable to
|
112 |
165 |
375 |
139 |
99 |
256 |
438 |
180 |
487 |
429 |
445 |
415 |
416 |
533 |
450 |
-601 |
[Balance Sheets] |
||||||||||||||||
Current assets |
6,717 |
7,574 |
7,710 |
7,453 |
6,648 |
7,291 |
8,017 |
9,744 |
9,604 |
9,848 |
10,658 |
10,392 |
10,874 |
12,182 |
11,569 |
12,528 |
Cash and deposits |
3,650 |
3,849 |
3,882 |
3,739 |
3,027 |
3,482 |
4,085 |
5,076 |
4,911 |
5,435 |
5,746 |
5,208 |
5,573 |
6,850 |
5,948 |
6,456 |
Notes and accounts receivable |
2,677 |
3,017 |
3,013 |
2,985 |
2,889 |
3,099 |
3,201 |
4,097 |
||||||||
Notes, accounts receivable andcontract assets |
4,161 |
3,872 |
4,372 |
4,411 |
4,614 |
4,672 |
4,930 |
5,377 |
||||||||
Non-current assets |
2,481 |
3,252 |
3,227 |
3,184 |
3,205 |
3,167 |
3,160 |
4,593 |
6,321 |
6,178 |
6,342 |
7,217 |
8,158 |
8,505 |
8,343 |
7,052 |
Tangible fixed assets |
545 |
646 |
627 |
579 |
560 |
549 |
565 |
598 |
602 |
623 |
621 |
693 |
1,067 |
1,077 |
1,100 |
1,169 |
Intangible fixed assets |
793 |
1,404 |
1,390 |
1,379 |
1,445 |
1,424 |
1,433 |
2,670 |
4,389 |
4,244 |
4,225 |
5,139 |
5,206 |
5,750 |
5,593 |
4,188 |
Goodwill |
491 |
1,066 |
1,033 |
1,027 |
1,032 |
991 |
950 |
2,467 |
4,175 |
4,042 |
3,945 |
4,588 |
4,812 |
5,301 |
5,082 |
3,468 |
Investments and other assets |
1,142 |
1,202 |
1,209 |
1,225 |
1,199 |
1,193 |
1,161 |
1,324 |
1,330 |
1,309 |
1,495 |
1,384 |
1,883 |
1,678 |
1,649 |
1,694 |
Total assets |
9,199 |
10,827 |
10,938 |
10,637 |
9,854 |
10,459 |
11,177 |
14,338 |
15,925 |
16,026 |
17,001 |
17,610 |
19,033 |
20,688 |
19,913 |
19,581 |
Current liabilities |
3,621 |
4,679 |
4,863 |
5,135 |
4,450 |
4,655 |
5,061 |
7,904 |
8,954 |
8,775 |
9,354 |
9,679 |
10,759 |
11,330 |
9.495 |
9,930 |
Short-term borrowings |
1,704 |
2,504 |
2,506 |
2,546 |
2,546 |
2,551 |
2,552 |
4,728 |
5,534 |
5,406 |
5,406 |
5,421 |
6,806 |
7,106 |
5,106 |
5,106 |
Non-current liabilities |
622 |
624 |
629 |
63 |
62 |
132 |
135 |
119 |
294 |
55 |
58 |
364 |
162 |
154 |
113 |
176 |
Long-term debt |
48 |
46 |
48 |
– |
– |
66 |
65 |
63 |
236 |
– |
– |
169 |
– |
– |
– |
– |
Total liabilities |
4,243 |
5,304 |
5,493 |
5,198 |
4,513 |
4,788 |
5,196 |
8,024 |
9,249 |
8,830 |
9,413 |
10,044 |
10,921 |
11,485 |
9,608 |
10,107 |
Total net assets |
4,955 |
5,523 |
5,445 |
5,438 |
5,340 |
5,670 |
5,980 |
6,314 |
6,677 |
7,196 |
7,588 |
7,566 |
8,111 |
9,202 |
10,304 |
9,474 |
Shareholders’ equity |
4,734 |
5,039 |
4,919 |
4,898 |
4,841 |
5,172 |
5,460 |
5,642 |
5,983 |
6,436 |
6,719 |
6,774 |
7,030 |
7,779 |
8,838 |
8,283 |
Capital |
300 |
300 |
300 |
300 |
300 |
300 |
300 |
300 |
300 |
300 |
300 |
300 |
300 |
300 |
300 |
300 |
Legal capital reserve |
366 |
357 |
357 |
355 |
355 |
331 |
331 |
331 |
331 |
338 |
338 |
– |
– |
60 |
375 |
393 |
Retained earnings |
6,378 |
6,543 |
6,765 |
6,904 |
6,848 |
7,105 |
7,393 |
7,575 |
7,916 |
8,342 |
8,626 |
9,019 |
9,275 |
9,809 |
10,031 |
9,427 |
Treasury shares |
-2,311 |
-2,162 |
-2,503 |
-2,662 |
-2,662 |
-2,565 |
-2,565 |
-2,565 |
-2,565 |
-2,545 |
-2,546 |
-2,545 |
-2,545 |
-2,391 |
-1,868 |
-1,838 |
Stock acquisition right |
13 |
13 |
13 |
13 |
13 |
13 |
13 |
13 |
– |
– |
– |
– |
– |
10 |
6 |
6 |
Total liabilities and net assets |
9,199 |
10,827 |
10,938 |
10,637 |
9,854 |
10,459 |
11,177 |
14,338 |
15,925 |
16,026 |
17,001 |
17,610 |
19,033 |
20,688 |
19,913 |
19,581 |
[Statements of cash flows] |
||||||||||||||||
Cash flow from operating activities |
-5 |
1,086 |
101 |
1,416 |
1,703 |
3,077 |
1,430 |
2,850 |
||||||||
Net profit before taxes |
513 |
1,296 |
494 |
1,504 |
1,466 |
2,744 |
1,520 |
1,996 |
||||||||
Cash flow from investing activities |
-963 |
-1,018 |
-261 |
-1,813 |
-1,682 |
-2,537 |
-1,496 |
-1,903 |
||||||||
Cash flow from financing activities |
|
637 |
|
-515 |
|
-90 |
|
1,730 |
|
316 |
-546 |
1,488 |
141 |
|||
Free cash flow |
–968 |
68 |
-160 |
-397 |
21 |
540 |
-66 |
947 |
||||||||
Net increase (decrease) in cash and
|
-347 |
-458 |
-252 |
1,341 |
359 |
132 |
1,676 |
1,283 |
||||||||
Cash and cash equivalents at
|
4,162 |
4,162 |
3,704 |
3,704 |
5,041 |
5,041 |
5,173 |
5,173 |
||||||||
Cash and cash equivalents at
|
3,814 |
3,704 |
3,447 |
5,041 |
5,400 |
5,173 |
6,850 |
6,456 |
(Unit: million yen)
Source: Omega Investment, based on company data.
Financial data (full year basis )
| FY2014/3 | FY2015/3 | FY2016/3 | FY2017/3 | FY2018/3 | FY2019/3 | FY2020/3 | FY2021/3 | FY2022/3 | FY2023/3 | |
| [Statements of income] | ||||||||||
| Net sales | 10,137 | 13,285 | 15,011 | 15,444 | 17,353 | 19,254 | 21,138 | 22,669 | 29,178 | 36,517 |
| YoY (%) | – | 31.0 | 13.0 | 2.9 | 12.4 | 11.0 | 9.8 | 7.2 | 28.7 | 25.2 |
| Cost of sales | 6,653 | 9,336 | 10,690 | 10,938 | 12,394 | 13,791 | 15,566 | 16,235 | 20,787 | 25,885 |
| Gross profit | 3,484 | 3,948 | 4,320 | 4,506 | 4,958 | 5,463 | 5,571 | 6,433 | 8,391 | 10,632 |
| SG&A expenses | 1,703 | 2,431 | 2,356 | 2,599 | 3,222 | 3,857 | 4,177 | 4,524 | 5,695 | 7,631 |
| Operating profit | 1,780 | 1,517 | 1,963 | 1,906 | 1,735 | 1,605 | 1,394 | 1,908 | 2,696 | 3,000 |
| YoY (%) | – | 14.8 | 29.4 | -2.9 | -9.0 | -7.5 | -13.2 | 36.9 | 41.3 | 11.3 |
| Operating profit margin (%) | 17.6 | 11.4 | 13.1 | 12.3 | 10.0 | 8.3 | 6.6 | 8.4 | 9.2 | 8.2 |
| Non-operating income | 22 | 66 | 43 | 128 | 57 | 109 | 22 | 80 | 112 | 220 |
| Non-operating expenses | 15 | 57 | 49 | 37 | 10 | 63 | 44 | 13 | 34 | 68 |
| Ordinary profit | 1,788 | 1,525 | 1,958 | 1,997 | 1,782 | 1,651 | 1,372 | 1,975 | 2,774 | 3,152 |
| Extraordinary income | 18 | 9 | 17 | 2 | 733 | 55 | 83 | 75 | ||
| Extraordinary expenses | 14 | 835 | 573 | 151 | 51 | 75 | 526 | 112 | 1,231 | |
| Net profit before income taxes | 1,792 | 1,525 | 1,132 | 1,441 | 1,632 | 2,333 | 1,296 | 1,504 | 2,749 | 1,996 |
| Total income taxes | 700 | 975 | 734 | 641 | 503 | 745 | 499 | 530 | 739 | 1,109 |
| Net profit attributable to owners of the parent |
1,087 | 539 | 361 | 795 | 1,200 | 1,575 | 792 | 974 | 1,778 | 799 |
| YoY (%) | – | -50.4 | -33.0 | 119.7 | 51.0 | 31.3 | -49.7 | 23.0 | 82.7 | -55.0 |
| Net profit ratio (%) | 10.7 | 4.1 | 2.4 | 5.1 | 6.9 | 8.2 | 3.7 | 4.3 | 6.1 | 2.2 |
| [Supplementary data] | ||||||||||
| EPS | 45.96 | 22.61 | 15.72 | 35.58 | 55.14 | 72.13 | 36.31 | 45.15 | 82.25 | 36.50 |
| ROE (%) | 33.6 | 13.8 | 10.5 | 29.2 | 40.0 | 38.6 | 16.3 | 18.4 | 28.0 | 10.1 |
| ROA (%) | 29.8 | 19.8 | 26.5 | 28.2 | 22.0 | 17.9 | 13.4 | 15.8 | 17.4 | 17.0 |
| Dividend | 16.00 | 34.00 | 38.00 | 23.00 | 11.50 | 13.00 | 14.00 | 14.00 | 15.00 | 21.00 |
| Dividend payout ratio (%) | 16.3 | 37.6 | 60.4 | 32.3 | 20.9 | 18.0 | 38.6 | 31.0 | 18.2 | 57.5 |
| [Balance Sheets] | ||||||||||
| Current assets | 5,549 | 5,756 | 5,064 | 6,221 | 6,732 | 7,403 | 7,453 | 9,744 | 10,392 | 12,528 |
| Cash and deposits | 3,693 | 3,058 | 2,197 | 3,344 | 3,894 | 4,197 | 3,739 | 5,076 | 5,208 | 6,456 |
| Notes and accounts receivable | 1,483 | 2,374 | 2,230 | 1,942 | 2,480 | 2,724 | 2,985 | 4,097 | ||
| Notes, accounts receivable and contract assets |
4,411 | 5,377 | ||||||||
| Non-current assets | 1,611 | 2,516 | 1,469 | 1,430 | 1,842 | 2,428 | 6,178 | 6,342 | 7,217 | 7,052 |
| Tangible fixed assets | 323 | 368 | 299 | 298 | 473 | 558 | 579 | 598 | 693 | 1,169 |
| Intangible fixed assets | 695 | 1,505 | 580 | 238 | 286 | 763 | 1,379 | 2,670 | 5,139 | 4,188 |
| Goodwill | 595 | 1,169 | 437 | 201 | 150 | 481 | 1,027 | 2,467 | 4,588 | 3,468 |
| Investments and other assets | 592 | 642 | 589 | 893 | 1,082 | 1,107 | 1,225 | 1,324 | 1,384 | 1,694 |
| Total assets | 7,160 | 8,272 | 6,533 | 7,651 | 8,575 | 9,832 | 10,637 | 14,338 | 17,610 | 19,581 |
| Current liabilities | 3,372 | 3,823 | 3,374 | 3,759 | 3,929 | 4,192 | 5,134 | 7,904 | 9,679 | 9,930 |
| Short-term borrowings | 1,610 | 1,603 | 1,299 | 1,630 | 1,600 | 1,704 | 2,546 | 4,728 | 5,421 | 5,106 |
| Non-current liabilities | 20 | 280 | 69 | 1,033 | 1,075 | 627 | 63 | 119 | 364 | 176 |
| Long-term debt | 12 | 216 | 46 | 2 | – | 50 | – | 63 | 169 | – |
| Total liabilities | 3,393 | 4,104 | 3,444 | 4,793 | 5,005 | 4,819 | 5,198 | 8,024 | 10,044 | 10,107 |
| Total net assets | 3,766 | 4,168 | 3,089 | 2,858 | 3,570 | 5,012 | 5,438 | 6,314 | 7,566 | 9,474 |
| Shareholders’ equity | 3,687 | 4,036 | 2,773 | 2,590 | 3,340 | 4,763 | 4,898 | 5,642 | 6,774 | 8,283 |
| Capital | 300 | 300 | 300 | 300 | 300 | 300 | 300 | 300 | 300 | 300 |
| Legal capital reserve | 300 | 300 | 368 | 277 | 331 | 366 | 355 | 331 | – | 393 |
| Retained earnings | 3,086 | 3,435 | 3,604 | 4,164 | 5,113 | 6,408 | 6,904 | 7,575 | 9,019 | 9,427 |
| Treasury shares | 0 | 0 | -1,499 | -2,152 | -2,405 | -2,311 | -2,662 | -2,565 | -2,545 | -1,838 |
| Stock acquisition right | 14 | 14 | 13 | 13 | 13 | – | 6 | |||
| Total liabilities and net assets | 7,160 | 8,272 | 6,533 | 7,651 | 8,575 | 9,832 | 10,637 | 14,338 | 17,610 | 19,581 |
| Equity Ratio (%) | 51.9 | 49.5 | 43.1 | 34.4 | 39.3 | 48.7 | 46.3 | 39.7 | 39.7 | 45.0 |
| BPS | 155.63 | 171.30 | 125.80 | 119.96 | 154.61 | 219.06 | 228.62 | 263.32 | 323.21 | 395.65 |
| [Statements of cash flows] | ||||||||||
| Cash flow from operating activities | 1,561 | 870 | 1,080 | 1,825 | 1,436 | 889 | 1,086 | 1,416 | 3,077 | 2,850 |
| Net profit before taxes | 1,792 | 1,525 | 1,132 | 1,441 | 1,632 | 2,333 | 1,296 | 1,504 | 2,744 | 1,996 |
| Cash flow from investing activities | -368 | -568 | -17 | -610 | -618 | 62 | -1,018 | -1,813 | -2,537 | -1,903 |
| Cash flow from financing activities | 308 | -950 | -1,913 | -69 | -250 | -693 | -515 | 1,730 | -546 | 141 |
| Free cash flow | 1,193 | 302 | 1,063 | 1,215 | 818 | 951 | 68 | -397 | 540 | 947 |
| Cash and cash equivalents at end of period |
1,508 | -634 | -860 | 1,146 | 564 | 258 | -458 | 1,341 | 132 | 1,283 |
| Cash and cash equivalents at beginning of period |
2,184 | 3,693 | 3,058 | 2,197 | 3,344 | 3,894 | 4,162 | 3,704 | 5,041 | 5,173 |
| Cash and cash equivalents at end of period |
3,693 | 3,058 | 2,197 | 3,344 | 3,894 | 4,162 | 3,704 | 5,041 | 5,173 | 6,456 |
(Unit: million yen)
Source: Omega Investment, based on company data.