2026-07-27
Home
Japanese

Omega Investment Co., Ltd.
TENPO INNOVATION (4Q Follow up)

Profitability rising on structural growth drivers
Margins rising on increase in successor contracts and guarantee fees
| Click here for the PDF version of this page |
| PDF Version |
SUMMARY
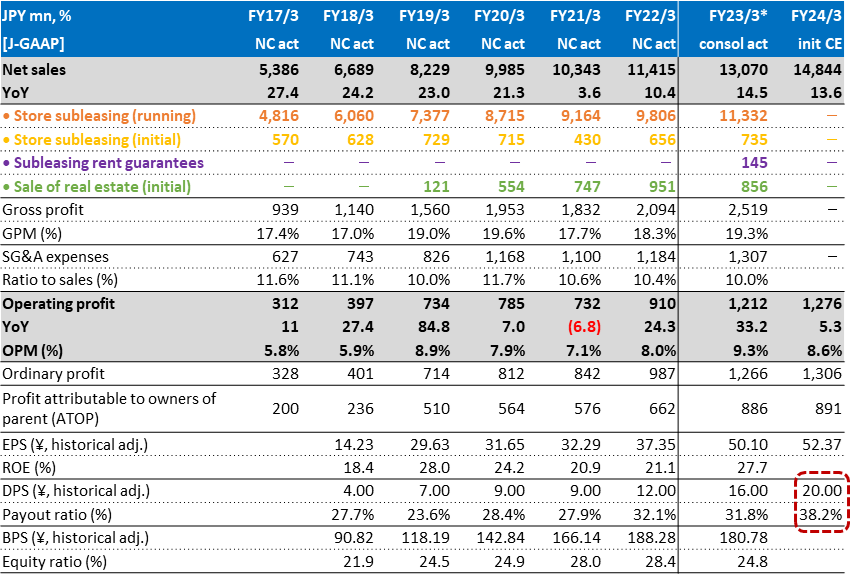
- TENPO INNOVATION is an undervalued growth stock. 7-year CAGR for the period through FY24/3 initial CE shown below is net sales +15.6%, OP +22.3% and profit attributable to owners of parent +23.8%, respectively. The Company is debt-free, and net cash accounts for more than 100% of total shareholders’ equity (P7). The new 3-year Medium-Term Management Plan includes hiking the target payout ratio from the 30% level to the 40% level (P10).
- Structural growth drivers: ❶ The difficult environment for the restaurant industry overall is actually a favorable opportunity for the Company as more properties become available to procure for subleasing, and turnover in existing contracts increases the number of profitable successor contracts (no acquisition costs such as key money), and ❷ newly established store rent guarantee business has no cost of sales or personnel cost, so net sales are basically equivalent to OP, and revenue is linked directly to the number of signed contracts each quarter.
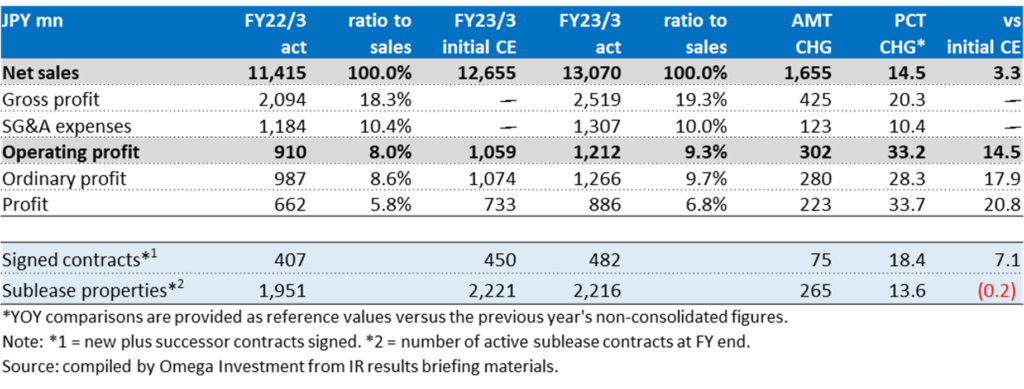
TENPOINNOVATIONS:Summary of FY23/3 Financial Results
Source: compiled by Omega Investment from YUHO financial statements and IR results briefing materials.
*Note: YoY figures are provided as reference information compared with non-consolidated financial results.
Financial Indicators
| Share price (6/19) | 1,101 | 24.3 P/E (CE) | 19.8x |
| YH (23/3/10) | 1,340 | 24.3 EV/EBITDA (CE) | 10.8x |
| YL (23/6/8) | 1,006 | 23.3 ROE (act) | 27.7% |
| 10YH (23/3/10) | 1,340 | 23.3 ROIC (act) | 25.9% |
| 10YL (20/4/6) | 477 | 23.3 P/B (act) | 5.53x |
| Shrs out. (mn shrs) | 17.674 | 24.3 DY (CE) | 1.90% |
| Mkt cap (¥ bn) | 18.611 | | |
| EV (¥ bn) | 17.663 | | |
| Equity ratio (3/31) | 24.8% | | |
PART ① TENPO STORES vs RESTAURANT INDUSTRY
TENPO INNOVATION subleased store properties are uncorrelated with the market
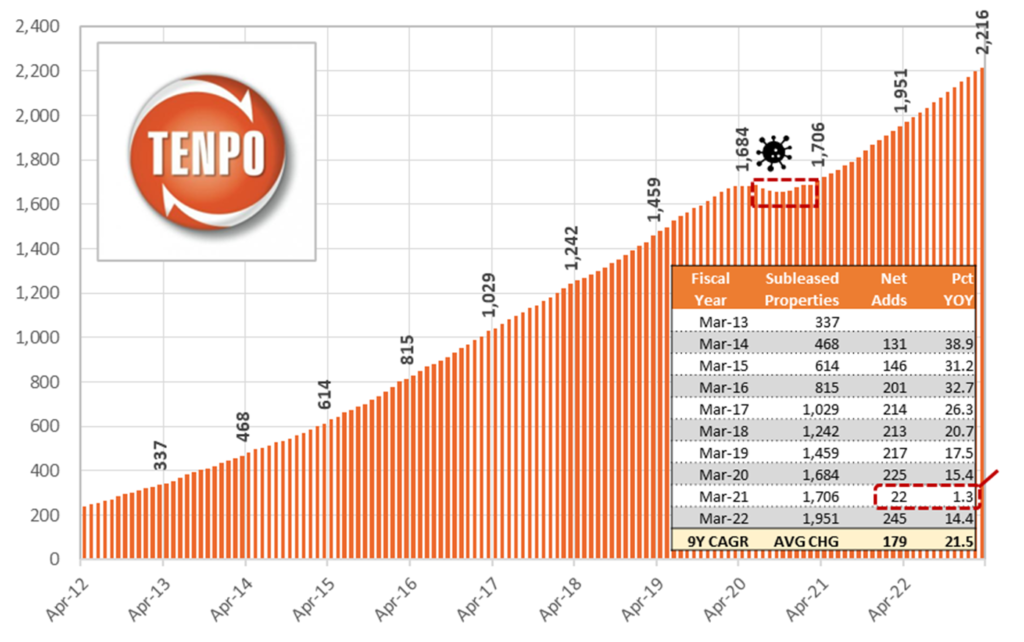
According to the JF Food Service Industry Market YoY Trend Survey for March 2023, total stores declined -1.3% YoY, but relative to March 2019, declined -7.8%, yet to post a meaningful recovery. For the same period, subleased restaurant store properties for TENPO INNOVATION increased +13.6% YoY, and relative to March 2019, increased +51.9%. In other words, there is no correlation between TENPO INNOVATION subleased restaurant store properties and the underlying market trend for total stores. They are uncorrelated. The graph below shows the long-term monthly trend of the Company’s subleased restaurant store properties.
Expertise in finding and subleasing relatively small, low rent, vacated- furnished restaurant store properties, many in central Tokyo.
Monthly trend of subleased store properties: textbook definition of stable high growth
Monthly trend of sublease contract transactions during the pandemic
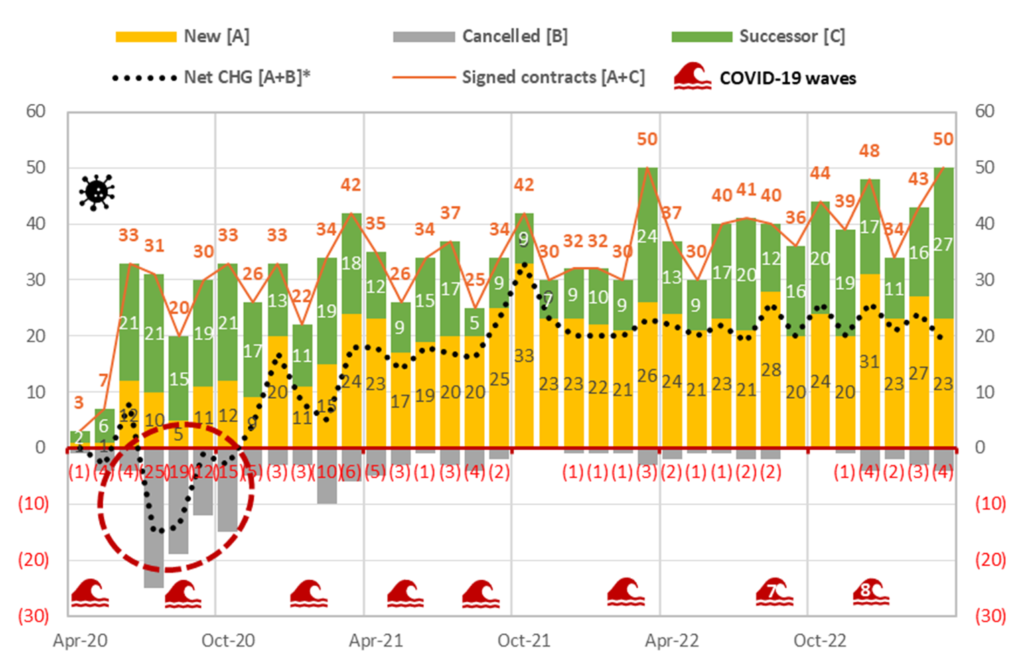
Source: compiled by Omega Investment from company IR results briefing materials. *Note: net change = “New – Cancelled” as well as reflects transfer from “sublease to leasehold” and “leasehold to sublease” (Dec 2021: -2; Jan 2022: -1; Oct 2021: +2; Nov 2022: +1; Dec 2022: -1).
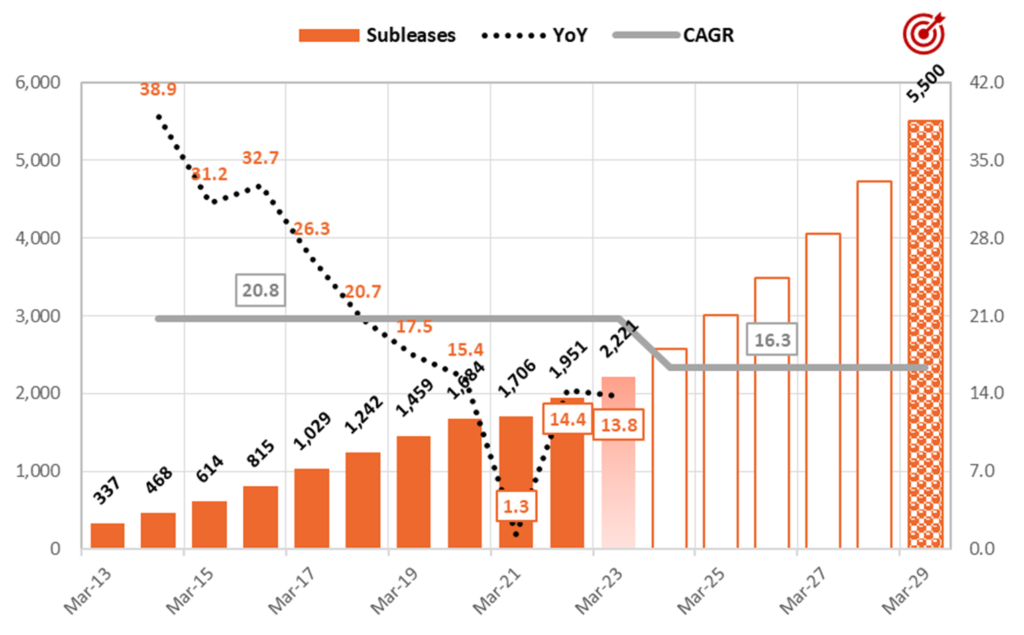
TENPO INNOVATION: Sustainable double-digit growth with high stability
Source: compiled by Omega Investment from company IR FY22/3 Q4 results briefing materials.
The graph above shows the Company’s medium-term target for 5,500 subleased properties by the end of FY3/29, implying 6-year CAGR of +16.3% per year. This target was not randomly formulated by simply assigning a certain CAGR growth rate, rather, it is equivalent to a roughly 5% market share of the estimated 110,000 viable candidate restaurant store property universe in Tokyo and the three surrounding prefectures, based on the total number of 160,000 restaurants from the 2016 Economic Census of Business Activity. In order to achieve this target, a key initiative in the Company’s Medium-Term Management Plan is to boost its salesforce from the current 40 professionals (14 store procurement, 26 finding subleasing tenants) to 100 (30 store procurement, 70 finding subleasing tenants). Please refer to P9 in the REFERENCE section for details of initiatives in the MTP.
TOKYO × TENPO INNOVATION
Grab Tokyo.
The world’s largest number of passengers Shinjuku Station: 3.59 million
The world’s largest number of restaurants Metropolitan Tokyo: 79,601
The world’s top gastronomic city No. of Michelin-star restaurants: 226
We compete in this city with the highest potential.
The world’s most traversed pedestrians Shibuya
The world’s best subculture district Akihabara
There is more we can do.
99% untapped market.
We will not stop and will keep pushing forward.
It will become a big swell and envelop this city.
From because we can do it → so we will do it.
PART ② EARNINGS RESULTS
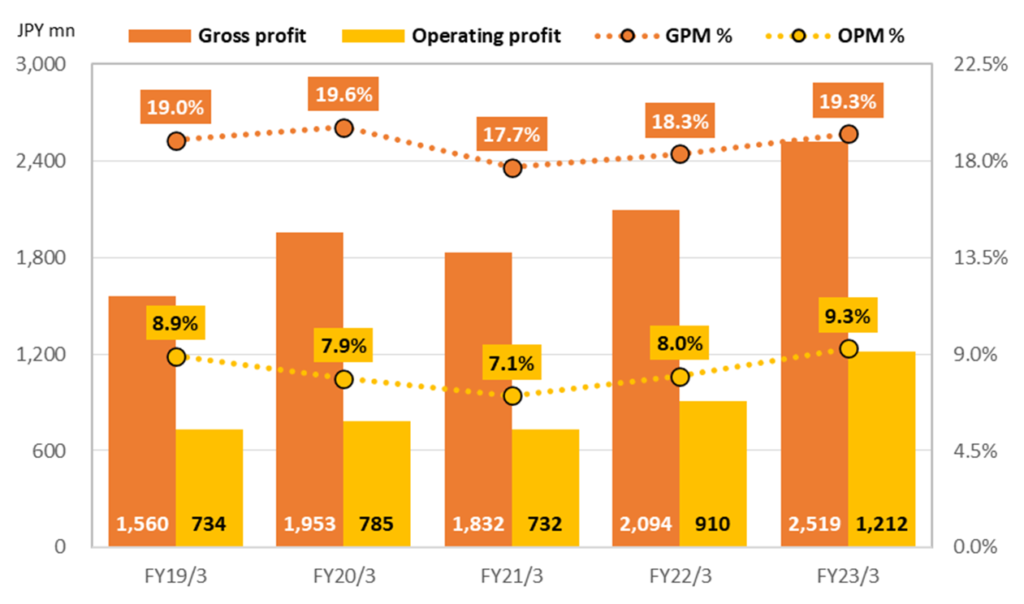
FY23/3 consolidated net sales +14.5% and OP +33.2%
Since the Company began consolidating the accounts of newly established wholly-owned subsidiary Tenpo Safety Inc. (rent guarantee business explained on the next page) from FY23/3, YoY figures are provided for reference versus non-consolidated results the previous term. Net sales increased +14.5% YoY, OP increased +33.2% YoY, GPM rose from 18.3% → 19.3%, and OPM rose from 8.0% → 9.3%. In addition to the contribution from new high-margin rent guarantee business, store subleasing business got a boost from the increase in new successor contracts from 135 → 197 (+45.9% YoY). Store subleasing sales increased +16.7% (sublease properties rose to 2,216, +13.6%), and store subleasing OP of ¥962mn increased +32.9%.
Real estate trading business got a boost from the sale of 5 properties which included several large-scale profitable properties (see graph below). In FY23/3, 5 properties were sold and 8 properties were acquired (Q4-only: 0 properties sold, 3 properties acquired), bringing the number of properties held by the Company to 6 at the end of FY23/3. Real estate trading sales declined -9.6%, however real estate trading OP of ¥251mn increased +34.7%. Although the primary objective of this business is to maintain a good relationship with RE brokers by paying meaningful commissions in return for good information on sublease candidates, the Company has recently also received interest from existing owner landlords to purchase properties, enhancing a stable supply pipeline without referrals.
Quarterly Trend of Sales Breakdown by Income Category (JPY mn)
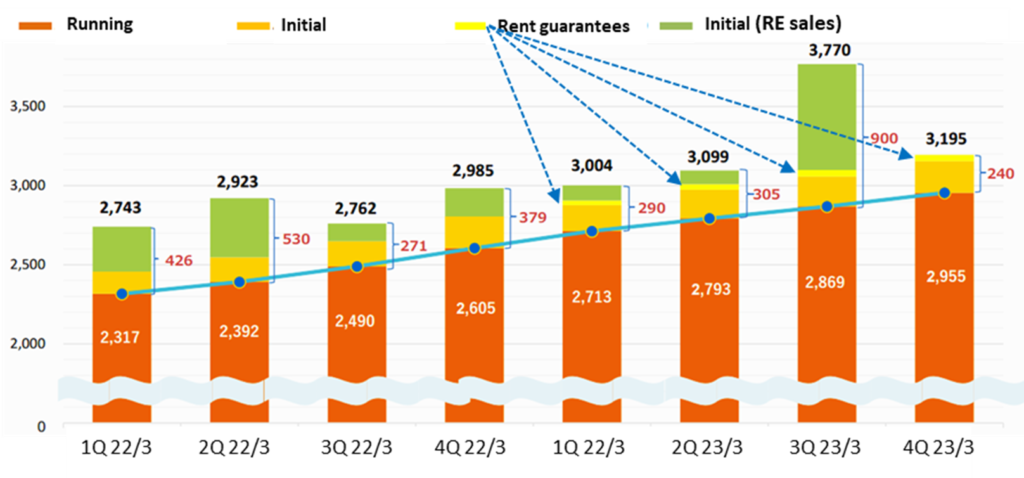
Note: initial income includes one-time payments of key money, contract-related fees and proceeds from the sale of fixtures from vacated-furnished store properties. Running income includes rent income and contract renewal fees from sublease tenants. Store sublease rent guarantees include some running income. Figures for 1Q FY23/3 are consolidated; figures for 4Q FY22/3 and earlier are non-consolidated. Source: excerpt from IR results briefing materials.
TENPO INNOVATION 4Q FY3/23 Financial Results Summary
PART ③ TOPICS
Store rent guarantee business of Tenpo Safety Inc. commenced on April 1, 2022
Since the Revised Civil Code went into effect from April 2020, rent guarantees for store lease properties are expanding socially as a system that benefits both property landlords and tenants. In the past, the Company had tenants enter a rent guarantee contract automatically upon application, and the business was consigned to outside providers of rent guarantees. However, with over 17 years experience in subleasing over 2,000 restaurant store properties, and unique screening know-how, the Company is fully capable of assessing the risk of its subleased properties. The Board of Directors resolved on March 24, 2022 to establish a wholly-owned subsidiary with the aim of keeping this income stream in-house.
According to the Company, every contract signed requires entering a rent guarantee agreement, and the rent guarantee fee is equivalent to roughly 1 month’s rent. The newly established Tenpo Safety Inc. handles 70-80% of these contracts, the remainder deemed to carry a higher level of risk are outsourced. Therefore, with signed contracts running at over 100 per quarter, roughly 80 contribute directly to Group profits each quarter. As described on the cover page, this business carries a virtual 100% OPM, and growth is linked directly to signed contracts. Along with the rise in profitable successor contracts, store rent guarantee business will be a structural driver of margins going forward.
Tenpo Safety Inc. Store Rent Guarantee Business Overview
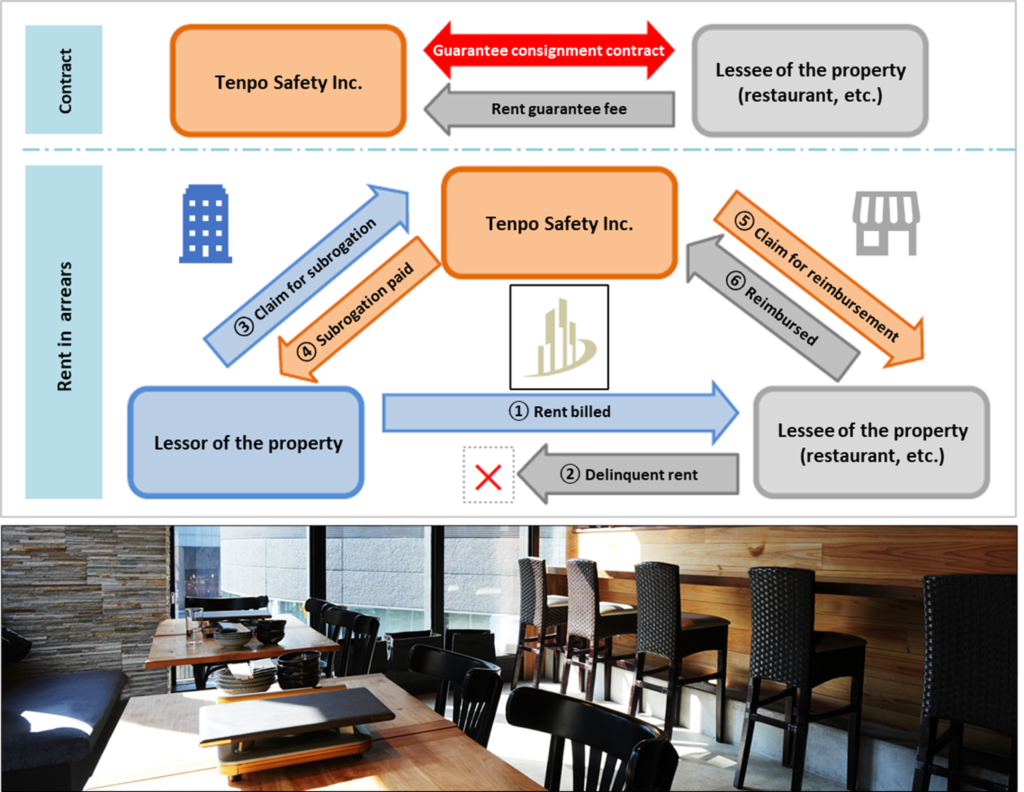
Source: FY22/3 4Q IR results briefing materials, restaurant store image from Tenpo Safety Inc. website.
PART ④ SHARE PRICE
3Y Share Price Chart, 13W/26W/52W MA, Volume and Trend of Valuations
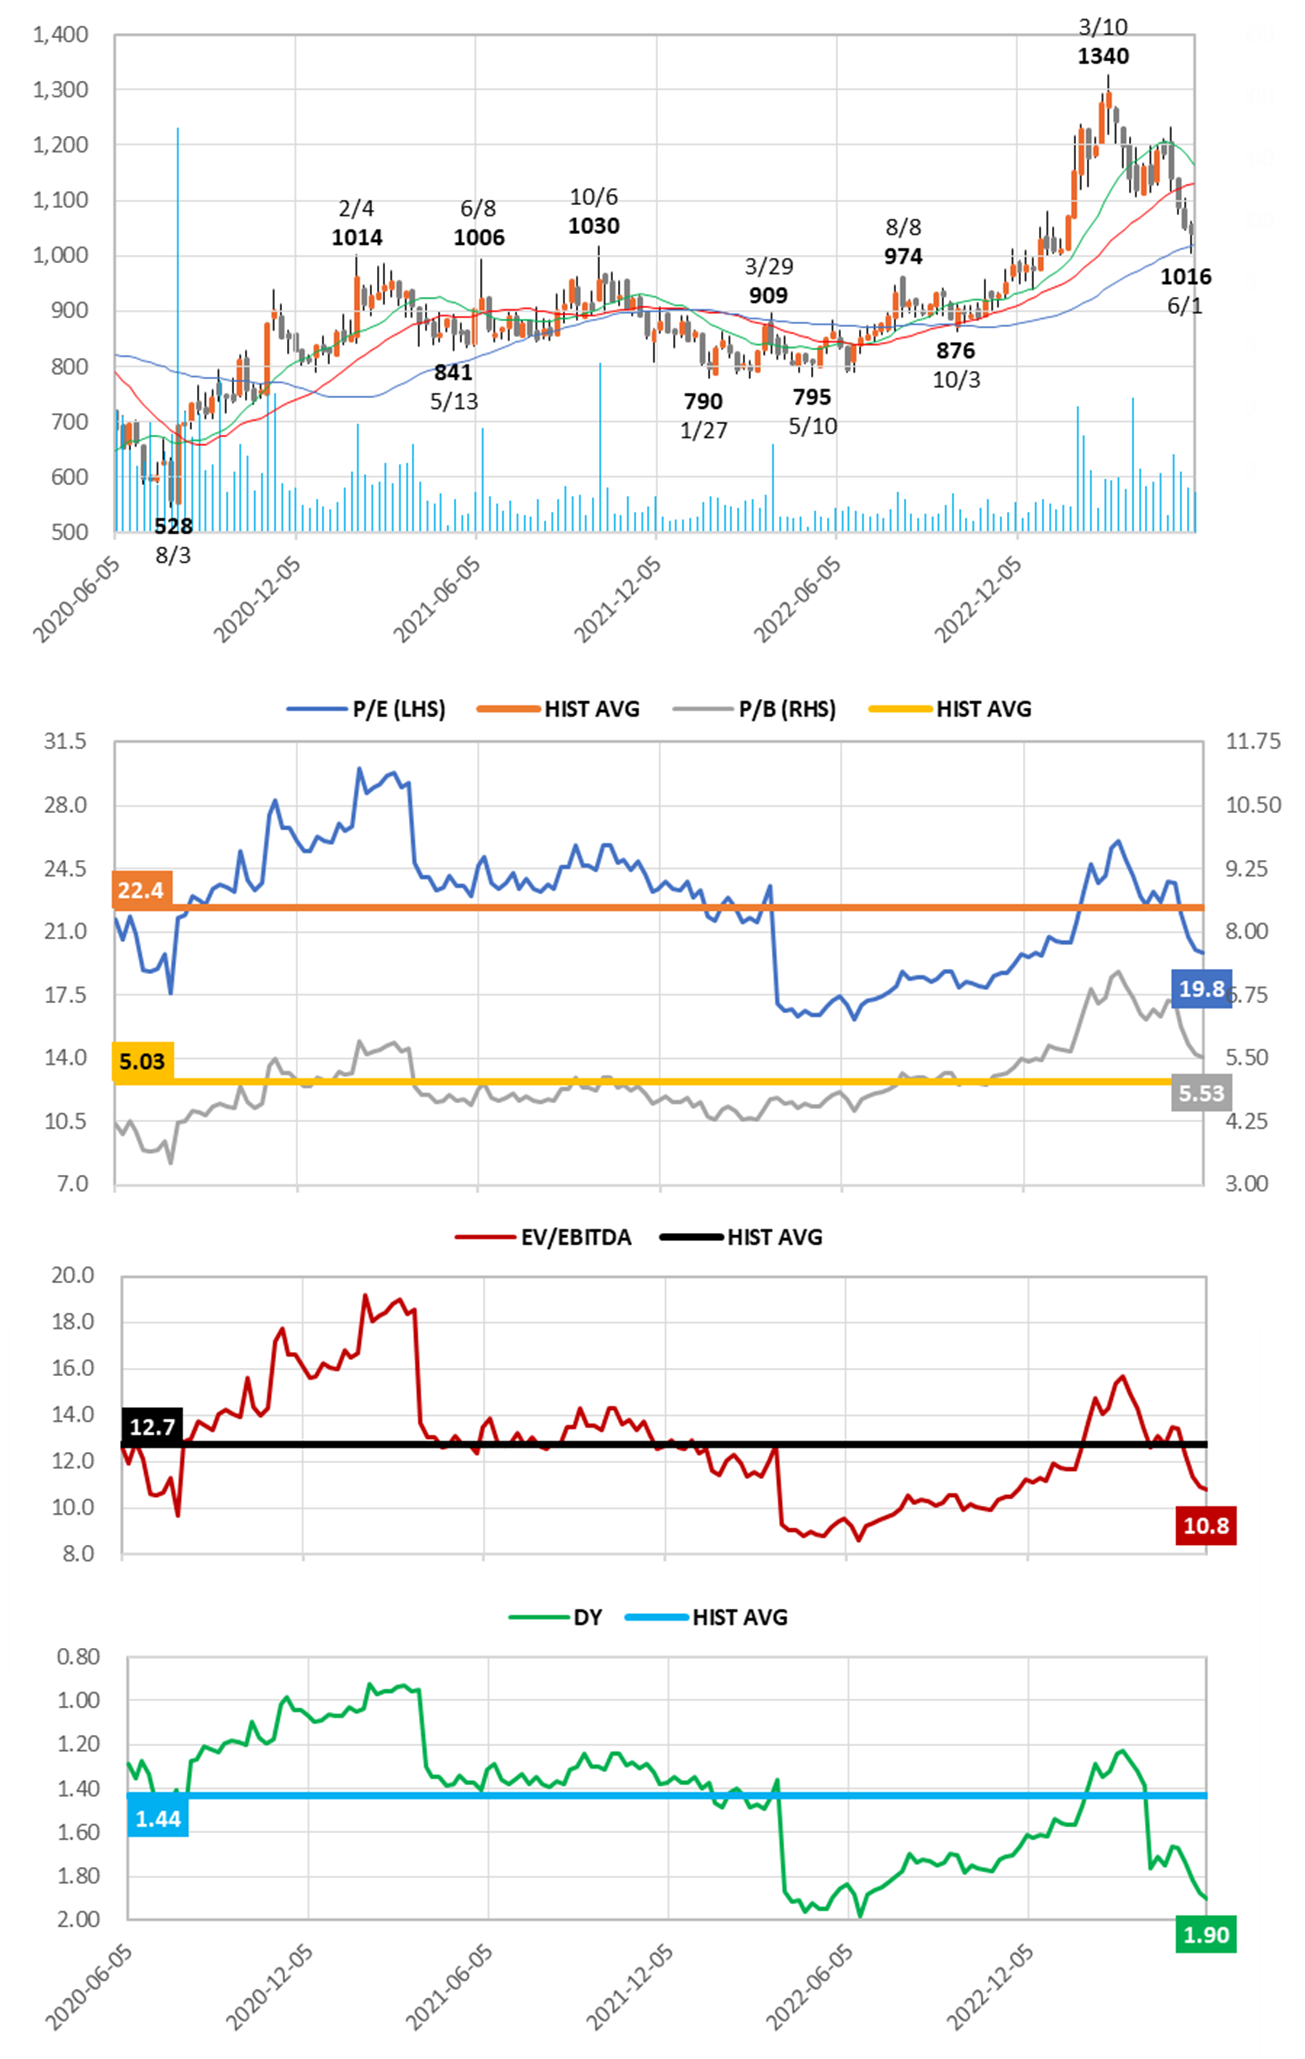
Source: compiled by Omega Investment from historical price data. Forecast values based on current Company estimates.
Key takeaways:
❶ The current P/E and EV/EBITDA are trading on 11.4% and 15.4% discounts to their respective historical averages. This reflects the natural adjustment after the rise on two share buybacks, as well as the steady rise in profitability driven by the two structural growth drivers described on P1.
❷ The equity ratio on the surface may appear low at 24.8%, however this reflects the fact that the B/S is comprised of a large amount of deposits paid and received (see B/S on next page). The Company is debt-free, and the B/S is extremely healthy.
❸ Following the ¥4.00 per share hike to FY-end DPS of ¥16.00 per share for FY23/3, initial guidance for FY24/3 is for another ¥4.00 per share hike to FY-end DPS of ¥20.00 per share. The DY of 1.90% is now trading 32.3% above its historical average.
Consolidated balance sheet
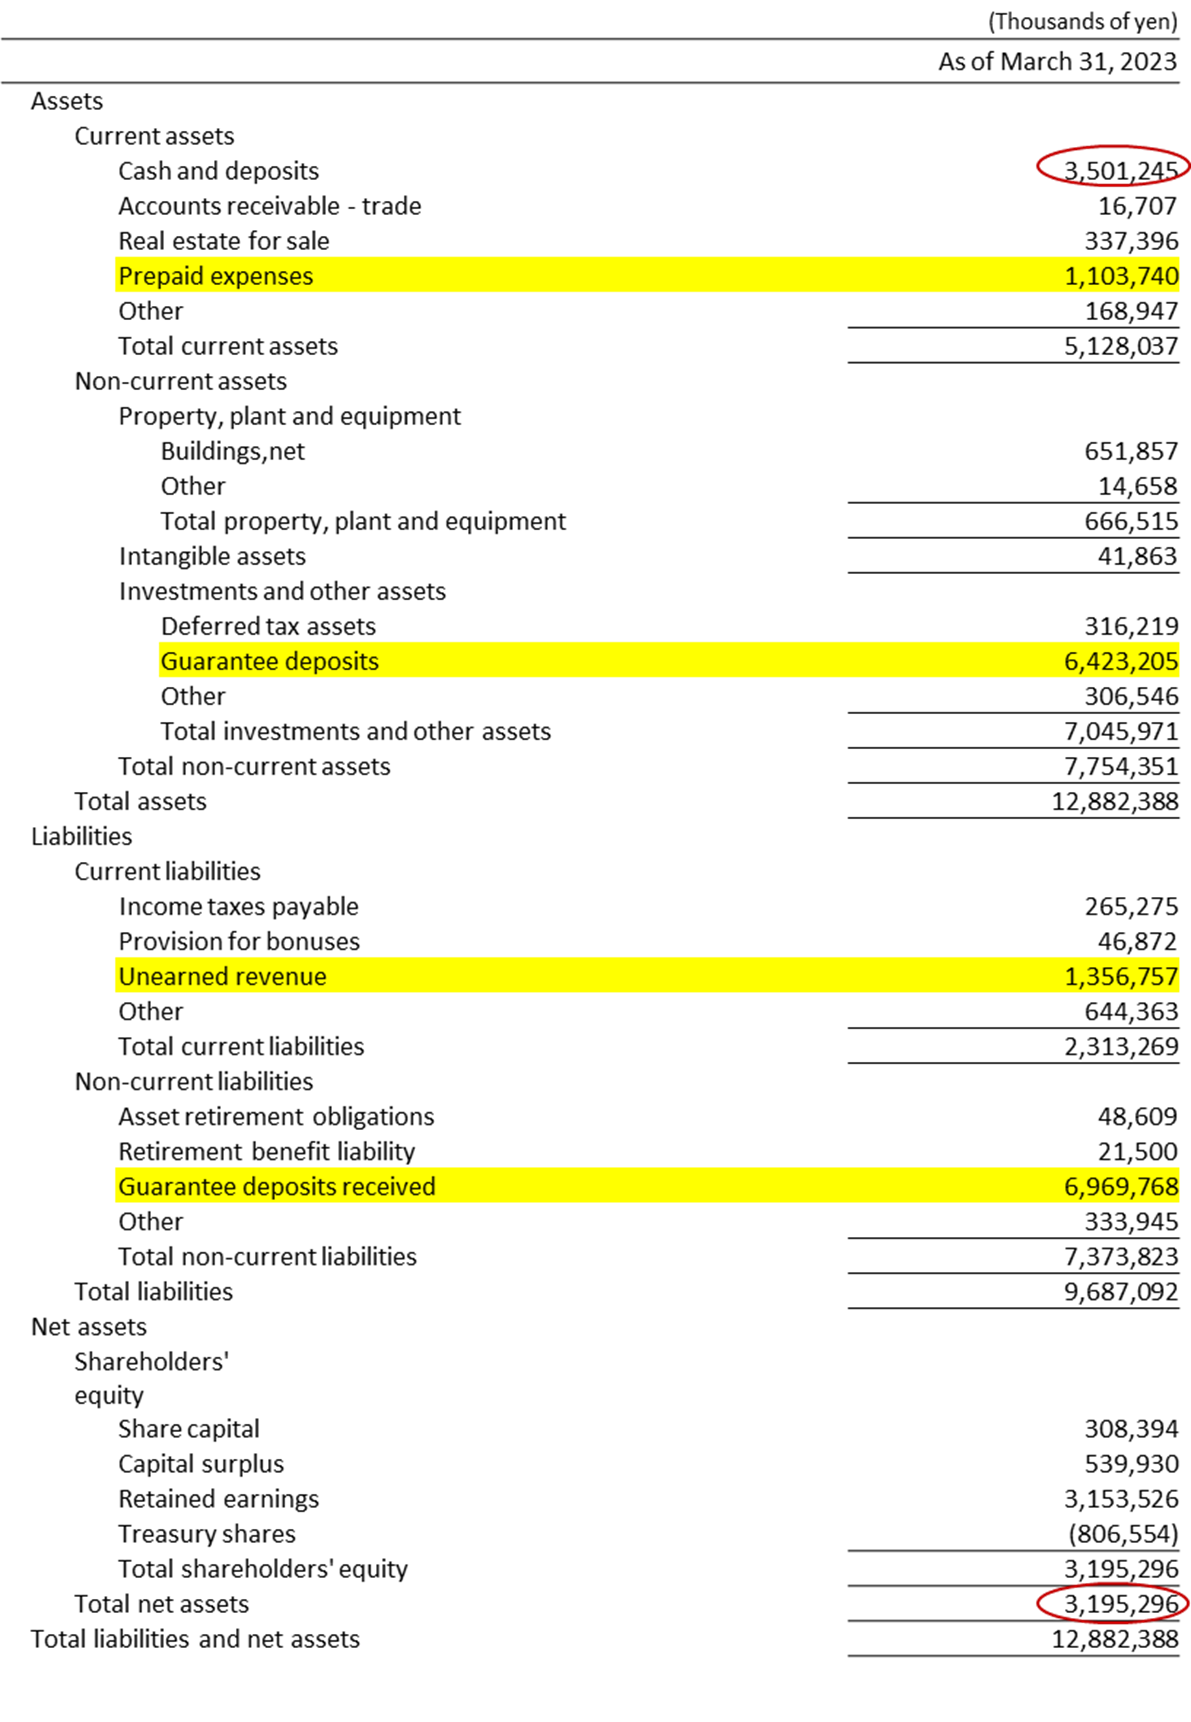
Source: Summary of Consolidated Financial Results (TANSHIN financial statements)
3Y Relative Share Price Performance and 5Y Trend of GP/OP and GPM/OPM
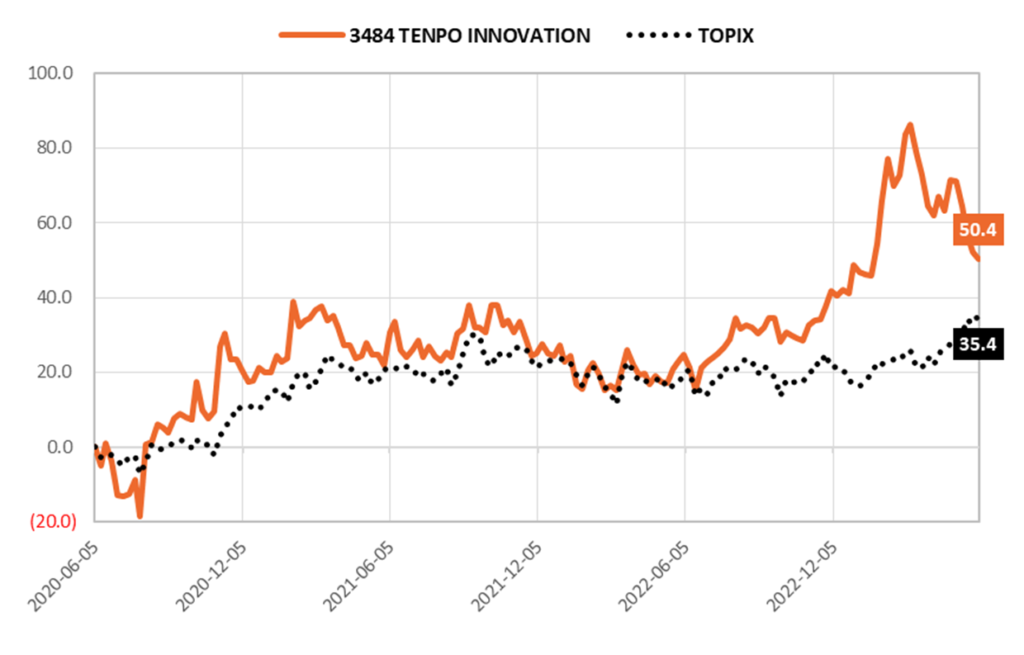
While there is a short-term adjustment after the two share buybacks in Feb (650k shares/3.65% of outstanding) and May (250k shares/1.47% of outstanding), Omega Investment believes the long-term opportunity from the graph on P3 offers large upside potential on a medium-term horizon.
REFERENCE
TENPO INNOVATION Medium-Term Management Plan
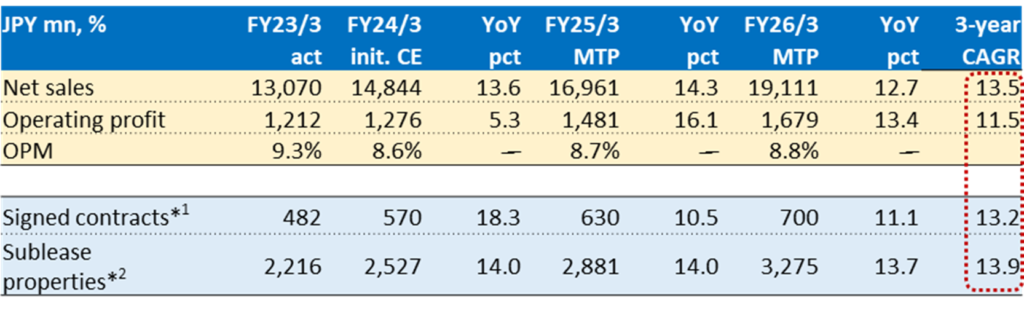
Note: *1 = new plus successor contracts signed. *2 = number of active sublease contracts at FY end.
Source: compiled by Omega Investment from IR results briefing materials.
Priority initiative to strengthen and enhance the sales force
The Company has the following medium-term and long-term targets.
By FY26/3, increase the Sales Dept. from 40 professionals to 100 (currently 14 in charge of property procurement → 30, 26 in charge of finding tenants → 70)
- Subleased store property net adds to 600 per year (by FY27/3)
- Contracts signed to 1,000 per year (by FY28/3)
By FY29/3, increase the number of active subleased store properties to 5,500
- Net sales ¥30 billion
- Operating profit ¥3 billion
- OPM 10.0%
As TENPO INNOVATION is the only specialist firm engaged in this restaurant store property subleasing business, this is no easy task, and cannot be accomplished by simply directing a headhunting firm to find the required personnel (they simply do not exist). Management fully recognizes that the way forward is to find suitable personnel and provide advanced level on-the-job training by existing professional staff. The point is that there is a lot of technical background knowledge required about property specifications such as the correct amperage requirements for electricity supply, drainage pipe diameter, etc., as well as expertise and know-how in retail properties, the restaurant industry, the city, restaurant facilities, and legal matters.
The Company summarizes its HR strategy for the Sales Dept. in a 3-point plan: ① increase staff, ② provide advanced OTJ training and ③ transfer capable sales staff to property procurement. Management envisions this extensive training for sales staff to find tenants for subleasing will take one year. Specifically, it will try to develop a standard method of passing on the expert knowledge involving the 237 items/steps from introduction of the property to concluding a subleasing agreement. Then, recognizing that procurement has a high level of difficulty and strategically holds the highest importance to future growth, it will optimize transfer and assignment of capable sales staff.
Then, in order to achieve the second long-term goal above of increasing the number of active subleased store properties to 5,500 by FY29/3, management will employ a strategy of ④ procurement area focus. Specifically, roughly 30 procurement staff will cover approximately 1,000 station areas and 2,000 real estate agents. For terminal stations with more than 1 million passengers and major real estate agencies, multiple procurement staff will be assigned. The target is to achieve procuring roughly 600 store properties per year (or 50 per month) by FY27/3.
Shareholder Return Policy
The Company’s basic policy is to pay stable dividends while strengthening its management base. The revised dividend policy from FY24/3 shown below aims to raise the target payout ratio from the 30% level ➡ the 40% level.
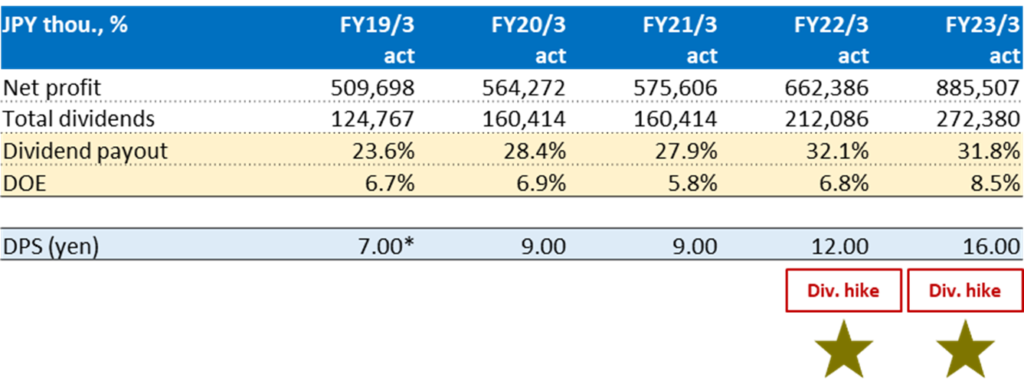
Source: compiled by Omega Investment from IR results briefing materials.
*Note: adjusted to reflect the stock split.
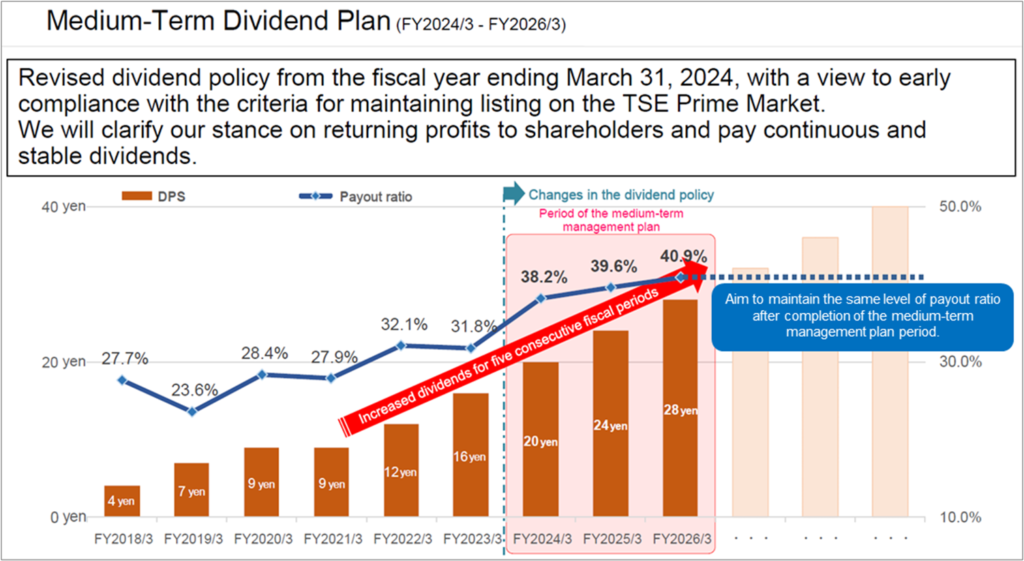
Source: excerpt from IR results briefing materials. Note: Figures from FY2023/3 onward are consolidated. Figures up to FY2022/3 are non-consolidated. Listed amounts for dividends per share have been retroactively adjusted to reflect stock splits. Dividends per share and dividend payout ratios during the medium-term management plan (FY2024/3 to FY2026/3) are company estimates.