2026-07-27
Home
Japanese

Omega Investment Co., Ltd.
Sansei Landic (Company Note 1Q update)

| Share price (22/6) | ¥913 | Dividend Yield (23/12 CE) | 3.50 % |
| 52weeks high/low | ¥934/800 | ROE(TTM) | 12.42 % |
| Avg Vol (3 month) | 23.9 thou shrs | Operating margin (TTM) | 12.18 % |
| Market Cap | ¥7.83 bn | Beta (5Y Monthly) | 0.53 |
| Enterprise Value | ¥20.00 bn | Shares Outstanding | 8.584 mn shrs |
| PER (23/12 CE) | 8.31 X | Listed market | TSE Standard |
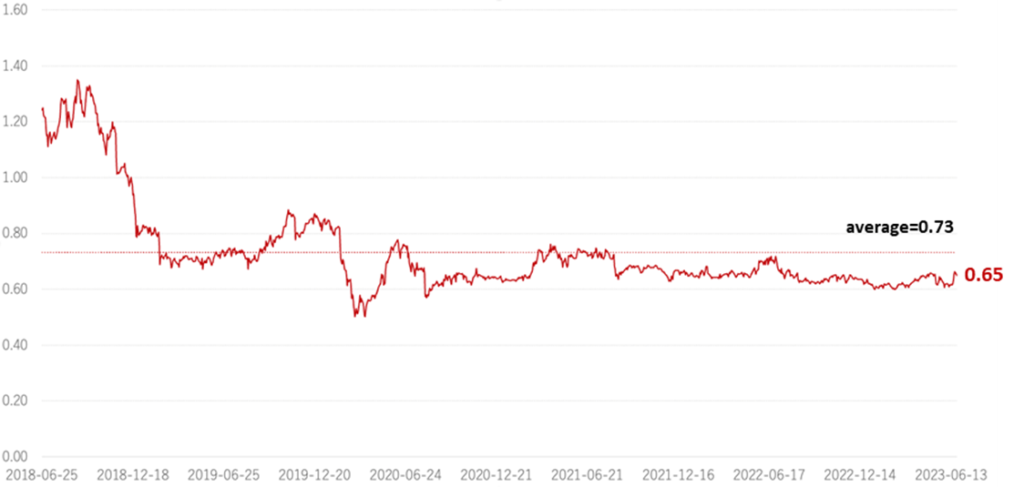
| PBR (22/12 act) | 0.65 X |
| Click here for the PDF version of this page |
| PDF Version |
Significant increase in sales and profits. The company revised up its forecasts.
◇ Summary of 1Q results for FY12/2023: Significant increase in sales and profit and upward revision of forecasts.
1Q results showed a significant increase in sales and profits, with sales of Leasehold land and Old unutilised properties increasing by more than 50% YoY. At the same time, the company upwardly revised up its 2Q and full-year forecasts. As in the previous year, purchase volume remained strong, and inventories reached a new record high.
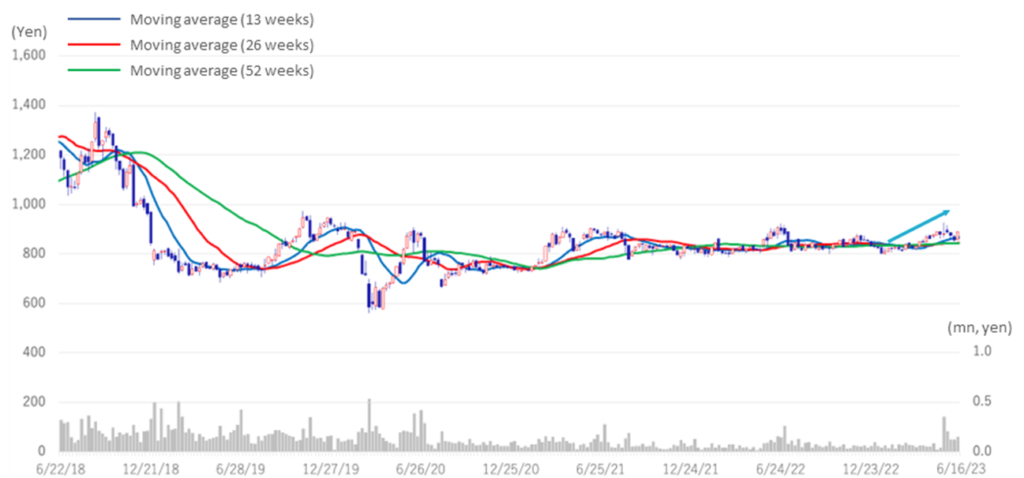
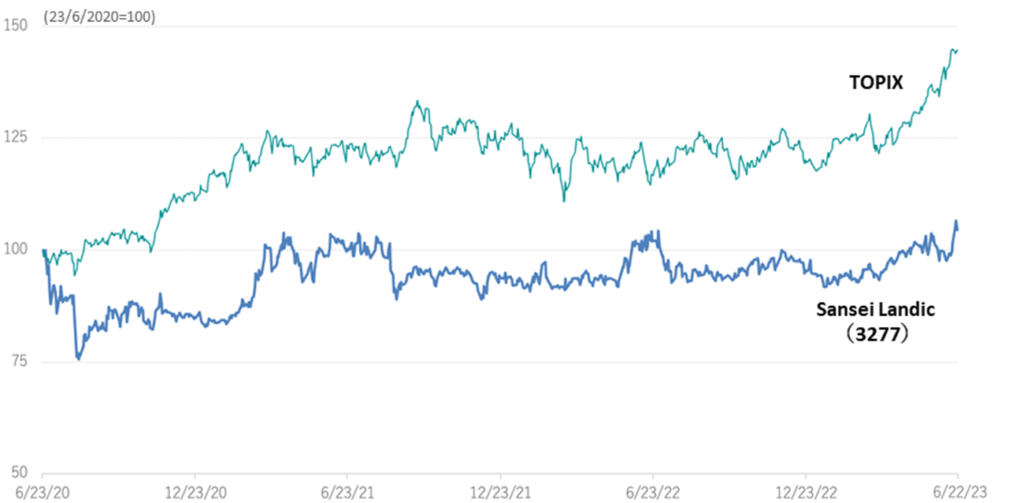
The company’s share price has increased since bottoming out at 802 yen on 13 January 2023. It temporarily hit a yearly high (at that time) of 927 yen before and after the announcement of financial results. In addition to abundant inventories, the strong property market has been a tailwind for the company’s good performance.
As part of the company’s review of its shareholder return policy, it has announced that it will pay a special dividend for the performance of FY12/2023 instead of abolishing its shareholder benefit plan. This should be received favourably, particularly by institutional investors.
◇ Financial results for 1Q FY12/2023: Sales up 45.9%, operating profit 2.5 times higher YoY.
Sales and profits significantly increased, with sales rising 45.9% YoY, to 6,486 million yen and operating profit growing by 150.0% to 1,118 million yen. Quarterly net income attributable to shareholders of the parent company rose 82.2% YoY to 683 million yen. Operating profit reached a record high on a quarterly basis.
As for sales by business segment, there was a significant increase in both Leasehold land (+50.9% YoY) and Old unutilised properties (+76.4% YoY). Since the 3Q of the previous year, the purchase volume of both segments has increased substantially, and inventories have built up, which has contributed to the significant increase in sales in the 1Q of the current fiscal year.
In BS, properties for sale increased by 746 million yen to 24,404 million yen from the end of FY12/2022. Around 90% of the properties were purchased within the last two years and are scheduled to be sold in the current or next financial year or later. Interest-bearing debt decreased by 337 million yen from the end of FY12/2022, as short-term borrowings increased by 602 million yen, while long-term borrowings decreased by 939 million due to the sale of large properties. Total assets increased by 650 million yen to 29,626 million yen. At the end of 1Q, the equity ratio was 39.0%, up 0.9 percentage points.
◇ Real Estate Sales business trends
The company will operate with a single segment of Real Estate Sales business from this year following the transfer at the end of March 2022 of all shares in One’s Life Home Co., Ltd., which runs a construction business. In 1Q FY12/2022, the construction business was included in sales. Sales of Real Estate Sales business alone increased by 53.6% YoY.
| JPY, mn | Net sales |
YoY % |
Oper. profit |
YoY % |
Ord. profit |
YoY % |
Profit ATOP |
YoY % |
EPS (¥) |
DPS (¥) |
| 2019/12 | 18,020 | 7.1 | 1,860 | 5.4 | 1,758 | 7.0 | 1,158 | 15.1 | 137.08 | 23.00 |
| 2020/12 | 17,774 | -1.4 | 847 | -54.5 | 709 | -59.7 | 357 | -69.1 | 42.34 | 25.00 |
| 2021/12 | 16,836 | -5.3 | 1,117 | 31.9 | 999 | 40.9 | 609 | 70.5 | 73.56 | 26.00 |
| 2022/12 | 15,513 | -7.7 | 1,469 | 31.5 | 1,283 | 28.4 | 1,060 | 73.9 | 129.61 | 28.00 |
| 2023/12 (Prev. CE) | 17,119 | 10.2 | 1,594 | 8.5 | 1,305 | 1.7 | 836 | -21.1 | 102.68 | 29.00 |
| 2023/12 (Revised CE) | 20,500 | 32.0 | 1,700 | 15.7 | 1,400 | 9.1 | 900 | -15.1 | 109.55 | 32.00 |
| 2022/12 1Q | 4,444 | -17.2 | 447 | -15.4 | 415 | -17.4 | 375 | 16.1 | 45.51 | – |
| 2023/12 1Q | 6,486 | 45.9 | 1,118 | 150.0 | 1,045 | 151.6 | 683 | 82.2 | 83.48 | – |
Quarterly sales and operating profit
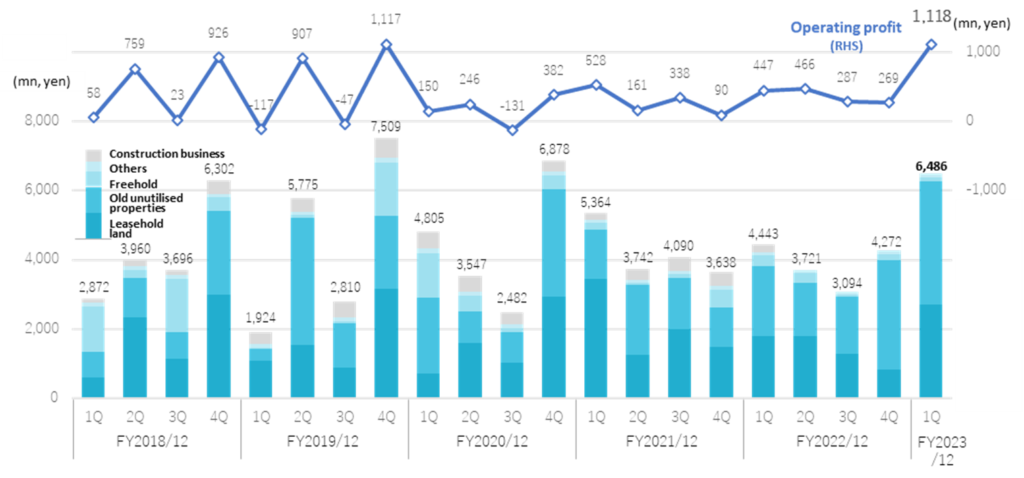
Source: Omega Investment from company materials.
Leasehold land : Sales were 2,707 million yen (+50.9%). Sales grew 50% YoY, backed by solid purchases in the recent time. This was also significantly higher than planned, exceeding the company estimate by 64.7%. The number of contracts increased by 17.4% to 101. Sales of Leasehold land in the Tokyo metropolitan area were robust. As a result, the profit margin also exceeded expectations.
Old unutilised properties: Sales recorded 3,571 million yen (+76.4%). Old unutilised properties have performed well, particularly in western Japan. The benefits of the reinforced sales structure in the region in recent years are becoming apparent. Sales came in 18.1% above the plan. The number of projects was 23, a significant increase of 130.0% YoY. Profits also erred on the upside.
Freehold: Sales were 101 million yen (-67.9%). Due to changes in the timing of property sales, sales, and profits were below forecasts and lower YoY.
◇ Purchase of real estate for sales :Significant increase in purchases of Leasehold land, reaching a record high
Purchases in Real Estate Sales business increased significantly by 71.3% YoY, recording 5,063 million yen.
Since 3Q FY12/2022, the purchase has remained high, exceeding 5 billion yen on a quarterly basis. This includes 3,486 million yen for Leasehold land (up 170.5%), 1,455 million yen for Old unutilised properties (up 5.2%), and 121 million yen for Freehold (down 57.1%). Purchasing of Leasehold land was particularly strong, with a record quarterly figure. Properties for sales also registered a record quarterly purchase.
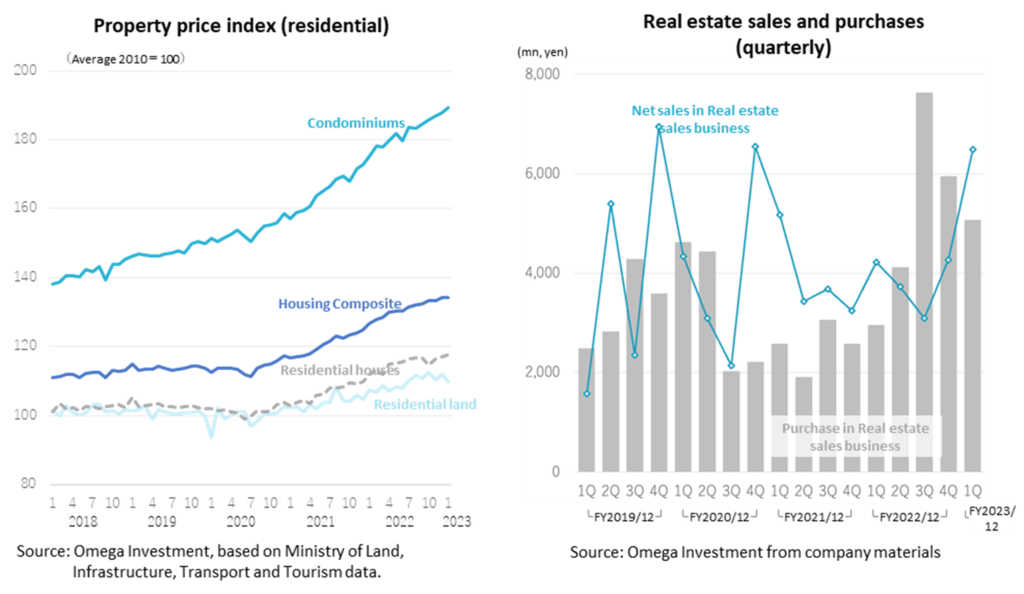
This is attributed to 1) the strong property market in recent years (see left-hand chart on the following page); 2) the expansion of large properties requiring a rights adjustment period of more than one year after risk management; and 3) the success of the strategic expansion of areas, which has led to a significant increase in purchases.
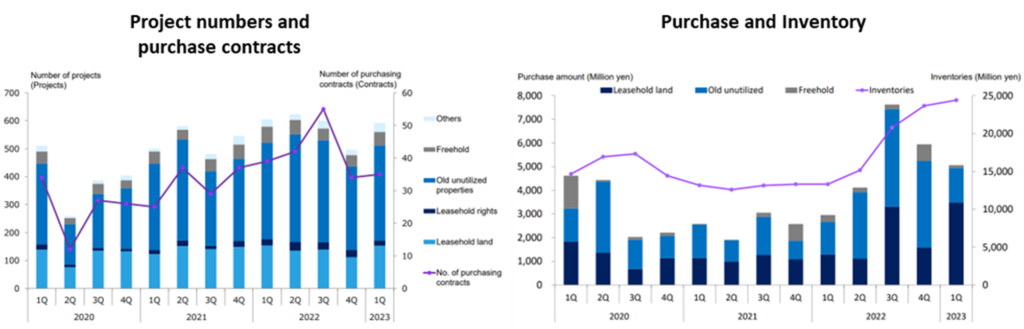
Source: company materials.
The company continues to purchase properties cautiously, looking to increase its inventory to sell them in the next financial year or later. Around 90% of the properties were purchased within the last two years. The company schedules to sell them in the current or next financial year or later.
The above right-hand chart shows the trend of purchases and sales in Real Estate Sales business. Purchases were low from 3Q FY12/2020 as a result of a slowdown in sales activities due to COVID-19 but had been recovering since the outset of FY12/2022. In particular, the company has been significantly increasing its purchase since the 3Q of FY12/2022, the benefits of which have kicked in the 1Q results.
◇ Forecasts for FY12/2023 :Significant upward revisions for both 1H and a full year.
The company has revised up its 1H and full-year forecasts for FY12/2023 in light of its 1Q performance and the current situation. See the table below for revised 1H forecasts. This is a significant upward revision of 33.0% for sales and more than 50% for operating income. YoY, sales are expected to increase by 40% and operating income by 50%. Regarding the 1Q progress ratios vs company forecasts, profit is notably fast, suggesting the likelihood of a further upward revision.
Revision of the consolidated forecast for 2Q (accumulative) FY12/2023.
| JPY, mn | Net sales | Oper. profit |
Ord. profit |
Profit ATOP |
EPS (¥) |
| Previous forecast (A) | 8,649 | 913 | 747 | 484 | 59.44 |
| Revised forecast (B) | 11,500 | 1,400 | 1,250 | 800 | 97.47 |
| Change (B – A) | 2,850 | 486 | 502 | 315 | – |
| Percentage change (%) | 33.0 | 53.2 | 67.3 | 65.2 | – |
| Actual results for 2Q FY12/2022 | 8,165 | 913 | 832 | 713 | 86.67 |
| Revised forecast, YoY (%) | 40.8 | 53.3 | 50.2 | 12.2 | 12.2 |
| Progress ratio as at 1Q (%) | 56.4 | 79.9 | 83.6 | 85.4 | – |
Source: company materials
See table on next page for revised full-year forecasts. This is an upward revision of 19.7% and 6.6% for sales and operating income, respectively. YoY, sales and operating income are expected to grow by 32.0% and 15.7%, respectively. As of 1Q, the company has made about 30% progress in terms of sales and about 2/3 in terms of operating income. As already mentioned, the company’s real estate inventory has built up significantly, and given that the real estate market remains strong, the revised estimates look achievable.
Revised full-year consolidated forecasts for FY12/2023.
| JPY, mn | Net sales | Oper. profit |
Ord. profit |
Profit ATOP |
EPS (¥) |
| Previous forecast (A) | 17,119 | 1,594 | 1,305 | 836 | 102.68 |
| Revised forecast (B) | 20,500 | 1,700 | 1,400 | 900 | 109.55 |
| Change (B – A) | 3,380 | 105 | 94 | 63 | – |
| Percentage change (%) | 19.7 | 6.6 | 7.3 | 7.6 | – |
| Actual results for FY12/2022 | 15,533 | 1,469 | 1,283 | 1,060 | 129.61 |
| Revised forecast, YoY (%) | 32.0 | 15.7 | 9.1 | -15.1 | -15.4 |
| Progress ratio as at 1Q (%) | 31.6 | 65.8 | 74.6 | 75.9 | – |
Source: company materials
◇ New shareholder return policy announced: shareholder benefit plans to be abolished and special dividends to be paid.
In conjunction with the announcement of its 1Q results, the company announced a new shareholder return policy. The shareholder benefit plan, which was previously in place, will be discontinued with the last distribution to shareholders as at end-June 2023. Instead, the company plans to pay a special dividend of 3 yen a share in addition to the ordinary dividend of 29 yen for the performance of FY12/2023. From FY12/2024 onwards, the company states it will further fulfil its shareholder return policy and may consider interim dividends and share buybacks.
Given that individual shareholders have favoured the company’s shareholder benefit plan, some investors may be disappointed, but it is in line with fairness and the demands of institutional investors.
The planned dividend for FY2023 is 29 yen of ordinary dividend plus a special dividend of 3 yen, for a total of 32 yen a share. This will mark the 10th consecutive year of dividend increases since 2013.
◇ Share price: Remains cheap, considering growth expectations for the next fiscal year and beyond
The company’s share price temporarily reached a yearly high of 927 yen around the announcement of the financial results. The share price has been hovering around 900 yen since then, bottoming out at 802 yen on 13 January 2023. The strong results and the upward earnings revisions have solidified the uptrend. In addition to an abundant inventory of both Leasehold land and Old unutilised properties, the property market is expected to remain strong for some time to come, which will also support good results and should prove positive for the share price.
Meanwhile, PBR of the company’s shares is 0.65, well below 1x and the average of the past five years (diagram below on the next page). In addition to the company’s strong performance, it has also shown a proactive attitude towards new shareholder return measures, and we expect the market to re-evaluate the company’s performance.
5-year stock price move
Share price compared to TOPIX (last three years)
Historical PBR (last five years)
Financial data (quarterly)
| FY (¥mn) | 2020/12 | 2021/12 | 2022/12 | 2023/12 | |||||||||
| 1Q | 2Q | 3Q | 4Q | 1Q | 2Q | 3Q | 4Q | 1Q | 2Q | 3Q | 4Q | 1Q | |
| [Sales by segment] | |||||||||||||
| Net sales | 4,807 | 3,546 | 2,481 | 6,938 | 5,365 | 3,744 | 4,089 | 3,637 | 4,444 | 3,721 | 3,094 | 4,272 | 6,486 |
| Year-on-year basis | 149.7% | -38.6% | -11.7% | -7.6% | 11.6% | 5.6% | 64.8% | -47.6% | -17.2% | -0.6% | -24.3% | 17.4% | 45.9% |
| Real estate sales business | 4,339 | 3,092 | 2,137 | 6,543 | 5,171 | 3,434 | 3,679 | 3,244 | 4,222 | 3,721 | 3,094 | 4,272 | 6,486 |
| Year-on-year basis | 175.3% | -42.7% | -9.2% | -5.7% | 19.2% | 11.1% | 72.1% | -50.4% | -18.3% | 8.3% | -15.9% | 31.7% | 53.6% |
| Sales composition ratio | 90.3% | 87.2% | 86.2% | 94.3% | 96.4% | 91.7% | 90.0% | 89.2% | 95.0% | 100.0% | 100.0% | 100.0% | 100.0% |
| Leasehold land | 719 | 1,613 | 1,044 | 2,950 | 3,464 | 1,267 | 2,003 | 1,474 | 1,793 | 1,794 | 1,284 | 832 | 2,707 |
| Year-on-year basis | -33.8% | 4.3% | 17.4% | -7.1% | 381.4% | -21.5% | 91.9% | -50.0% | -48.2% | 41.6% | -35.9% | -43.6% | 51.0% |
| Sales composition ratio | 15.0% | 45.5% | 42.1% | 42.5% | 64.6% | 33.8% | 49.0% | 40.5% | 40.3% | 48.2% | 41.5% | 19.5% | 41.7% |
| Old unutilised properties | 2,180 | 897 | 872 | 3,101 | 1,419 | 2,025 | 1,488 | 1,151 | 2,024 | 1,556 | 1,649 | 3,170 | 3,571 |
| Year-on-year basis | 520.6% | -75.5% | -32.0% | -47.1% | -34.9% | 125.8% | 70.6% | -62.9% | 42.6% | -23.2% | 10.8% | 175.4% | 76.4% |
| Sales composition ratio | 45.4% | 25.3% | 35.1% | 44.7% | 26.4% | 54.1% | 36.4% | 31.6% | 45.5% | 41.8% | 53.3% | 74.2% | 55.1% |
| Freehold | 1,305 | 465 | 106 | 395 | 191 | 46 | 101 | 526 | 315 | 266 | 49 | 157 | 101 |
| Year-on-year basis | 4560.7% | 428.4% | 92.7% | -74.2% | -85.3% | -90.1% | -4.7% | 33.2% | 64.9% | 478.3% | -51.5% | -70.2% | -67.9% |
| Sales composition ratio | 27.1% | 13.1% | 4.3% | 5.7% | 3.6% | 1.2% | 2.5% | 14.5% | 7.1% | 7.1% | 1.6% | 3.7% | 1.6% |
| Others | 133 | 117 | 116 | 97 | 96 | 95 | 88 | 94 | 89 | 105 | 112 | 114 | 106 |
| Year-on-year basis | 21.5% | 12.5% | -7.9% | -23.0% | -28.3% | -18.8% | -24.1% | -3.1% | -7.3% | 10.5% | 27.3% | 21.3% | 19.1% |
| Sales composition ratio | 2.8% | 3.3% | 4.7% | 1.4% | 1.8% | 2.5% | 2.2% | 2.6% | 2.0% | 2.8% | 3.6% | 2.7% | 1.6% |
| Construction business | 468 | 455 | 343 | 395 | 194 | 309 | 409 | 392 | 222 | – | – | – | – |
| Year-on-year basis | 34.1% | 19.8% | -24.9% | -30.1% | -58.4% | -32.1% | 19.3% | -0.8% | 14.0% | – | – | – | – |
| Sales composition ratio | 9.7% | 12.8% | 13.8% | 5.7% | 3.6% | 8.3% | 10.0% | 10.8% | 5.0% | – | – | – | – |
| [Statements of income] | |||||||||||||
| Net sales | 4,807 | 3,546 | 2,481 | 6,938 | 5,365 | 3,744 | 4,089 | 3,637 | 4,444 | 3,721 | 3,096 | 4,272 | 6,486 |
| Cost of sales | 3,865 | 2,557 | 1,934 | 5,431 | 4,020 | 2,756 | 2,945 | 2,745 | 3,146 | 2,310 | 1,963 | 3,066 | 4,320 |
| Gross profit | 942 | 989 | 548 | 1,507 | 1,344 | 986 | 1,143 | 892 | 1,297 | 1,411 | 1,132 | 1,206 | 2,166 |
| SG&A expenses | 792 | 744 | 678 | 925 | 816 | 826 | 805 | 802 | 850 | 946 | 845 | 937 | 1,084 |
| Operating income | 150 | 245 | -131 | 382 | 528 | 160 | 338 | 90 | 447 | 466 | 287 | 269 | 1,118 |
| Non-operating income | 9 | 5 | 51 | 5 | 12 | 8 | 8 | 6 | 7 | 7 | 6 | 7 | 8 |
| Non-operating expenses | 55 | 63 | 60 | 10 | 37 | 40 | 34 | 39 | 39 | 55 | 54 | 64 | 80 |
| Ordinary income | 103 | 188 | -140 | 298 | 502 | 128 | 311 | 56 | 415 | 417 | 239 | 212 | 1,045 |
| Extraordinary income | 0 | 0 | 0 | 3 | 0 | 0 | 0 | 19 | 0 | 0 | 1 | – | |
| Extraordinary expenses | 0 | 0 | 0 | 0 | 0 | 8 | 7 | – | |||||
| Loss before income taxes | 103 | 188 | -140 | 298 | 506 | 128 | 311 | 56 | 435 | 399 | 231 | 205 | 1,045 |
| Total income taxes | 36 | 72 | -49 | 295 | 183 | 48 | 166 | -4 | 59 | 60 | 36 | 54 | 361 |
| Net income | 67 | 114 | -90 | 176 | 323 | 79 | 145 | 61 | 375 | 338 | 196 | 151 | 683 |
| [Balance Sheets] | |||||||||||||
| Current assets | 18,816 | 20,798 | 20,577 | 19,040 | 17,554 | 17,371 | 18,769 | 18,968 | 19.018 | 21,579 | 26,379 | 27,929 | 28,392 |
| Property for sale | 14,655 | 16,923 | 17,312 | 14,424 | 13,493 | 12,586 | 13,134 | 13,301 | 13,304 | 15,152 | 20,775 | 23,657 | 24,404 |
| Non-current assets | 1,188 | 1,164 | 1,197 | 1,030 | 951 | 1,054 | 1,081 | 1,082 | 1,124 | 1,099 | 1,129 | 1,047 | 1,233 |
| Tangible assets | 451 | 449 | 443 | 306 | 291 | 290 | 293 | 301 | 317 | 313 | 314 | 299 | 312 |
| Investments and other assets | 668 | 653 | 691 | 655 | 595 | 703 | 732 | 730 | 761 | 743 | 769 | 701 | 873 |
| Total assets | 20,004 | 21,962 | 21,774 | 20,071 | 18,505 | 18,425 | 19,849 | 20,051 | 20,134 | 22,678 | 27,508 | 28,976 | 29,626 |
| Current liabilities | 9,883 | 7,767 | 7,699 | 5,772 | 5,517 | 7,540 | 8,633 | 8,731 | 8,153 | 8,871 | 11,168 | 12,606 | 13,658 |
| Short-term borrowings | 7,729 | 6,352 | 6,676 | 4,463 | 4,272 | 6,105 | 7,171 | 7,367 | 5,025 | 5,057 | 6,960 | 10,192 | 11,151 |
| Non-current liabilities | 345 | 4,303 | 4,274 | 4,232 | 2,919 | 792 | 976 | 1,017 | 1,525 | 3,114 | 5,453 | 5,314 | 4,405 |
| Long-Term Borrowings | 3,958 | 3,929 | 3,879 | 2,570 | 483 | 683 | 740 | 1,260 | 2,827 | 5,153 | 5,033 | 4,093 | |
| Total liabilities | 10,228 | 12,071 | 11,973 | 10,004 | 8,436 | 8,332 | 9,609 | 9,749 | 9.679 | 11,968 | 16,622 | 17,920 | 18,064 |
| Total net assets | 9,776 | 9,891 | 9,801 | 10,067 | 10,070 | 10,093 | 10,240 | 10,301 | 10,463 | 10,692 | 10,886 | 11,056 | 11,561 |
| Total shareholders’ equity | 9,776 | 9,891 | 9,801 | 10,067 | 10,070 | 10,093 | 10,240 | 10,297 | 10,459 | 10,688 | 10,882 | 11,052 | 11,562 |
| Capital stock | 818 | 818 | 818 | 818 | 818 | 820 | 820 | 820 | 821 | 822 | 824 | 833 | 860 |
| Legal capital reserve | 779 | 779 | 779 | 779 | 779 | 781 | 781 | 781 | 782 | 785 | 786 | 796 | 823 |
| Retained earnings | 8,174 | 8,289 | 8,200 | 8,465 | 8,577 | 8,656 | 8,802 | 8,863 | 9,023 | 9,362 | 9,557 | 9,708 | 10,164 |
| Stock acquisition right | 4 | 4 | 4 | 4 | 4 | 4 | 4 | 4 | 4 | 3 | 3 | 3 | – |
| Total liabilities and net assets | 20,004 | 21,962 | 21,774 | 20,071 | 18,505 | 18,425 | 19,849 | 20,051 | 20,134 | 22,678 | 27,508 | 28,976 | 29,626 |
| [Statements of cash flows] | |||||||||||||
| Cash flow from operating activities | -3,683 | -916 | 2,110 | 1,704 | 1,184 | -9,267 | |||||||
| Loss before income taxes | 291 | 712 | 635 | 1,003 | 833 | 1,269 | |||||||
| Cash flow from investing activities | -9 | -287 | -26 | -51 | -205 | -266 | |||||||
| Cash flow from financing activities | 3,021 | 952 | -2,129 | -608 | -559 | 7,971 | |||||||
| Net increase in cash and cash equiv. | -671 | -251 | -46 | 1,045 | 420 | -1,563 | |||||||
| Cash and cash equiv. at beginning of period |
3,958 | 3,958 | 3,707 | 3,707 | 4,752 | 4,752 | |||||||
| Cash and cash equiv. at end of period |
3,287 | 3,707 | 3,661 | 4,752 | 5,173 | 3,188 | |||||||
Source: Omega Investment from company materials
Financial data
| FY (¥mn) | 2011/12 | 2012/12 | 2013/12 | 2014/12 | 2015/12 | 2016/12 | 2017/12 | 2018/12 | 2019/12 | 2020/12 | 2021/12 | 2022/12 |
| [Statements of income] | ||||||||||||
| Net sales | 8,042 | 9,475 | 9,187 | 10,443 | 11,567 | 12,300 | 13,098 | 16,833 | 18,020 | 17,774 | 16,836 | 15,533 |
| YoY change (%) | 8.5 | 17.8 | -3.0 | 13.7 | 10.8 | 6.3 | 6.5 | 28.5 | 7.1 | -1.4 | -5.3 | -7.7 |
| Cost of sales | 5,557 | 7,061 | 6,254 | 7,055 | 7,798 | 8,344 | 8,566 | 12,028 | 12,902 | 13,788 | 12,467 | 10,485 |
| Gross profit | 2,485 | 2,415 | 2,934 | 3,389 | 3,769 | 3,957 | 4,532 | 4,805 | 5,119 | 3,986 | 4,368 | 5,047 |
| SG&A expenses | 1,735 | 1,898 | 2,014 | 2,184 | 2,470 | 2,510 | 2,770 | 3,039 | 3,258 | 3,139 | 3,250 | 3,578 |
| Operating income | 750 | 517 | 920 | 1,205 | 1,300 | 1,446 | 1,762 | 1,766 | 1,861 | 847 | 1,117 | 1,469 |
| YoY change (%) | 14.5 | 31.0 | 77.9 | 30.9 | 7.9 | 11.3 | 21.9 | 0.2 | 5.4 | -54.5 | 31.9 | 31.5 |
| Operating income margin (%)) | 9.3 | 5.5 | 10.0 | 11.5 | 11.2 | 11.8 | 13.5 | 10.5 | 10.3 | 4.8 | 6.6 | 9.5 |
| Non-operating income | 135 | 5 | 12 | 14 | 15 | 15 | 12 | 28 | 42 | 88 | 34 | 26 |
| Non-operating expenses | 138 | 85 | 122 | 174 | 118 | 133 | 106 | 150 | 144 | 226 | 152 | 212 |
| Ordinary income | 747 | 437 | 810 | 1,044 | 1,196 | 1,329 | 1,669 | 1,643 | 1,759 | 709 | 999 | 1,283 |
| Extraordinary income | 54 | 23 | 97 | 32 | 3 | 20 | ||||||
| Extraordinary expenses | 4 | 17 | 94 | 104 | 29 | 33 | ||||||
| Loss before income taxes | 797 | 443 | 810 | 1,044 | 1,196 | 1,329 | 1,672 | 1,539 | 1,759 | 712 | 1,003 | 1,269 |
| Total income taxes | 353 | 209 | 354 | 418 | 472 | 475 | 561 | 533 | 600 | 355 | 394 | 209 |
| Net income attributable to owner of parent |
444 | 233 | 456 | 626 | 724 | 854 | 1,111 | 1,007 | 1,159 | 358 | 609 | 1,060 |
| YoY change (%) | 47.6 | 47.5 | 95.4 | 37.5 | 15.6 | 17.9 | 30.2 | -9.4 | 15.1 | -69.1 | 70.5 | 73.9 |
| Margin (%) | ||||||||||||
| [Balance Sheets] | ||||||||||||
| Current assets | 5,251 | 6,257 | 8,023 | 7,836 | 10,366 | 9,749 | 15,874 | 15,745 | 18,094 | 19,040 | 18,968 | 27,929 |
| Property for sale | 3,698 | 4,834 | 6,346 | 5,166 | 7,699 | 6,877 | 11,863 | 11,678 | 13,493 | 14,424 | 13,301 | 23,657 |
| Non-current assets | 834 | 836 | 895 | 957 | 1,031 | 1,083 | 1,042 | 1,032 | 1,199 | 1,030 | 1,082 | 1,047 |
| Tangible assets | 136 | 135 | 569 | 603 | 572 | 591 | 467 | 458 | 456 | 306 | 301 | 299 |
| Investments and other assets | 612 | 622 | 226 | 258 | 383 | 405 | 494 | 505 | 669 | 655 | 730 | 701 |
| Total assets | 6,085 | 7,093 | 8,919 | 8,793 | 11,398 | 10,833 | 16,916 | 16,777 | 19,294 | 20,071 | 20,050 | 28,976 |
| Current liabilities | 2,663 | 3,098 | 4,587 | 3,165 | 4,910 | 3,751 | 8,430 | 6,160 | 9,047 | 5,772 | 8,731 | 12,606 |
| Short-term borrowings | 1,733 | 2,095 | 3,362 | 2,094 | 3,778 | 2,624 | 7,076 | 4,728 | 7,203 | 4,462 | 5,544 | 10,192 |
| Non-current liabilities | 181 | 562 | 465 | 367 | 453 | 226 | 479 | 1,710 | 351 | 4,232 | 1,017 | 5,314 |
| Long-Term Borrowings | 147 | 526 | 419 | 320 | 180 | 88 | 364 | 1,320 | 3,879 | 740 | 5,033 | |
| Total liabilities | 2,845 | 3,660 | 5,051 | 3,531 | 5,363 | 3,977 | 8,909 | 7,869 | 9,399 | 10,004 | 9,748 | 17,920 |
| Total net assets | 3,241 | 3,433 | 3,868 | 5,262 | 6,034 | 6,856 | 8,006 | 8,908 | 9,894 | 10,066 | 10,301 | 11,056 |
| Total shareholders’ equity | 3,241 | 3,433 | 3,868 | 5,262 | 6,034 | 6,852 | 8,002 | 8,904 | 9,890 | 10,062 | 10,297 | 11,052 |
| Capital stock | 257 | 257 | 257 | 661 | 710 | 720 | 788 | 811 | 814 | 818 | 820 | 833 |
| Legal capital reserve | 218 | 218 | 218 | 622 | 671 | 681 | 749 | 772 | 775 | 779 | 781 | 796 |
| Retained earnings | 2,766 | 2,958 | 3,393 | 3,978 | 4,654 | 5,451 | 6,464 | 7,320 | 8,302 | 8,465 | 8,863 | 9,708 |
| Stock acquisition right | 4 | 4 | 4 | 4 | 4 | 4 | 3 | |||||
| Total liabilities and net assets | 6,085 | 7,093 | 8,919 | 8,793 | 11,398 | 10,833 | 16,916 | 16,777 | 19,294 | 20,071 | 20,050 | 28,976 |
| Equity ratio (%) | 53.3 | 48.4 | 43.4 | 59.8 | 52.9 | 63.3 | 47.3 | 53.1 | 51.3 | 50.1 | 51.4 | 38.1 |
| [Statements of cash flows] | ||||||||||||
| Cash flow from operating activities | 970 | -953 | -664 | 1,761 | -1,451 | 1,611 | -3,666 | 1,617 | -420 | -917 | 1,704 | -9,267 |
| Loss before income taxes | 797 | 443 | 810 | 1,044 | 1,196 | 1,329 | 1,672 | 1,539 | 1,759 | 712 | 1,003 | 1,269 |
| Cash flow from investing activities | 127 | -15 | -175 | -111 | -116 | -184 | 107 | -64 | -71 | -288 | -51 | -266 |
| Cash flow from financing activities | -877 | 692 | 1,136 | -612 | 1,588 | -1,278 | 4,667 | -1,495 | 984 | 953 | -608 | 7,971 |
| Issuance of shares | 406 | 800 | 97 | 21 | 37 | 45 | 6 | 9 | ||||
| Net increase in cash and cash equiv. | 219 | -276 | 296 | 1,039 | 22 | 150 | 1,108 | 58 | 493 | -251 | 1,045 | -1,563 |
| Cash and cash equiv. at beginning of period |
850 | 1,069 | 793 | 1,089 | 2,128 | 2,150 | 2,299 | 3,407 | 3,465 | 3,959 | 3,707 | 4,752 |
| Cash and cash equiv. at end of period |
1,069 | 793 | 1,089 | 2,128 | 2,150 | 2,299 | 3,407 | 3,465 | 3,959 | 3,707 | 4,752 | 3,188 |
| Free cash flow | 1,097 | -968 | -839 | 1,650 | -1,567 | 1,427 | -3,559 | 1,553 | -491 | -1,205 | 1,653 | -9,533 |
Source: Omega Investment from company materials