2026-07-27
Home
Japanese

Omega Investment Co., Ltd.
Chiome Bioscience (Company note – 2Q update)

| Share price (9/20) | ¥152 | Dividend Yield (23/12 CE) | – % |
| 52weeks high/low | ¥261/135 | ROE(TTM) | -86.66 % |
| Avg Vol (3 month) | 3,342 thou shrs | Operating margin (TTM) | -160.13 % |
| Market Cap | ¥7.5 bn | Beta (5Y Monthly) | 0.91 |
| Enterprise Value | ¥6.5 bn | Shares Outstanding | 49.323 mn shrs |
| PER (23/12 CE) | – X | Listed market | TSE Growth |
| PBR (22/12 act) | 6.51 X |
| Click here for the PDF version of this page |
| PDF Version |
Drug Discovery Support Business continues to expand.
Steady progress in each pipeline.
◇Summary of 2Q results of FY12/2023.
In 2Q FY12/2023, Chiome Bioscience’s Drug Discovery Support Business continued to perform well, with sales increasing by approximately 30% YoY. The operating loss narrowed. Also, in Drug Discovery and Development Business, the company’s main business, each pipeline made steady progress. Furthermore, PFKR, a therapeutic antibody that inhibits the progression of pathological conditions such as autoimmune neurological diseases, was added as a new pipeline product. The second half of the Phase I clinical trial of CBA-1205, the most promising candidate for out-licensing in the near future, is also progressing steadily, and out-licensing agreements are expected to be concluded after multiple PR cases (partial response: tumor reduction of 30% or more) are obtained.
The company’s share price has been volatile due to events such as earnings announcements but is recently trading somewhat above the bottom of 150 yen. As known, it is difficult to achieve results in Drug Discovery and Development Business in a short time, and it is vital to assess the progress of each pipeline and the potential for out-licensing. In this context, there are many positive signs in the clinical trials for CBA-1205. The company is expected to maximise value at the time of future out-licensing, and the possibility of upfront payment for out-licensing is getting into sight in the not-too-distant future. Hence, the current share price looks attractive.
◇ Results for 2Q FY12/2023: Drug Discovery Support Business is expanding steadily, with sales increasing by approximately 30%.
The company’s 2Q results for FY12/2023 were sales of 358 million yen (+29.0% YoY), an operating loss of 659 million yen (vs an operating loss of 779 million yen in the previous year) and a net loss of 663 million yen (vs. a net loss of 771 million yen in the last year). In this 2Q, sales related to Drug Discovery and Development Business, such as upfront licensing payments and milestone income, were not recorded, and only sales from Drug Discovery Support Business were recorded. This business is growing steadily.
For information on the progress of each pipeline in Drug Discovery and Development Business, see the diagram on the next page. Each pipeline progresses well, but no sales were recorded during 2Q FY12/2023. Research and development costs included in SG&A expenses amounted to 601 million yen (YoY decrease of 89 million yen), with a reduction of CMC-related costs for CBA-1535, which were recorded in the same period of the previous year. As a result, the segment loss for the business amounted to 601 million yen, corresponding to research and development costs.
Drug Discovery Support Business provides contract antibody production, antibody affinity enhancement and protein preparation services using the company’s antibody production technology platform, centred on the ADLib® system, which is the company’s proprietary antibody generation method, and provides research support to major domestic pharmaceutical companies in relation to antibody drugs. The stable revenue generated by Drug Discovery Support Business helps to secure research and development expenditure for Drug Discovery and Development Business. The business is steadily increasing the number of transactions and projects. In 2Q, the company signed a new comprehensive outsourcing contract with a major domestic pharmaceutical company and started new outsourcing work with a domestic diagnostics company. As a result, sales in 2Q FY12/2023 amounted to 358 million yen (an increase of 80 million yen YoY) and segment profit to 208 million yen (an increase of 57 million yen YoY). The segment profit margin was 58.1%, meeting the target of 50%.
| JPY, mn, % | Net sales | YoY % |
Oper. profit |
YoY % |
Ord. profit |
YoY % |
Profit ATOP |
YoY % |
EPS (¥) |
| 2019/12 | 447 | 110.3 | -1,401 | – | -1,410 | – | -1,403 | – | -44.61 |
| 2020/12 | 480 | 7.4 | -1,283 | – | -1,291 | – | -1,293 | – | -36.06 |
| 2021/12 | 712 | 48.3 | -1,334 | – | -1,329 | – | -1,479 | – | -36.74 |
| 2022/12 | 630 | -11.5 | -1,258 | – | -1,243 | – | -1,242 | – | -28.26 |
| 2023/12 (CE) | – | – | – | – | – | – | – | – | – |
| 2022/12 2Q | 278 | -27.7 | -779 | – | -768 | – | -771 | – | -18.17 |
| 2023/12 2Q | 358 | 29.0 | -659 | – | -662 | – | -663 | – | -13.70 |
Note: The company discloses only the estimates for the Drug Discovery Support business (sales of 640 million yen), as it is difficult to make reasonable forecasts for the drug discovery and development business.
Drug discovery and development business – pipeline
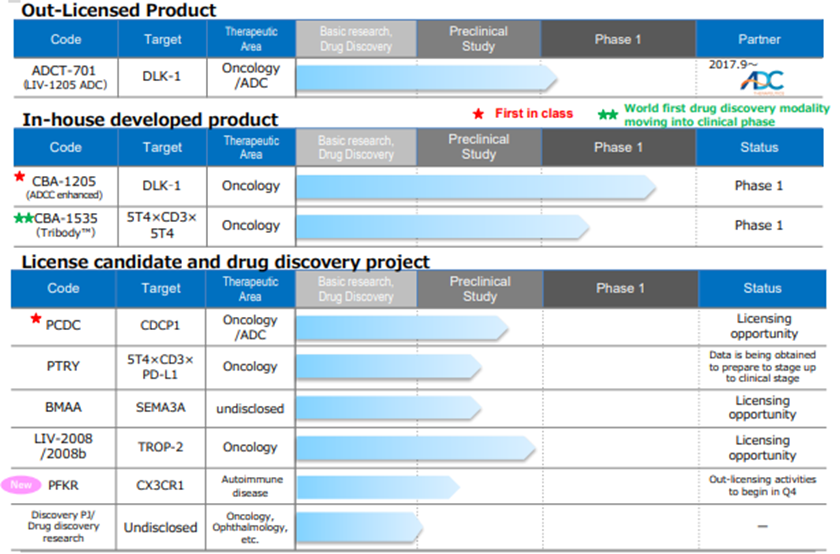
As of August. 9, 2023
Source: Supplementary financial data for 2Q of FY12/2023 (dated 9 August 2023)
In BS, total assets at end-June 2023 amounted to 1,685 million yen. This is a decrease of 529 million yen compared to end-December 2022. Cash and deposits amounted to 1,245 million yen (end-December 2022: 1,727 million yen). As usual, total assets are decreasing due to continued expenditure on research and development.
◇Progress in the pipeline: The company extends the development plan to maximise the value of CBA-1205 for out-licensing.
<In-house developed products>.
*CBA–1205; Phase 1 clinical trial shows positive signs. Aiming to maximise upfront licensing payments by winning multiple PR cases.
CBA-1205 Clinical development
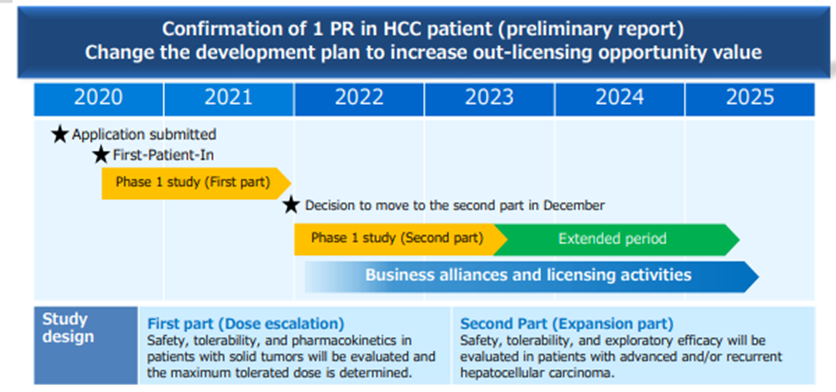
Source: Supplementary financial data for 2Q of FY12/2023 (dated 9 August 2023)
CBA-1205 is being tested in the first part of Phase 1 clinical trial in patients with solid tumours at the National Cancer Centre. The second part of the study is conducted in patients with hepatocellular carcinoma. The first part of the study has already shown a high safety profile, and the melanoma patients enrolled in the study have continued to receive the drug for more than 24 months with SD (stable) evaluation with tumour shrinkage, which is still ongoing.
In addition, PR (partial response: tumour reduction of 30% or more) was confirmed in one patient with hepatocellular carcinoma enrolled in the latter part of the study. It was decided to manufacture an additional investigational drug for long-term treatment cases. In addition, it was decided to tighten the selection criteria for patients enrolled in the trial and extend the trial period to analyse the scientific relationship between PR cases and the drug’s administration to verify the drug’s potential as a therapeutic agent. However, the out-licensing schedule remains the same.
The company intends to continue the development of each pipeline by dividing its out-licensing activities into two categories: those aimed at early out-licensing and those aimed at increasing the economic value at the time of out-licensing by promoting in-house R&D activities and acquiring more cases. For CBA-1205, the company aims to maximise the upfront payment for out-licensing by targeting a group of companies that emphasise business feasibility and probability of success, as the company’s own clinical trials are progressing well.
*CBA–1535; First half of Phase I clinical trials (single agent)
The company submitted a clinical trial plan notification to the PMDA in February 2022. It started Phase I clinical trials at the National Cancer Centre Hospital and Shizuoka Cancer Centre from the end of June. In the first half of Phase I clinical trial, safety and efficacy signals were evaluated in patients with solid tumours. The drug will be administered in stages, starting from a low volume to find the maximum dose that can be safely administered and to assess the initial drug effect signal. The second part will assess efficient drug efficacy with immuno-oncology drugs. The company had previously planned to start the second part in parallel with the first part but has now changed its plan to start the second part after confirming the efficacy signal in the first part. The second part will begin in 2024. The schedule change is intended to enable the company to reasonably control its clinical development investment, considering the possibility of out-licensing the drug.
CBA-1535 is the world’s first clinical trial for TribodyTM and, if the concept is confirmed, will expand the applicability of TribodyTM to many cancer antigens . Combining the number of binding targets and the number of moves to which they bind is expected to provide benefits beyond conventional antibodies. Through the combined administration of multiple drugs, multiple medicinal effects can be expected from administering only one drug, which is expected to improve a patient’s quality of life and provide health economics benefits.
< Out-licenced products >
*LIV-1205; Licensed to ADC Therapeutics, Switzerland, for ADC use only; ADCT, in collaboration with the National Cancer Institute (NCI), is preparing for a clinical trial in neuroblastoma, with a Phase 1 clinical entry trial scheduled to start during 2023. Given ADCT’s financial situation, NCI will take the lead in the development of the study, and there are currently no significant changes.
< Out-licensing candidates >
*PCDC; Promoting licensing activities focusing on ADC applications and accumulating animal test data. At national and international conferences, the company contacts pharmaceutical companies that want to expand their pipelines as ADCs and pharmaceutical companies that want antibodies for ADCs with their own ADC technology as their out-licensing strategy and target. As there is a high need for development by combining the company’s antibodies with the ADC technology of the licensing partner companies, the company has decided to prioritise licensing activities to pharmaceutical companies that have their own ADC technology and want antibodies for their ADCs.
*PTRY; Creation of highly active TribodyTM antibodies by new molecule combination. PTRY, which targets 5T4xCD3xPD L1, was added as a new pipeline product in 2022. Results of joint research on cancer immunotherapy conducted with the Italian public research institute Ceinge-Biotechnologie Avanzate were published in the Journal of Experimental & Clinical Cancer Research, an international journal. A patent application has been completed for the results obtained through this collaboration. In vivo efficacy data in lung cancer models have confirmed that it exerts a strong tumour growth inhibitory effect.
*PFKR; New pipeline. PFKR targets CX3CR1, a type of GPCR, as a therapeutic target and is a new out-licensing candidate in the autoimmune CNS area that we are collaborating with National Institute of Neurology and Psychiatry. The expected indications include secondary progressive multiple sclerosis (SPMS). A patent application has already been filed. The number of patients with multiple sclerosis is estimated to be around 7,000 in Japan and more than 3 million worldwide.
◇Progress in Drug Discovery Support Business: New master service agreements signed with major Japanese pharmaceutical companies.
Drug Discovery Support Business recorded sales of 358 million yen, an increase of approximately 30% YoY, as mentioned above. The company has earned a high reputation for its technical service capabilities among major Japanese pharmaceutical companies, and business with existing customers has steadily increased. In 2Q, the company signed a new comprehensive outsourcing contract with a major Japanese pharmaceutical company and started new outsourcing services with a domestic diagnostics company. Drug Discovery Support Business is also making steady progress.
◇ Forecasts for FY12/2023: Unchanged.
For FY12/2023, the company has announced sales of 640 million yen only for Drug Discovery Support Business, which is expected to generate constant revenues. In terms of costs, R&D investment will continue to be in the region of 1 billion yen per year, as clinical trial and investigational drug manufacturing costs will increase in line with the progress of each pipeline as in the past. Drug Discovery and Development Business will likely record losses if it receives no upfront licensing payments or other income. The sales progress ratio at the time of the 2Q results announcement was 55.9%. The company left full-year forecasts unchanged.
◇Stock price: Focus on the future of the possible out-licensing of CBA-1205 and the value enhancement of the pipeline
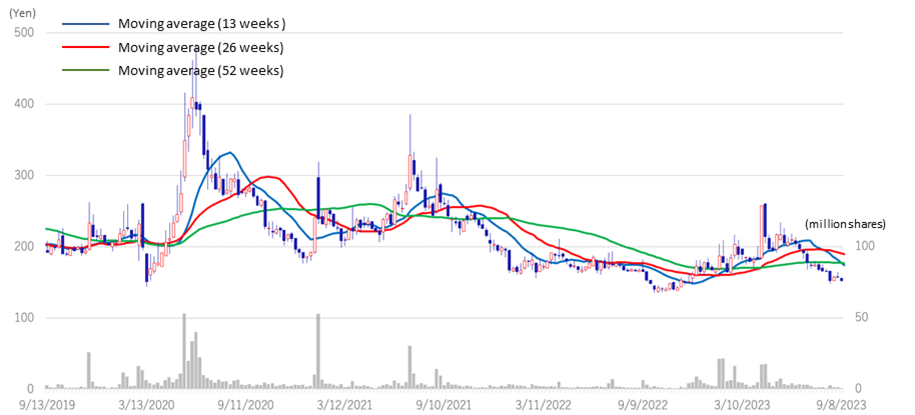
The company’s share price has been volatile due to events such as earnings announcements. On 12 May, the day after the announcement of FY12/2023 1Q results, the share price rose a significant 12.4% from the previous day. Still, it subsequently adjusted again and has recently been trading somewhat above the bottom of 150 yen. Drug Discovery and Development Business requires a billion yen of research and development expenditure and a decade, making it difficult to achieve results quickly. Even though it takes time, it is vital to assess the progress of each pipeline and the potential for out-licensing. In the company’s current pipeline, there are many positive signs in the clinical trials for CBA-1205, and the company is looking at out-licensing CBA-1205. The company is intensifying its out-licensing activities to earn upfront income from the out-licensing of CBA-1205, returning to profitability as soon as possible. Considering the possibility of an upfront payment from the out-licensing of CBA-1205 in the not-too-distant future, the current share price looks attractive. We are interested in monitoring the future development of the company.
Stock price (4 years)
Financial data
| FY (¥mn) | 2020/12 | 2021/12 | 2022/12 | 2023/12 | ||||||||||
| 1Q | 2Q | 3Q | 4Q | 1Q | 2Q | 3Q | 4Q | 1Q | 2Q | 3Q | 4Q | 1Q | 2Q | |
| [Statements of income] | ||||||||||||||
| Net sales | 91 | 82 | 139 | 169 | 246 | 139 | 157 | 171 | 128 | 149 | 156 | 197 | 169 | 189 |
| Drug Discovery and Development Business |
1 | 1 | 0 | 1 | 103 | 0 | 0 | 0 | 0 | 0 | 0 | 0 | 0 | 0 |
| Drug Discovery Support Business | 90 | 82 | 138 | 168 | 143 | 138 | 157 | 171 | 128 | 149 | 156 | 197 | 169 | 189 |
| Cost of sales | 61 | 46 | 59 | 70 | 64 | 62 | 78 | 86 | 57 | 69 | 72 | 83 | 73 | 76 |
| Gross profit | 30 | 36 | 80 | 99 | 182 | 77 | 79 | 84 | 70 | 80 | 84 | 114 | 95 | 112 |
| SG&A expenses | 456 | 346 | 424 | 303 | 337 | 337 | 515 | 568 | 557 | 373 | 344 | 334 | 321 | 545 |
| R&D expenses | 343 | 266 | 342 | 206 | 216 | 243 | 401 | 451 | 446 | 245 | 225 | 219 | 193 | 408 |
| Operating profit | -426 | -310 | -344 | -204 | -155 | -260 | -436 | -483 | -486 | -292 | -260 | -220 | -225 | -433 |
| Non-operating income | 2 | 0 | 3 | 0 | 7 | 0 | 2 | 4 | 0 | 16 | 0 | 5 | 0 | 0 |
| Non-operating expenses | 0 | 2 | 10 | 1 | 1 | 0 | 1 | 6 | 4 | 1 | 1 | -1 | 1 | 1 |
| Ordinary profit | -425 | -311 | -351 | -205 | -150 | -259 | -434 | -486 | -491 | -278 | -261 | -214 | -227 | -434 |
| Extraordinary income | 0 | 0 | 0 | 6 | 0 | 1 | 0 | |||||||
| Extraordinary expenses | 0 | |||||||||||||
| Loss before income taxes | -425 | -310 | -351 | -205 | -149 | -247 | -433 | -636 | -491 | -278 | -255 | -214 | -226 | -434 |
| Total income taxes | 1 | 0 | 1 | 1 | 11 | 1 | 1 | 0 | 1 | 2 | 1 | 1 | 1 | 1 |
| Net income | -425 | -311 | -352 | -206 | -161 | -248 | -434 | -637 | -492 | -279 | -257 | -215 | -227 | -435 |
| [Balance Sheets] | ||||||||||||||
| Current assets | 2,309 | 2,805 | 3,316 | 3,249 | 3,294 | 3,088 | 2,675 | 2,216 | 2,005 | 1,792 | 1,955 | 2,092 | 1,964 | 1,566 |
| Cash and deposits | 1,967 | 2,472 | 2,881 | 2,686 | 2,580 | 2,302 | 2,071 | 1,790 | 1,744 | 1,471 | 1,592 | 1,727 | 1,566 | 1,245 |
| Non-current assets | 247 | 249 | 249 | 246 | 244 | 241 | 274 | 122 | 121 | 128 | 126 | 123 | 120 | 118 |
| Tangible assets | 10 | 9 | 8 | 7 | 6 | 6 | 4 | 4 | 3 | 3 | 2 | 2 | 2 | 1 |
| Investments and other assets | 237 | 240 | 241 | 238 | 237 | 235 | 269 | 118 | 117 | 124 | 122 | 120 | 118 | 117 |
| Total assets | 2,556 | 3,054 | 3,566 | 3,495 | 3,537 | 3,329 | 2,950 | 2,339 | 2,126 | 1,920 | 2,081 | 2,215 | 2,085 | 1,685 |
| Current liabilities | 315 | 427 | 378 | 343 | 378 | 428 | 468 | 392 | 419 | 390 | 376 | 370 | 469 | 486 |
| Short-term borrowings | 142 | 199 | 199 | 180 | 180 | 190 | 199 | 183 | 183 | 188 | 188 | 184 | 304 | 298 |
| Non-current liabilities | 42 | 42 | 42 | 42 | 42 | 42 | 53 | 53 | 53 | 54 | 54 | 54 | 54 | 54 |
| Total liabilities | 357 | 469 | 420 | 385 | 420 | 470 | 522 | 446 | 473 | 444 | 431 | 424 | 523 | 540 |
| Total net assets | 2,199 | 2,585 | 3,146 | 3,110 | 3,118 | 2,859 | 2,428 | 1,893 | 1,653 | 1,476 | 1,650 | 1,790 | 1,562 | 1,144 |
| Total shareholders’ equity | 2,199 | 2,585 | 3,146 | 3,110 | 3,118 | 2,859 | 2,428 | 1,857 | 1,621 | 1,445 | 1,631 | 1,777 | 1,549 | 1,132 |
| Capital stock | 6,133 | 846 | 1,303 | 1,388 | 1,471 | 1,471 | 1,472 | 1,515 | 1,642 | 1,695 | 1,916 | 2,097 | 2,097 | 2,106 |
| Legal capital reserve | 6,123 | 2,446 | 2,903 | 2,987 | 3,071 | 3,071 | 3,072 | 3,115 | 3,242 | 3,295 | 3,516 | 3,696 | 3,696 | 3,706 |
| Retained earnings | -10,080 | -736 | -1,088 | -1,294 | -1,455 | -1,703 | -2,136 | -2,773 | -3,262 | -3,544 | -3,801 | -4,016 | -4,244 | -4,679 |
| Subscription rights to shares | 24 | 30 | 28 | 29 | 30 | 19 | 19 | 35 | 31 | 30 | 18 | 13 | 12 | 12 |
| Total liabilities and net assets | 2,556 | 3,054 | 3,566 | 3,495 | 3,537 | 3,329 | 2,950 | 2,339 | 2,126 | 1,920 | 2,081 | 2,215 | 2,085 | 1,685 |
| [Statements of cash flows] | ||||||||||||||
| Cash flow from operating activities | -528 | -1,361 | -560 | -1,131 | -660 | -1,191 | -595 | |||||||
| Loss before income taxes | -734 | -1,290 | -396 | -1,466 | -768 | -1,237 | -661 | |||||||
| Cash flow from investing activities | – | 3 | – | -35 | – | – | 0 | |||||||
| Purchase of investment securities | – | – | – | – | – | – | – | |||||||
| Cash flow from financing activities | 894 | 1,944 | 176 | 271 | 341 | 1,127 | 113 | |||||||
| Proceeds from issuance of common shares |
697 | 1,769 | 166 | 253 | 336 | 1,126 | – | |||||||
| Net increase in cash and cash equiv. | 366 | 580 | -384 | -895 | -319 | -63 | -481 | |||||||
| Cash and cash equiv. at beginning of period |
2,105 | 2,105 | 2,686 | 2,686 | 1,790 | 1,790 | 1,727 | |||||||
| Cash and cash equiv. at end of period |
2,472 | 2,686 | 2,301 | 1,790 | 1,471 | 1,727 | 1,245 | |||||||
Note) For the cash flow statement, Q2 is the cumulative of Q1 to Q2, and Q4 is the cumulative of Q1 to Q4. Therefore, the beginning balance will be the beginning balance of Q4 for both Q2 and Q4.
Source: Omega Investment from Company materials.