2026-07-27
Home
Japanese

Omega Investment Co., Ltd.
Sansei Landic (Company note – 2Q update)
| Share price (28/9) | ¥1,071 | Dividend Yield (23/12 CE) | 3.08 % |
| 52weeks high/low | ¥1,098/800 | ROE(TTM) | 11.42 % |
| Avg Vol (3 month) | 39.0 thou shrs | Operating margin (TTM) | 11.44 % |
| Market Cap | ¥9.19 bn | Beta (5Y Monthly) | 0.56 |
| Enterprise Value | ¥21.08 bn | Shares Outstanding | 8.584 mn shrs |
| PER (23/12 CE) | 7.45 X | Listed market | TSE Standard |
| PBR (22/12 act) | 0.75 X |
| Click here for the PDF version of this page |
| PDF Version |
Sales went up by about 50%, and operating profit rose by 80%. Full-year forecasts revised up again, aiming for record-high sales and profits.
◇Summary of 2Q results for FY12/2023: Significant increase in sales and profit and upward revision of forecasts.
In the 2Q results for FY12/2023, Sansei Landic recorded a YoY increase of approximately 40% in sales of Leasehold land and an increase of more than 70% in Old unutilized properties. With operating profit increasing by 80%, the company’s revenue and profit grew significantly. Following the announcement of the 1Q results, the company revised its full-year forecasts again. The company’s inventories reached a new record high, as purchases remained strong, and real estate held for sale at the end of 2Q remained at a high level of 24.6 billion yen.
The dividend was revised from the initially planned 29 yen a share to 30 yen. The company plans to pay 33 a share at the end of the current financial year, including a special dividend of 3 yen instead of the abolition of the shareholder benefit plan.
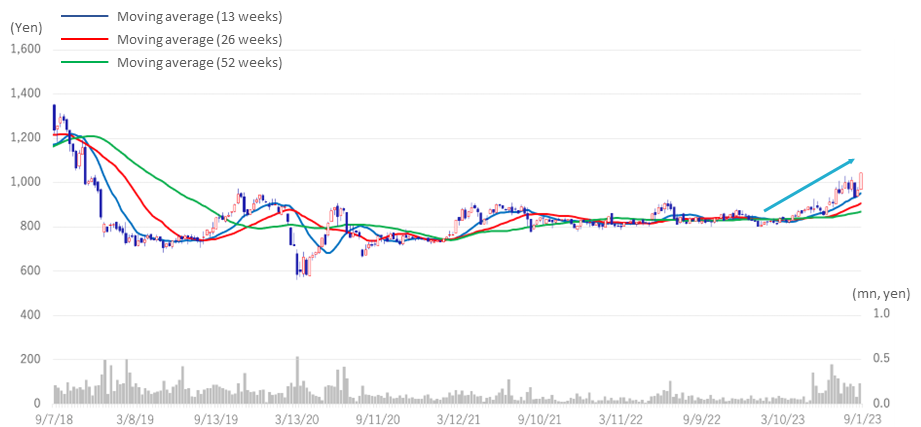
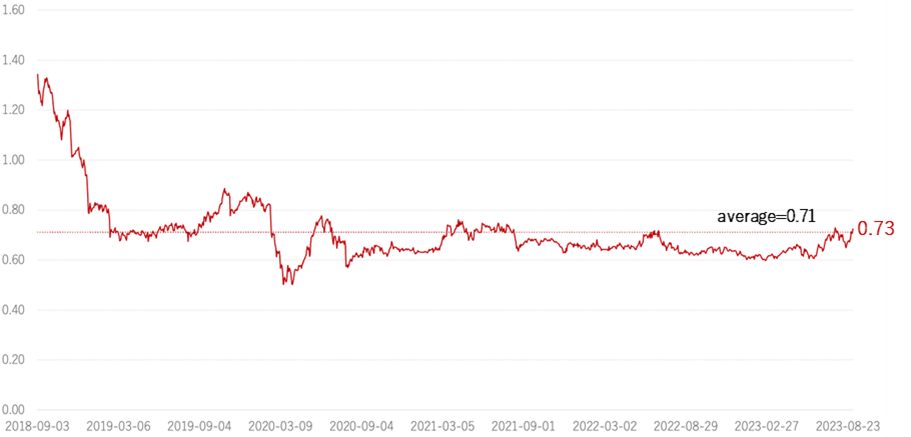
◇ Share price: The share price has recovered to the 1,000 yen level for the first time in four years and nine months
The company’s share price bottomed out at 800 yen on 16 January 2023 and recovered to 1,000 yen at the end of August. The share price reached its highest level since the beginning of the year. This results from investors increasing their confidence in the company’s earnings, given two upward revisions, abundant inventories and the expectation of a strong property market. PBR has recovered to 0.73x. The company is expected to continue to perform strongly, and a PBR of 1x should come in sight.
◇ Financial results for 2Q FY12/2023: Sales exceeded 10 billion yen for the half year, and operating profit exceeded 1.6 billion yen, exceeding the revised forecast revealed at the 1Q result announcement.
Sales and profits significantly increased, with sales rising 46.7% YoY, to 11,980 million yen and operating profit growing by 81.4% to 1,656 million yen. Quarterly net income attributable to shareholders of the parent company rose 31.7% YoY to 939 million yen. The company’s sales exceeded the revised forecasts at the 1Q results announcement, with sales of 11.5 billion yen, operating profit of 1.4 billion yen and quarterly net income attributable to owner of parent of 800 million yen. The 1Q results for the previous year included the construction business, which was sold afterwards. Excluding this business and comparing Real Estate Sales business alone on an apple-to-apple basis, sales increased by 50.8%.
Regarding sales performance by business segment, Leasehold land sales increased by 38.4%, while Old unutilized properties sales increased significantly by 73.3%, both exceeding the company estimates. The strong performance was due to the high level of purchases of both Leasehold land and Old unutilized properties and the build-up of inventories from the previous year’s 3Q.
In the BS, properties for sale increased by 965 million yen to 24,623 million yen compared with the end of FY12/2022. Around 90% of these properties were purchased within the last two years and are scheduled to be sold in the current or next financial year or later. Interest-bearing debt increased by only 120 million yen from the end of the same period, as short-term borrowings increased by 2,005 million yen due to an increase in properties for sale, but long-term borrowings decreased by 2,488 million yen due to the sale of large properties. Total assets increased by 1,800 million yen to 30,777 million yen, while the equity ratio at the end of 2Q was 38.4%, up 0.3 percentage points YoY.
| JPY, mn | Net sales | YoY % |
Oper. profit |
YoY % |
Ord. profit |
YoY % |
Profit ATOP |
YoY % |
EPS (¥) |
DPS (¥) |
| 2019/12 | 18,020 | 7.1 | 1,860 | 5.4 | 1,758 | 7.0 | 1,158 | 15.1 | 137.08 | 23.00 |
| 2020/12 | 17,774 | -1.4 | 847 | -54.5 | 709 | -59.7 | 357 | -69.1 | 42.34 | 25.00 |
| 2021/12 | 16,836 | -5.3 | 1,117 | 31.9 | 999 | 40.9 | 609 | 70.5 | 73.56 | 26.00 |
| 2022/12 | 15,513 | -7.7 | 1,469 | 31.5 | 1,283 | 28.4 | 1,060 | 73.9 | 129.61 | 28.00 |
| 2023/12 (Prev. CE) | 20,500 | 32.0 | 1,700 | 15.7 | 1,400 | 9.1 | 900 | -15.1 | 109.55 | 32.00 |
| 2023/12 (Revised CE) | 23,500 | 51.3 | 2,150 | 46.3 | 1,800 | 40.2 | 1,180 | 11.3 | 143.44 | 33.00 |
| 2022/12 2Q | 8,165 | -10.4 | 913 | 32.5 | 832 | 31.9 | 713 | 77.2 | 86.67 | 0.00 |
| 2023/12 2Q | 11,980 | 46.7 | 1,656 | 81.4 | 1,423 | 70.9 | 939 | 31.7 | 114.38 | 0.00 |
Quarterly sales and operating profit
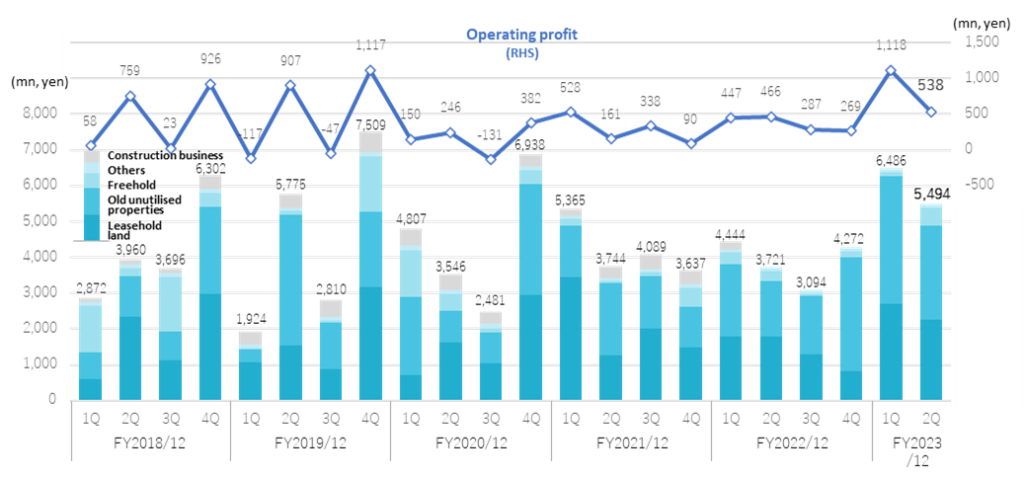
Source: Omega Investment from company materials
▶Real Estate Sales business trends
The company transferred all shares in One’s Life Home Co Ltd, which operates a construction business, at the end of March 2022. Consequently, it runs a single segment of Real Estate Sales business from this fiscal year. Excluding the construction business in 1Q FY12/2022, sales increased by 50.8% YoY for Real Estate Sales business alone.
Leasehold land : Sales were 4,966 million yen (+38.4%). Sales of Leasehold land purchased last year have progressed, with sales up by approximately 40% YoY. The number of sales fell slightly by 168, or 1.8%, due to some large projects. Sales continued to be firm, mainly in the Tokyo metropolitan area.
Old unutilized properties: Sales recorded 6,204 million yen (+73.3%). Old unutilized properties have performed well, particularly in western Japan. In recent years, the company has been strengthening its sales structure outside the Tokyo metropolitan area, which has given it a strong competitive advantage, and the results are starting to emerge. There were 47 projects, a significant increase of 113.6%.
Freehold: Sales were 605 million yen (+4.2%). Sales rose YoY despite the company anticipating a decline. The number of transactions counted 10, a decrease of 9.1%.
▶Purchase of real estate for sales: Significant increase in purchases of Leasehold land, reaching a record high
Purchases in Real Estate Sales business increased by 9,136 million yen, or 29.2%, to more than 4 billion yen in 2Q, following a high quarterly level of more than 5 billion yen since 3Q FY12/2022. The breakdown is as follows: Leasehold land: 5,393 million yen (+124.9%), Old unutilized properties: 3,427 million yen (-18.3%), Freehold: 315 million yen (-34.2%). Old unutilized properties and Freehold properties were lower YoY, but Leasehold land sales increased significantly due to some large projects.
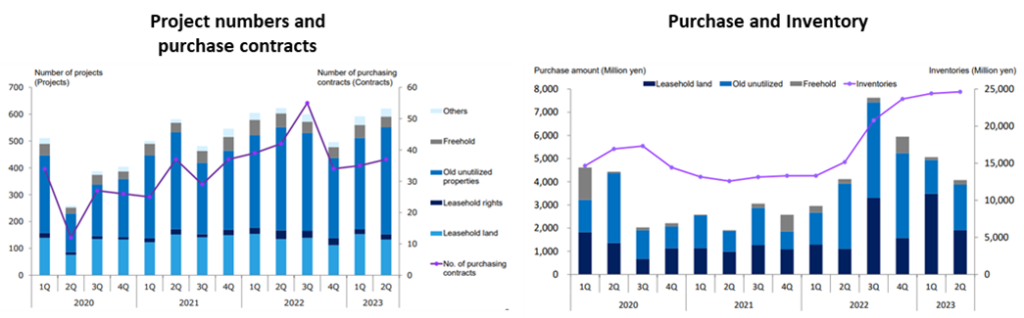
Source: company materials
This is due to 1) the strong property market in recent years, 2) the expansion of large properties requiring a rights adjustment period of more than one-year managing risk, and 3) the success of the strategic area expansion, which has led to an increase in purchases not only in the metropolitan area but also nationwide.
The company continues to purchase properties from a cautious perspective and is building up its inventory, intending to sell them in the next fiscal year or later, with around 90% of properties purchased within the last two years scheduled for sale in the current or next fiscal year or later.
The above right-hand chart shows the trend of purchases and sales in the company’s Real Estate Sales business: purchases remained low from 3Q FY12/2020 due to a slowdown in sales activities caused by COVID-19 but have been recovering since the start of FY12/2022. In particular, the company has significantly increased its real estate for sale since 3Q FY12/2022. The results will be reflected in the positive earnings to be announced this year.
◇ Forecasts for FY12/2023: To be revised up again.
With the 2Q result announcement, the company revised up to its FY12/2023 forecasts, the second upward revision since the 1Q earnings announcement. Compared to the previous estimates, the company’s sales and operating profit forecasts were raised by 15% and 27%, respectively. Compared to the initial guidance, sales and operating profit were raised by 37% and 35%, respectively. The repeated upward revisions are attributable to the fact that in the Old unutilized properties business, the value of each transaction is large and affects sales depending on the timing of the recording of sales and that the company announces conservative forecasts because of this. The revised full-year forecasts call for a 51.3% YoY increase in sales and a 46.3% increase in operating profit, representing progress of 51% on sales and 77% on operating profit as of 2Q against the full-year forecasts. As mentioned, the company’s real estate inventory has built up significantly, and given that the real estate market remains strong, there is potential for further upside to the earnings.
Upward revisions to FY12/2023 consolidated forecasts
| JPY, mn | Net sales | Oper. | Ord. | Profit | EPS |
| profit | profit | ATOP | (¥) | ||
| Initial forecast at FY12/2022 result call (A) (14 February 2023) | 17,119 | 1,594 | 1,305 | 836 | 102.68 |
| Previous forecast (B) (15 May 2023) | 20,500 | 1,700 | 1,400 | 900 | 109.55 |
| Revised forecast (C) | 23,500 | 2,150 | 1,800 | 1,180 | 143.44 |
| Change (C – B) | 3,000 | 450 | 400 | 280 | – |
| Percentage change (C/B,%) | +14.6 | +26.5 | +28.6 | +31.1 | – |
| Change (C – A) | 6,381 | 556 | 495 | 344 | – |
| Percentage change (C/A,%) | +37.3 | +34.9 | +37.9 | +41.1 | – |
| FY12/2022 actual | 15,533 | 1,469 | 1,283 | 1,060 | 129.61 |
| Revised forecast, YoY (%) | 51.3 | 46.3 | 40.2 | 11.3 | – |
| Progress ratio as at 2Q (%) | 51.0 | 77.0 | 79.1 | 79.6 | – |
Source: Omega Investment from company materials
◇ Share price: The share price has recovered to above 1,000 yen level. Further upside is expected.
The share price regained momentum following strong 2Q results and an upward revision to the full-year forecast, closing at 1,082 yen on 4 September, marking the highest price YTD. As mentioned above, there is further upside to the earnings in the current financial year, and given that the real estate market will likely remain solid into the next financial year and the company’s real estate inventories are high, there appears to be further upside to the share price.
Price to book has also recovered to above 0.7x following the rising share price and has recently exceeded 0.70x, the average for the past five years. However, given the company’s unique business model and earnings opportunity, it is still cheap. The company has stated that improving its PBR is a vital management issue and is considering concrete measures to address it. The company plans to announce specific measures to realise the cost of capital and share price conscious management by the time the full-year result announcement. The share price should be revalued further if the company progresses on concrete measures to realise sustainable profit growth.
5-year stock price move
Historical PBR (last five years)
Financial data (quarterly)
| FY (¥mn) | 2020/12 | 2021/12 | 2022/12 | 2023/12 | ||||||||||
| 1Q | 2Q | 3Q | 4Q | 1Q | 2Q | 3Q | 4Q | 1Q | 2Q | 3Q | 4Q | 1Q | 2Q | |
| [Sales by segment] | ||||||||||||||
| Net sales | 4,807 | 3,546 | 2,481 | 6,938 | 5,365 | 3,744 | 4,089 | 3,637 | 4,444 | 3,721 | 3,094 | 4,272 | 6,486 | 5,494 |
| Year-on-year basis | 149.7% | -38.6% | -11.7% | -7.6% | 11.6% | 5.6% | 64.8% | -47.6% | -17.2% | -0.6% | -24.3% | 17.4% | 45.9% | 47.6% |
| Real estate sales business | 4,339 | 3,092 | 2,137 | 6,543 | 5,171 | 3,434 | 3,679 | 3,244 | 4,222 | 3,721 | 3,094 | 4,272 | 6,486 | 5,494 |
| Year-on-year basis | 175.3% | -42.7% | -9.2% | -5.7% | 19.2% | 11.1% | 72.1% | -50.4% | -18.3% | 8.3% | -15.9% | 31.7% | 53.6% | 50.8% |
| Sales composition ratio | 90.3% | 87.2% | 86.2% | 94.3% | 96.4% | 91.7% | 90.0% | 89.2% | 95.0% | 100.0% | 100.0% | 100.0% | 100.0% | 100.0% |
| Leasehold land | 719 | 1,613 | 1,044 | 2,950 | 3,464 | 1,267 | 2,003 | 1,474 | 1,793 | 1,794 | 1,284 | 832 | 2,707 | 2,259 |
| Year-on-year basis | -33.8% | 4.3% | 17.4% | -7.1% | 381.4% | -21.5% | 91.9% | -50.0% | -48.2% | 41.6% | -35.9% | -43.6% | 51.0% | 25.9% |
| Sales composition ratio | 15.0% | 45.5% | 42.1% | 42.5% | 64.6% | 33.8% | 49.0% | 40.5% | 40.3% | 48.2% | 41.5% | 19.5% | 41.7% | 41.1% |
| Old unutilised properties | 2,180 | 897 | 872 | 3,101 | 1,419 | 2,025 | 1,488 | 1,151 | 2,024 | 1,556 | 1,649 | 3,170 | 3,571 | 2,633 |
| Year-on-year basis | 520.6% | -75.5% | -32.0% | -47.1% | -34.9% | 125.8% | 70.6% | -62.9% | 42.6% | -23.2% | 10.8% | 175.4% | 76.4% | 69.2% |
| Sales composition ratio | 45.4% | 25.3% | 35.1% | 44.7% | 26.4% | 54.1% | 36.4% | 31.6% | 45.5% | 41.8% | 53.3% | 74.2% | 55.1% | 47.9% |
| Freehold | 1,305 | 465 | 106 | 395 | 191 | 46 | 101 | 526 | 315 | 266 | 49 | 157 | 101 | 504 |
| Year-on-year basis | 4560.7% | 428.4% | 92.7% | -74.2% | -85.3% | -90.1% | -4.7% | 33.2% | 64.9% | 478.3% | -51.5% | -70.2% | -67.9% | 89.5% |
| Sales composition ratio | 27.1% | 13.1% | 4.3% | 5.7% | 3.6% | 1.2% | 2.5% | 14.5% | 7.1% | 7.1% | 1.6% | 3.7% | 1.6% | 9.2% |
| Others | 133 | 117 | 116 | 97 | 96 | 95 | 88 | 94 | 89 | 105 | 112 | 114 | 106 | 96 |
| Year-on-year basis | 21.5% | 12.5% | -7.9% | -23.0% | -28.3% | -18.8% | -24.1% | -3.1% | -7.3% | 10.5% | 27.3% | 21.3% | 19.1% | -8.6% |
| Sales composition ratio | 2.8% | 3.3% | 4.7% | 1.4% | 1.8% | 2.5% | 2.2% | 2.6% | 2.0% | 2.8% | 3.6% | 2.7% | 1.6% | 1.7% |
| Construction business | 468 | 455 | 343 | 395 | 194 | 309 | 409 | 392 | 222 | – | – | – | – | – |
| Year-on-year basis | 34.1% | 19.8% | -24.9% | -30.1% | -58.4% | -32.1% | 19.3% | -0.8% | 14.0% | – | – | – | – | – |
| Sales composition ratio | 9.7% | 12.8% | 13.8% | 5.7% | 3.6% | 8.3% | 10.0% | 10.8% | 5.0% | – | – | – | – | – |
| [Statements of income] | ||||||||||||||
| Net sales | 4,807 | 3,546 | 2,481 | 6,938 | 5,365 | 3,744 | 4,089 | 3,637 | 4,444 | 3,721 | 3,096 | 4,272 | 6,486 | 5,494 |
| Cost of sales | 3,865 | 2,557 | 1,934 | 5,431 | 4,020 | 2,756 | 2,945 | 2,745 | 3,146 | 2,310 | 1,963 | 3,066 | 4,320 | 3,859 |
| Gross profit | 942 | 989 | 548 | 1,507 | 1,344 | 986 | 1,143 | 892 | 1,297 | 1,411 | 1,132 | 1,206 | 2,166 | 1,636 |
| SG&A expenses | 792 | 744 | 678 | 925 | 816 | 826 | 805 | 802 | 850 | 946 | 845 | 937 | 1,084 | 1,097 |
| Operating profit | 150 | 245 | -131 | 382 | 528 | 160 | 338 | 90 | 447 | 466 | 287 | 269 | 1,118 | 538 |
| Non-operating profit | 9 | 5 | 51 | 5 | 12 | 8 | 8 | 6 | 7 | 7 | 6 | 7 | 8 | 6 |
| Non-operating expenses | 55 | 63 | 60 | 10 | 37 | 40 | 34 | 39 | 39 | 55 | 54 | 64 | 80 | 165 |
| Ordinary income | 103 | 188 | -140 | 298 | 502 | 128 | 311 | 56 | 415 | 417 | 239 | 212 | 1,045 | 378 |
| Extraordinary income | 0 | 0 | 0 | 3 | 0 | 0 | 0 | 19 | 0 | 0 | 1 | – | – | |
| Extraordinary expenses | 0 | 0 | 0 | 0 | 0 | 8 | 7 | – | – | |||||
| Loss before income taxes | 103 | 188 | -140 | 298 | 506 | 128 | 311 | 56 | 435 | 399 | 231 | 205 | 1,045 | 378 |
| Total income taxes | 36 | 72 | -49 | 295 | 183 | 48 | 166 | -4 | 59 | 60 | 36 | 54 | 361 | 122 |
| Net income | 67 | 114 | -90 | 176 | 323 | 79 | 145 | 61 | 375 | 338 | 196 | 151 | 683 | 255 |
| [Balance Sheets] | ||||||||||||||
| Current assets | 18,816 | 20,798 | 20,577 | 19,040 | 17,554 | 17,371 | 18,769 | 18,968 | 19.018 | 21,579 | 26,379 | 27,929 | 28,392 | 29,382 |
| Property for sale | 14,655 | 16,923 | 17,312 | 14,424 | 13,493 | 12,586 | 13,134 | 13,301 | 13,304 | 15,152 | 20,775 | 23,657 | 24,404 | 24,623 |
| Non-current assets | 1,188 | 1,164 | 1,197 | 1,030 | 951 | 1,054 | 1,081 | 1,082 | 1,124 | 1,099 | 1,129 | 1,047 | 1,233 | 1,394 |
| Tangible assets | 451 | 449 | 443 | 306 | 291 | 290 | 293 | 301 | 317 | 313 | 314 | 299 | 312 | 529 |
| Investments and other assets | 668 | 653 | 691 | 655 | 595 | 703 | 732 | 730 | 761 | 743 | 769 | 701 | 873 | 817 |
| Total assets | 20,004 | 21,962 | 21,774 | 20,071 | 18,505 | 18,425 | 19,849 | 20,051 | 20,134 | 22,678 | 27,508 | 28,976 | 29,626 | 30,777 |
| Current liabilities | 9,883 | 7,767 | 7,699 | 5,772 | 5,517 | 7,540 | 8,633 | 8,731 | 8,153 | 8,871 | 11,168 | 12,606 | 13,658 | 16,133 |
| Short-term borrowings | 7,729 | 6,352 | 6,676 | 4,463 | 4,272 | 6,105 | 7,171 | 7,367 | 5,025 | 5,057 | 6,960 | 10,192 | 11,151 | 12,198 |
| Non-current liabilities | 345 | 4,303 | 4,274 | 4,232 | 2,919 | 792 | 976 | 1,017 | 1,525 | 3,114 | 5,453 | 5,314 | 4,405 | 2,810 |
| Long-Term Borrowings | 3,958 | 3,929 | 3,879 | 2,570 | 483 | 683 | 740 | 1,260 | 2,827 | 5,153 | 5,033 | 4,093 | 2,545 | |
| Total liabilities | 10,228 | 12,071 | 11,973 | 10,004 | 8,436 | 8,332 | 9,609 | 9,749 | 9.679 | 11,968 | 16,622 | 17,920 | 18,064 | 18,943 |
| Total net assets | 9,776 | 9,891 | 9,801 | 10,067 | 10,070 | 10,093 | 10,240 | 10,301 | 10,463 | 10,692 | 10,886 | 11,056 | 11,561 | 11,833 |
| Total shareholders’ equity | 9,776 | 9,891 | 9,801 | 10,067 | 10,070 | 10,093 | 10,240 | 10,297 | 10,459 | 10,688 | 10,882 | 11,052 | 11,562 | 11,833 |
| Capital stock | 818 | 818 | 818 | 818 | 818 | 820 | 820 | 820 | 821 | 822 | 824 | 833 | 860 | 860 |
| Legal capital reserve | 779 | 779 | 779 | 779 | 779 | 781 | 781 | 781 | 782 | 785 | 786 | 796 | 823 | 824 |
| Retained earnings | 8,174 | 8,289 | 8,200 | 8,465 | 8,577 | 8,656 | 8,802 | 8,863 | 9,023 | 9,362 | 9,557 | 9,708 | 10,164 | 10,419 |
| Stock acquisition right | 4 | 4 | 4 | 4 | 4 | 4 | 4 | 4 | 4 | 3 | 3 | 3 | – | – |
| Total liabilities and net assets | 20,004 | 21,962 | 21,774 | 20,071 | 18,505 | 18,425 | 19,849 | 20,051 | 20,134 | 22,678 | 27,508 | 28,976 | 29,626 | 30,777 |
| [Statements of cash flows] | ||||||||||||||
| Cash flow from operating activities | -3,683 | -916 | 2,110 | 1,704 | 1,184 | -9,267 | 911 | |||||||
| Loss before income taxes | 291 | 712 | 635 | 1,003 | 833 | 1,269 | 1,423 | |||||||
| Cash flow from investing activities | -9 | -287 | -26 | -51 | -205 | -266 | -655 | |||||||
| Cash flow from financing activities | 3,021 | 952 | -2,129 | -608 | -559 | 7,971 | -56 | |||||||
| Net increase in cash and cash equiv. | -671 | -251 | -46 | 1,045 | 420 | -1,563 | 200 | |||||||
| Cash and cash equiv. at beginning of period | 3,958 | 3,958 | 3,707 | 3,707 | 4,752 | 4,752 | 3,188 | |||||||
| Cash and cash equiv. at end of period | 3,287 | 3,707 | 3,661 | 4,752 | 5,173 | 3,188 | 3,839 | |||||||
Source: Omega Investment from company materials
Financial data
2011/12 |
2012/12 |
2013/12 |
2014/12 |
2015/12 |
2016/12 |
2017/12 |
2018/12 |
2019/12 |
2020/12 |
2021/12 |
2022/12 |
|
FY (¥mn) |
||||||||||||
[Statements of income] |
8,042 |
9,475 |
9,187 |
10,443 |
11,567 |
12,300 |
13,098 |
16,833 |
18,020 |
17,774 |
16,836 |
15,533 |
Net sales |
8.5 |
17.8 |
-3.0 |
13.7 |
10.8 |
6.3 |
6.5 |
28.5 |
7.1 |
-1.4 |
-5.3 |
-7.7 |
YoY change (%) |
5,557 |
7,061 |
6,254 |
7,055 |
7,798 |
8,344 |
8,566 |
12,028 |
12,902 |
13,788 |
12,467 |
10,485 |
Cost of sales |
2,485 |
2,415 |
2,934 |
3,389 |
3,769 |
3,957 |
4,532 |
4,805 |
5,119 |
3,986 |
4,368 |
5,047 |
Gross profit |
1,735 |
1,898 |
2,014 |
2,184 |
2,470 |
2,510 |
2,770 |
3,039 |
3,258 |
3,139 |
3,250 |
3,578 |
SG&A expenses |
750 |
517 |
920 |
1,205 |
1,300 |
1,446 |
1,762 |
1,766 |
1,861 |
847 |
1,117 |
1,469 |
Operating profit |
14.5 |
31.0 |
77.9 |
30.9 |
7.9 |
11.3 |
21.9 |
0.2 |
5.4 |
-54.5 |
31.9 |
31.5 |
YoY change (%) |
9.3 |
5.5 |
10.0 |
11.5 |
11.2 |
11.8 |
13.5 |
10.5 |
10.3 |
4.8 |
6.6 |
9.5 |
Operating income margin (%)) |
135 |
5 |
12 |
14 |
15 |
15 |
12 |
28 |
42 |
88 |
34 |
26 |
Non-operating profit |
138 |
85 |
122 |
174 |
118 |
133 |
106 |
150 |
144 |
226 |
152 |
212 |
Non-operating expenses |
747 |
437 |
810 |
1,044 |
1,196 |
1,329 |
1,669 |
1,643 |
1,759 |
709 |
999 |
1,283 |
Ordinary income |
54 |
23 |
|
|
|
|
97 |
|
|
32 |
3 |
20 |
Extraordinary income |
4 |
17 |
|
|
|
|
94 |
104 |
|
29 |
33 |
|
Extraordinary expenses |
797 |
443 |
810 |
1,044 |
1,196 |
1,329 |
1,672 |
1,539 |
1,759 |
712 |
1,003 |
1,269 |
Loss before income taxes |
353 |
209 |
354 |
418 |
472 |
475 |
561 |
533 |
600 |
355 |
394 |
209 |
Total income taxes |
444 |
233 |
456 |
626 |
724 |
854 |
1,111 |
1,007 |
1,159 |
358 |
609 |
1,060 |
Net income attributable to owner of parent |
47.6 |
47.5 |
95.4 |
37.5 |
15.6 |
17.9 |
30.2 |
-9.4 |
15.1 |
-69.1 |
70.5 |
73.9 |
YoY change (%) |
||||||||||||
[Balance Sheets] |
||||||||||||
Current assets |
5,251 |
6,257 |
8,023 |
7,836 |
10,366 |
9,749 |
15,874 |
15,745 |
18,094 |
19,040 |
18,968 |
27,929 |
Property for sale |
3,698 |
4,834 |
6,346 |
5,166 |
7,699 |
6,877 |
11,863 |
11,678 |
13,493 |
14,424 |
13,301 |
23,657 |
Non-current assets |
834 |
836 |
895 |
957 |
1,031 |
1,083 |
1,042 |
1,032 |
1,199 |
1,030 |
1,082 |
1,047 |
Tangible assets |
136 |
135 |
569 |
603 |
572 |
591 |
467 |
458 |
456 |
306 |
301 |
299 |
Investments and other assets |
612 |
622 |
226 |
258 |
383 |
405 |
494 |
505 |
669 |
655 |
730 |
701 |
Total assets |
6,085 |
7,093 |
8,919 |
8,793 |
11,398 |
10,833 |
16,916 |
16,777 |
19,294 |
20,071 |
20,050 |
28,976 |
Current liabilities |
2,663 |
3,098 |
4,587 |
3,165 |
4,910 |
3,751 |
8,430 |
6,160 |
9,047 |
5,772 |
8,731 |
12,606 |
Short-term borrowings |
1,733 |
2,095 |
3,362 |
2,094 |
3,778 |
2,624 |
7,076 |
4,728 |
7,203 |
4,462 |
5,544 |
10,192 |
Non-current liabilities |
181 |
562 |
465 |
367 |
453 |
226 |
479 |
1,710 |
351 |
4,232 |
1,017 |
5,314 |
Long-Term Borrowings |
147 |
526 |
419 |
320 |
180 |
88 |
364 |
1,320 |
|
3,879 |
740 |
5,033 |
Total liabilities |
2,845 |
3,660 |
5,051 |
3,531 |
5,363 |
3,977 |
8,909 |
7,869 |
9,399 |
10,004 |
9,748 |
17,920 |
Total net assets |
3,241 |
3,433 |
3,868 |
5,262 |
6,034 |
6,856 |
8,006 |
8,908 |
9,894 |
10,066 |
10,301 |
11,056 |
Total shareholders’ equity |
3,241 |
3,433 |
3,868 |
5,262 |
6,034 |
6,852 |
8,002 |
8,904 |
9,890 |
10,062 |
10,297 |
11,052 |
Capital stock |
257 |
257 |
257 |
661 |
710 |
720 |
788 |
811 |
814 |
818 |
820 |
833 |
Legal capital reserve |
218 |
218 |
218 |
622 |
671 |
681 |
749 |
772 |
775 |
779 |
781 |
796 |
Retained earnings |
2,766 |
2,958 |
3,393 |
3,978 |
4,654 |
5,451 |
6,464 |
7,320 |
8,302 |
8,465 |
8,863 |
9,708 |
Stock acquisition right |
|
|
|
|
|
4 |
4 |
4 |
4 |
4 |
4 |
3 |
Total liabilities and net assets |
6,085 |
7,093 |
8,919 |
8,793 |
11,398 |
10,833 |
16,916 |
16,777 |
19,294 |
20,071 |
20,050 |
28,976 |
Equity ratio (%) |
53.3 |
48.4 |
43.4 |
59.8 |
52.9 |
63.3 |
47.3 |
53.1 |
51.3 |
50.1 |
51.4 |
38.1 |
[Statements of cash flows] |
||||||||||||
Cash flow from operating activities |
970 |
-953 |
-664 |
1,761 |
-1,451 |
1,611 |
-3,666 |
1,617 |
-420 |
-917 |
1,704 |
-9,267 |
Loss before income taxes |
797 |
443 |
810 |
1,044 |
1,196 |
1,329 |
1,672 |
1,539 |
1,759 |
712 |
1,003 |
1,269 |
Cash flow from investing activities |
127 |
-15 |
-175 |
-111 |
-116 |
-184 |
107 |
-64 |
-71 |
-288 |
-51 |
-266 |
Cash flow from financing activities |
-877 |
692 |
1,136 |
-612 |
1,588 |
-1,278 |
4,667 |
-1,495 |
984 |
953 |
-608 |
7,971 |
Issuance of shares |
406 |
|
|
800 |
97 |
21 |
37 |
45 |
6 |
9 |
||
Net increase in cash and cash equiv. |
219 |
-276 |
296 |
1,039 |
22 |
150 |
1,108 |
58 |
493 |
-251 |
1,045 |
-1,563 |
Cash and cash equiv. at beginning of period |
850 |
1,069 |
793 |
1,089 |
2,128 |
2,150 |
2,299 |
3,407 |
3,465 |
3,959 |
3,707 |
4,752 |
Cash and cash equiv. at end of period |
1,069 |
793 |
1,089 |
2,128 |
2,150 |
2,299 |
3,407 |
3,465 |
3,959 |
3,707 |
4,752 |
3,188 |
Free cash flow |
1,097 |
-968 |
-839 |
1,650 |
-1,567 |
1,427 |
-3,559 |
1,553 |
-491 |
-1,205 |
1,653 |
-9,533 |
Source: Omega Investment from company materials