2026-07-27
Home
Japanese

Omega Investment Co., Ltd.
Tenpo Innovation (Full report – update)

Growth to accelerate ahead of the recovery
Margins rising on increase in successor contracts and guarantee fees
| Click here for the PDF version of this page |
| PDF Version |
SUMMARY
- Textbook definition of stable high growth. According to the JF Food Service Industry Market Survey for June 2023, total stores declined -1.5% YoY, and relative to March 2019, declined -7.2. For the same period, subleased restaurant store properties for TENPO INNOVATION increased 12.8% YoY, and relative to March 2019, increased 48.9%. In other words, there is no correlation between TENPO INNOVATION subleased restaurant store properties and the underlying market trend for restaurants. While COVID-19 gave a boost to the Company’s business by increasing turnover, the current phase has even more potential as the number of individual and small restaurant business operators seek to open new restaurants in preparation for the recovery phase.
- Structural growth drivers: ❶ The difficult environment for the restaurant industry overall is actually a favorable opportunity for the Company as more properties become available to procure for subleasing, and turnover in existing contracts increases the number of profitable successor contracts (no acquisition costs such as key money), and ❷ newly established store rent guarantee business has no cost of sales or personnel cost, so net sales are basically equivalent to OP, and revenue is linked directly to the number of signed contracts each quarter.
TENPOINNOVATION: Sustainable double-digit growth with high stability
Source: compiled by Omega Investment from IR results briefing materials.
Financial Indicators
| Share price (9/29) | 1,179 | 24.3 P/E (CE) | 23.5x |
| YH (23/3/10) | 1,340 | 24.3 EV/EBITDA (CE) | 14.0x |
| YL (23/6/8) | 1,006 | 23.3 ROE (act) | 27.7% |
| 10YH (23/3/10) | 1,340 | 23.3 ROIC (act) | 25.9% |
| 10YL (20/4/6) | 477 | 23.6 P/B (act) | 6.97x |
| Shrs out. (mn shrs) | 17.674 | 24.3 DY (CE) | 1.69% |
| Mkt cap (¥ bn) | 20.838 | | |
| EV (¥ bn) | 18.431 | | |
| Equity ratio (6/30) | 22.5% | | |
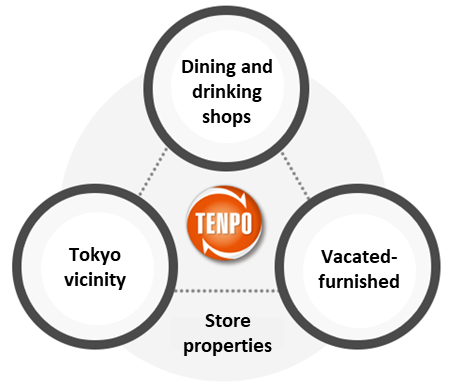
TENPO INNOVATION’s 3 Main Criteria for Selecting Store Sublease Properties Always in High Demand
- The store property is on the 1F facing a street (regardless of station proximity)
- Monthly rent is affordable in absolute terms (averaging around ¥400k/mo.)
- The property is a vacated-furnished store (lowers the initial investment cost)
TENPO INNOVATION Financial Highlights/Key Indicators
PART ① INTRODUCTION
Highly stable, defensive business model with sustainable double-digit growth
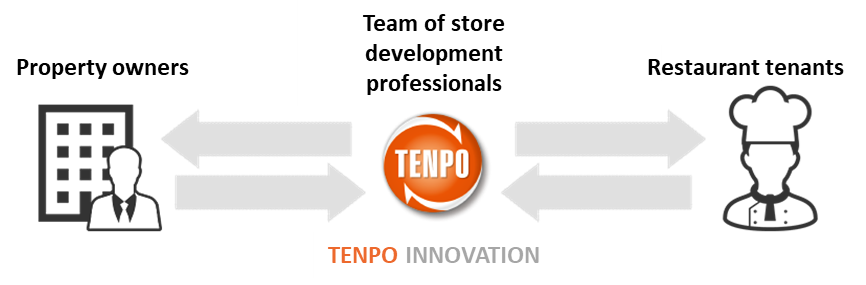
TENPO INNOVATION conducted an IPO and listed its shares on the TSE Mothers market in Oct-2017, and successfully moved to the TSE 1ST Section in Oct-2018. While it has been listed on the TSE Prime market since last April, the high potential of its business model and attractive profit structure is not yet widely understood, in our view. We examine the Company’s business description and strengths and attractive characteristics of its business model in Part 2, however as a brief capsule summary, the Company is primarily engaged in restaurant store subleasing business in the greater Tokyo Metropolitan area, with a high weighting in central Tokyo store properties. It is the only listed company focused on this highly specialized business, and there are no major direct competitors, listed or not.
Omega Investment’s thesis (investment opportunity) for TENPO INNOVATION
- In Part 1, we present both macro-level and micro-level data that clearly shows that the restaurant industry, like all areas in hospitality services (travel, lodging, dining, drinking, live entertainment, etc.), was severely affected by spread of the once-in-a-century COVID-19 global pandemic, due to repeated declarations of a state of emergency, restrictions on economic activities, stay-at-home orders, widespread adoption by companies of telework policies allowing employees to work from home, shortened and/or suspended business hours for dining and drinking establishments, as well as health guidelines from the national and local governments strongly urging people to avoid congregating in enclosed, indoor spaces.
- Micro-level data by JF shows that despite recent steady improvement in the business environment for restaurants and the food service industry, only fast food restaurants have recovered to 2019 pre-pandemic levels. More importantly, we demonstrate in this report that TENPO INNOVATION’s restaurant store subleasing business is completely uncorrelated with the underlying trend in the restaurant industry, continuing to grow at double-digits along with a high degree of stability (see graph on P11). Profitability is being driven by the two structural growth drivers of new high-margin rent guarantee business as well as rising latent stock of successor contracts which have no initial acquisition cost. The Company actually benefitted during the pandemic which caused an increase in turnover. The opportunity going forward is a further increase in tenant applications (acceleration) in preparation of the overall recovery.
METI Trends in Food and Beverage Related Industries in 2022
For macro-level data, we have found METI’s semi-annual (May/Oct) Trends in Food and Beverage Related Industries provides the most useful top-down approach, which gives a handy snapshot overview of current trends in food service-related industries. The methodology employed in creating the Food Business Index (FBI) shown below draws on METI’s database for indices of industrial production (IP) for manufacturing sectors and indices of tertiary activity (ITA) for service sectors. The advantage of this index-based approach is that it provides an accurate picture of the trend level of an historical time series without suffering from the shortcomings of the base effect inherent in YoY statistical analysis, and the current FBI series is indexed to 2015 = 100.
The two tables at the bottom of the page provide the nominal scale of the three component sectors of overall food business in Japan, as well the number of business locations and employees for each from the 2021 Census of Economic Activity. The key takeaways from the CY2021 market are product mfg. increased +10.7%, while restaurants still declined -4.9%.
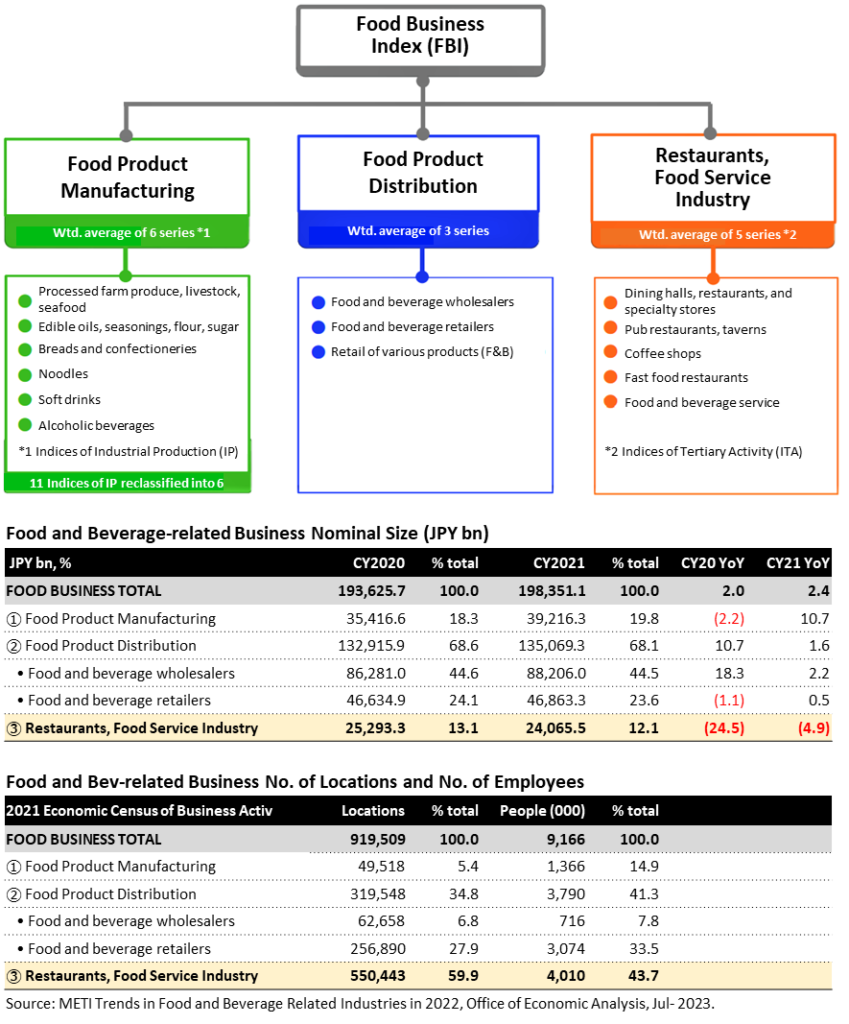
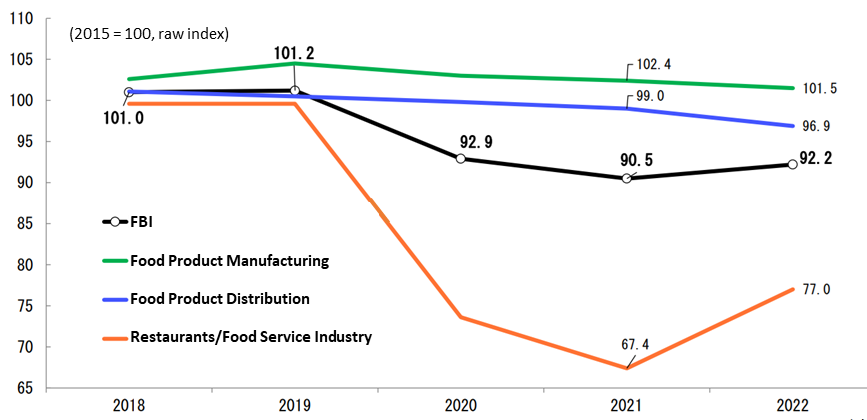
The title of METI’s Office of Economic Analysis report published on July 14, 2023 is “Due to the recovery of Restaurants/Food Service Industry, food business in 2022 rose for the first time in three years.” In 2022, the FBI had an index value of 92.2, a year-on-year increase of +1.9%, the first rise in 3 years. The three industries included in the index are Food Product Manufacturing (-0.9% YoY), Food Product Distribution (-2.1% YoY), and Restaurants/Food Service Industry (+14.2% YoY). Regarding the degree of impact on the FBI’s year-over-year growth rate by component sector, Restaurants/Food Service Industry contributed +3.1 percentage points to the 2022 FBI’s +1.9% YoY growth rate, the other two remaining negative. While restaurants accounted for virtually all the decline in 2020 and 2021, the recovery in 2022 drove the first rise in the FBI in 3 years.
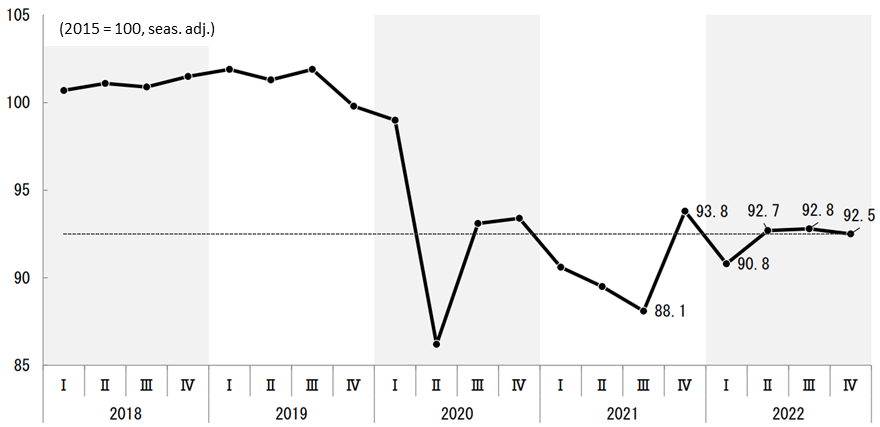
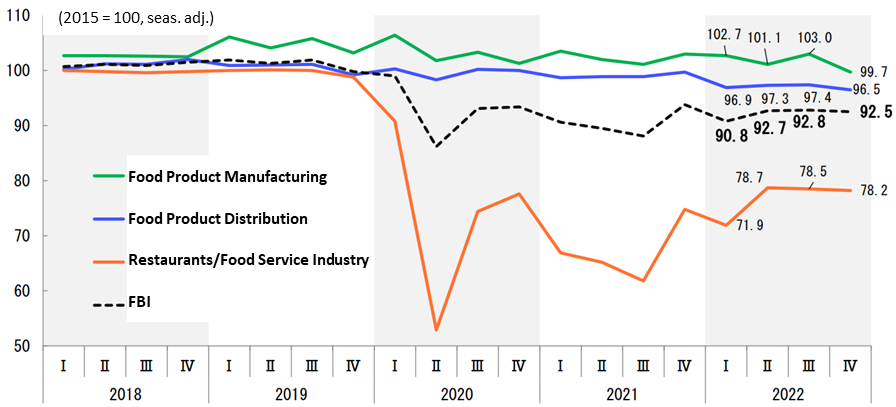
The three graphs on the following page show the trend of the various indices on a quarterly basis. While the annual data below would appear to suggest a positive recovery is underway for Restaurants/Food Service Industry, note that the absolute level is still far below the 2019 pre-pandemic level. The quarterly data on the following page paints a less positive recovery. In particular, the middle graph shows the Restaurants/Food Service Industry index declined QoQ in the 1Q, 3Q and 4Q, still struggling to make a sustained recovery. Only fast food restaurants have returned to 2019 pre-pandemic levels.
METI Food Business Index (FBI) Annual Trend
Degree of impact on FBI year-on-year growth rate
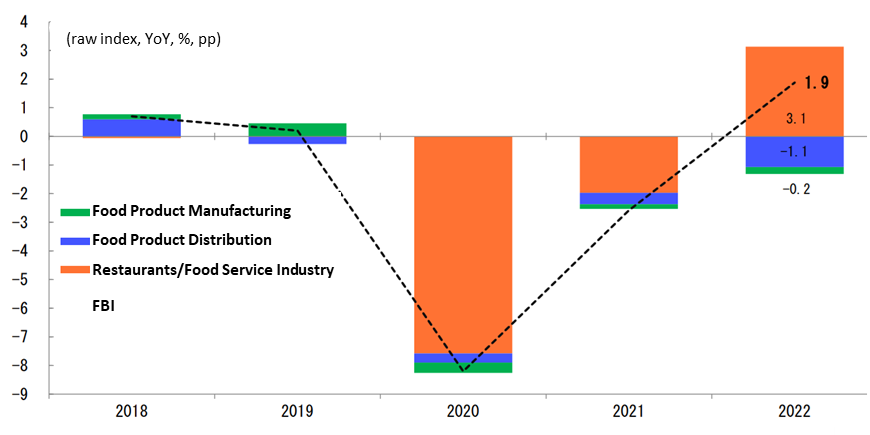
Source: METI Trends in Food and Beverage Related Industries in 2022, Office of Economic Analysis, July 14, 2023.
FBI Quarterly Trend (seasonally adjusted)
FBI Quarterly Breakdown of Component Industries (seasonally adjusted)
Restaurants, Food Service Industry Quarterly Breakdown of Component Industries (S.A.)
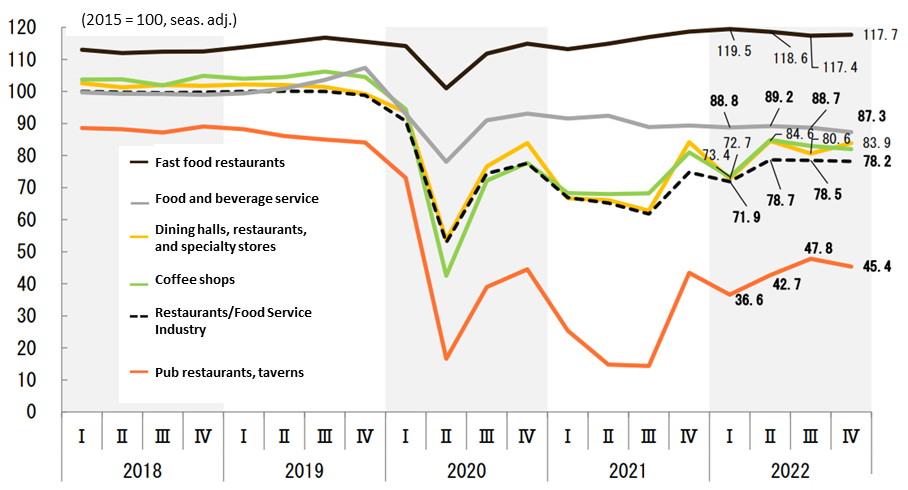
Source: METI Trends in Food and Beverage Related Industries in 2022, Office of Economic Analysis, July 14, 2023.
JF Monthly and Annual Surveys of the Food Service Industry
Indexed from 2015 = 100, macro-level data showed METI’s Food Business Index (FBI) for the Restaurants/Food Service Industry had a 2021 annual value of 67.4, and on a quarterly basis, 3Q 2021 posted the second lowest value of 61.8, attesting to the severity of the impact to the industry in the wake of COVID-19. For micro-level data, we have found the monthly and annual surveys by the Japan Foodservice Association (JF) provide the most useful bottom-up approach, providing timely updates for the restaurant industry based on direct responses from restaurants and food and beverage service providers.
The pie graphs below show the Apr-2022 JF Food Service Industry Market Trend Survey was based on responses from 228 companies which operate 36,735 stores, a more than adequate sample size to accurately reflect the underlying trends, and the pie graphs present the breakdown by restaurant format. The table above the two pie graphs provides a description of each of the restaurant formats, which is based on definitions and the classification system employed by METI. JF also produces an annual report estimating the market size of the Foodservice Industry, which is adopted by METI in its FBI analysis. Data from Japan Foodservice Association (JF) “Estimation of Food Service Industry Market Size,” March 2023 is summarized on P9. The key takeaway from the long-term graph on the top of the page is simply the extent of the shock from COVID-19 within a 40-year horizon.
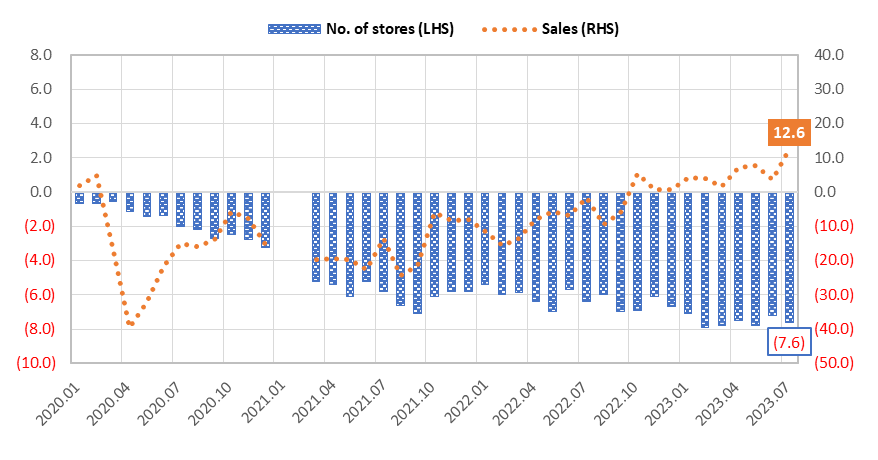
Then P10 provides a summary of monthly and annual data from JF Food Service Industry Market Trend Surveys. The key takeaway from the annual graph at the top of the page is that net store closures (JF stores data is based on all stores) is a lagging indicator to the recovery in sales and customer traffic. The middle graph shows the YoY trend of monthly data from JF surveys. Based on this graph, one might conclude that the restaurant industry entered a recovery trend from the 2H of 2021. HOWEVER, YoY statistical analysis can be misleading in the wake of large swings. JF recognized this phenomenon, and from its Mar-21 survey report, it added two columns on the right-hand side of the data table to include comparisons relative to the same month in 2019, i.e. before the pandemic. The key takeaway from the lower graph which shows the comparison versus 2019 is that total stores have yet to post a meaningful recovery, -7.6% in Jul-23, still down sharply.
JF Restaurant Format Classifications Based on METI Statistics Definitions
| Format | Form of use | What is served | Average spend |
| Fast Food | Eat-in and/or take-out | Mainly meals | Somewhat cheap |
| Family Restaurants | Mainly eat-in | Mainly meals | Average |
| Pub restaurants (IZAKAYA) | Mainly eat-in | Food and beverages | Somewhat expensive |
| Dinner Restaurants | Mainly eat-in | Mainly meals | Expensive |
| Coffee Shops | Eat-in and/or take-out | Mainly soft drinks | Cheap |
Japan Foodservice Assoc.
JF was established in 1974 under approval of the Ministry of Agriculture, Forestry and Fisheries. The number of regular and supporting member companies has reached 800, representing an estimated market size of approx. ¥24 trillion with 4 million workers.
JF Food Service Industry Market Trend Survey Apr-2022 No. of Companies (left) and No. of Stores (right)
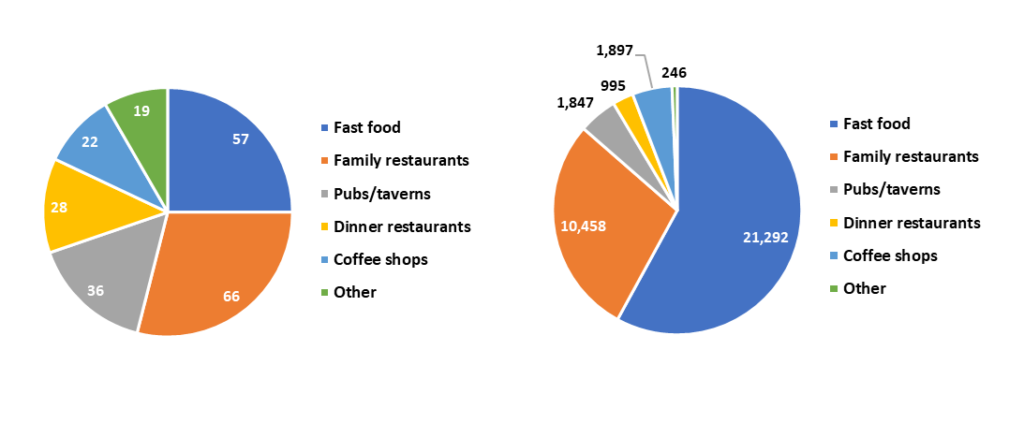
Source: Japan Foodservice Association (JF). Note: data for all stores incl. new opens. http://www.jfnet.or.jp/data/data_c.html
Japan Foodservice Association [JF] Estimated Food Service Industry Market Size (JPY trn)
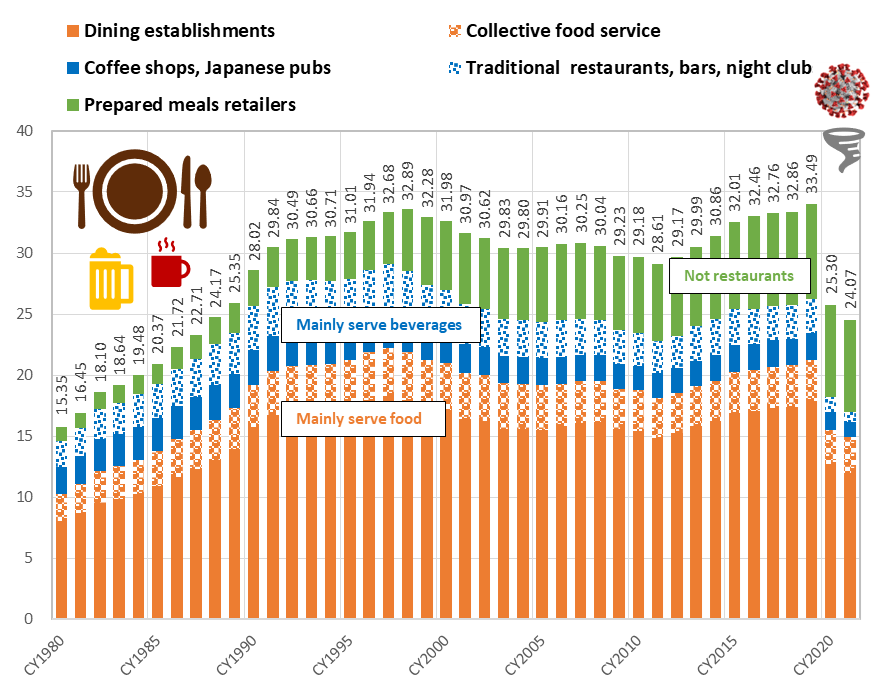
Japan Foodservice Association (JF) Estimated Food Service Industry Market Size (JPY bn)
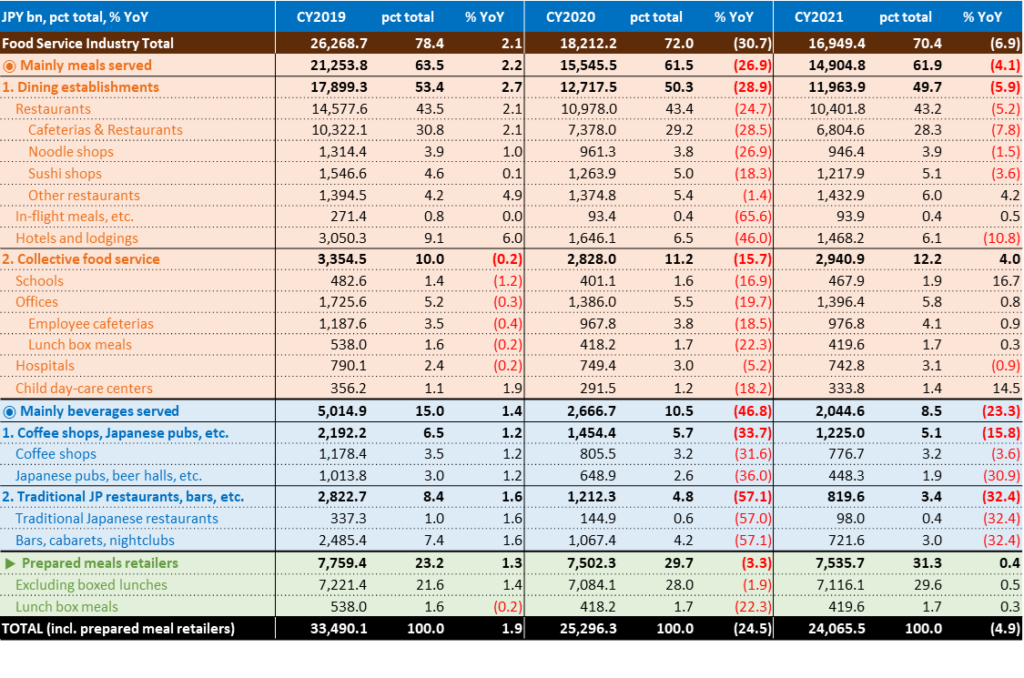
Source: Japan Foodservice Association (JF) “Estimation of Food Service Industry Market Size,” March 2023. http://www.jfnet.or.jp/data/data_c.html
JF Food Service Industry Market YoY Trend Survey – Annual Results Reports
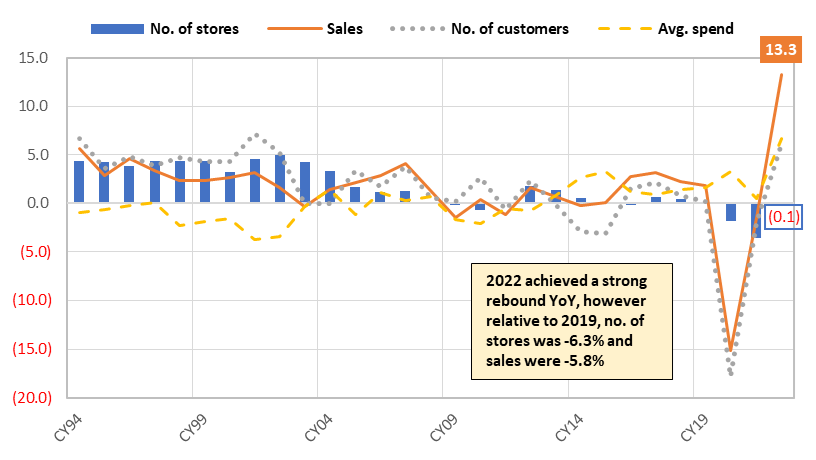
JF Food Service Industry Market YoY Trend Survey – Monthly Results Reports
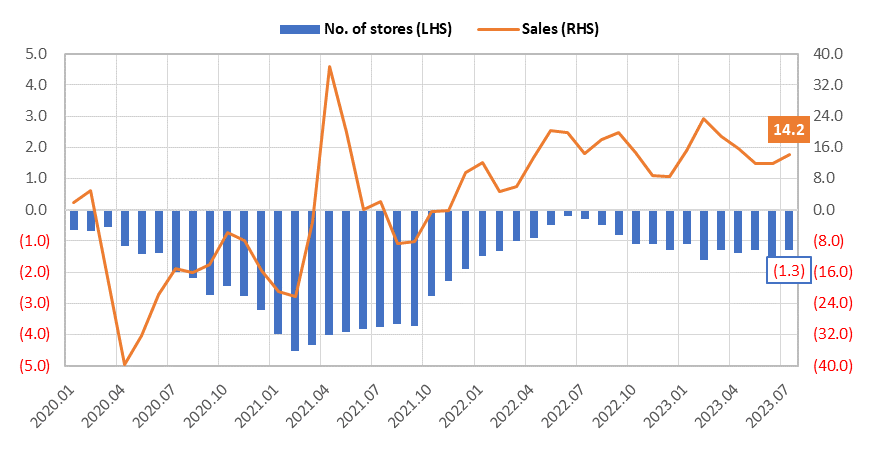
JF Food Service Industry Market YoY Monthly Trend Survey – adjusted vs. 2019*
Source: Japan Foodservice Association (JF). Note: data for all stores incl. new opens. http://www.jfnet.or.jp/data/data_c.html
Key takeaways:
❶ Net store closures of restaurants in the all-stores data is clearly a lagging indicator relative to sales. The middle graph suggests the impact from a once-in-a-century global pandemic appears to be easing, but still sluggish, against the backdrop of sharp rises in ingredients and utilities costs, etc., as well as chronic labor shortage.
❷ However, YoY figures, by definition, are versus the same month in the previous year, which can be deceptive after large swings. In order to strip out the base level effect, from Mar-2021, the JF monthly survey results report added two new columns to include sales and no. of stores comparisons versus the corresponding month in 2019 (lower graph). For Jul-2023, total sales are +12.6% relative to Jul-19, but total stores are -7.6%, yet to post any real recovery.
TENPO INNOVATION subleased store properties are uncorrelated with the market
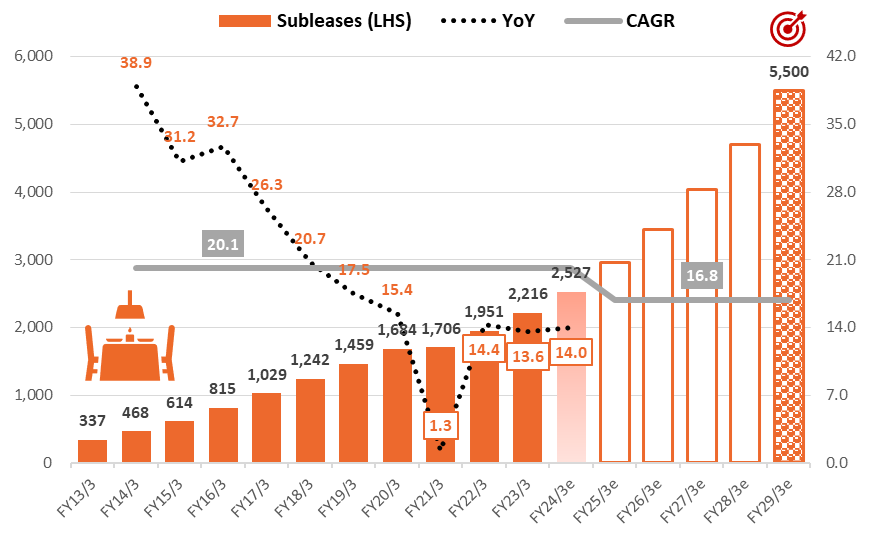
According to the JF Food Service Industry Market YoY Trend Survey for June 2023, total stores declined -1.5% YoY, and relative to March 2019, declined -7.2%, yet to post a meaningful recovery. Well, what about the trend for the Company? For the same period, subleased restaurant store properties for TENPO INNOVATION increased 12.8% YoY, and relative to March 2019, increased 48.9%. In other words, there is no correlation between TENPO INNOVATION subleased restaurant store properties and the underlying market trend for total stores. They are completely uncorrelated. The graph below shows the long-term monthly trend of the Company’s subleased restaurant store properties.
Monthly trend of subleased store properties: textbook definition of stable high growth
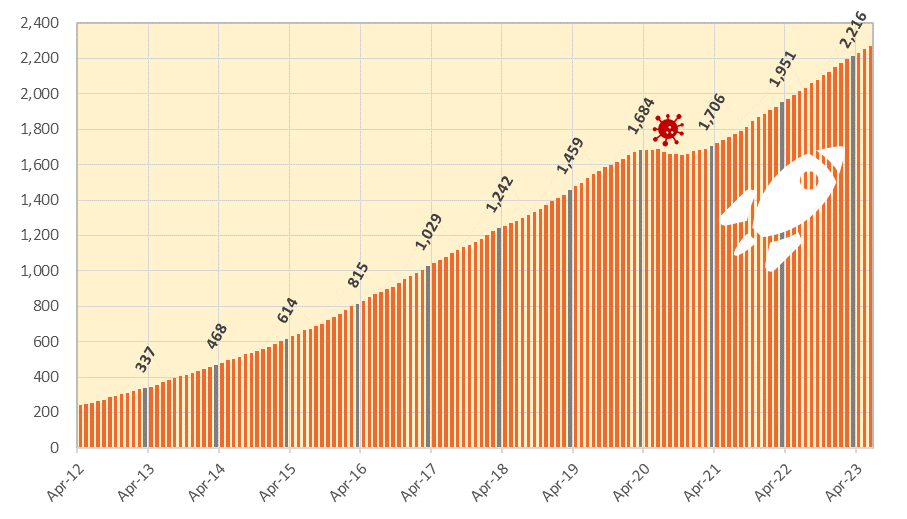
Source: compiled by Omega Investment from company IR results briefing materials.
Monthly Trend of Sublease Contract Transactions
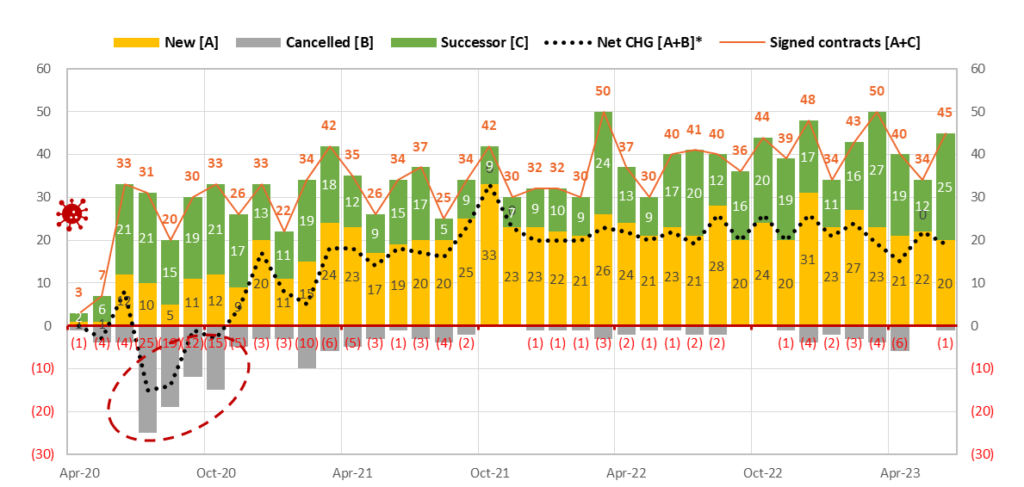
Source: compiled by Omega Investment from company IR results briefing materials. *Note: net change = “New – Cancelled” as well as reflects transfer from “sublease to leasehold” and “leasehold to sublease” (Dec 2021: -2; Jan 2022: -1; Oct 2021: +2; Nov 2022: +1; Dec 2022: -1).
TENPOINNOVATION: Sustainable double-digit growth with high stability
Source: compiled by Omega Investment from company IR results briefing materials.
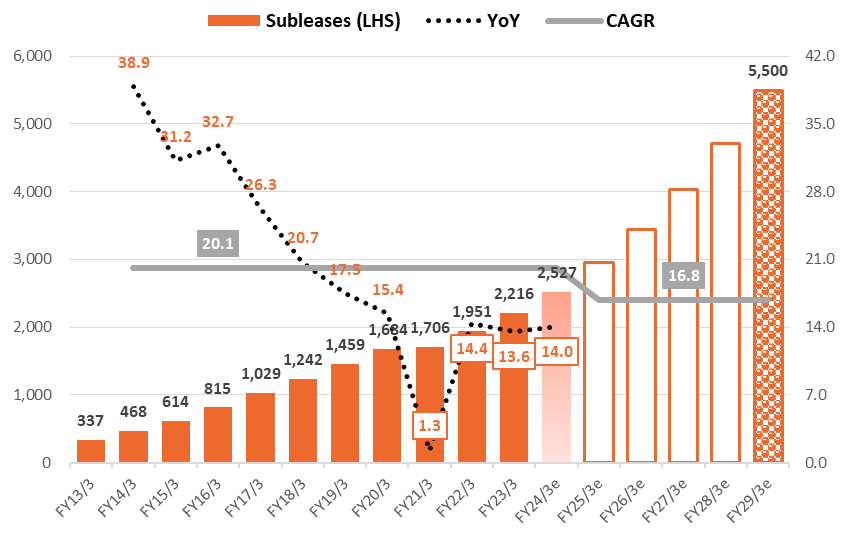
Despite the severe impact on the restaurant industry from COVID-19, TENPO INNOVATION only experienced a slight dip in the number of subleased store properties from the previous peak of 1,689 stores in Jun-20, down -1.95% or -33 stores to 1,656 at the low in Oct-20 (tiny dip at the top of the graph on P11), and then exceeded the previous peak by the end of Feb-21 to 1,690, and finished FY3/21 at 1,706 as of the end of Mar-21, +1.3% or +22 stores YoY. We examine details of the highly stable business model in Part 2, however the brief capsule summary is that when the Company concludes a lease agreement with the owner of a store property, as the tenant TI is automatically granted a lease right, whereby in principle, unless the Company cancels the agreement, it can continue to renew the lease.
The graph above shows the Company’s medium-term target for 5,500 subleased properties by the end of FY3/29, implying 5-year CAGR of +16.8% per year. This target was not randomly formulated by simply assigning a certain CAGR growth rate, rather, it is equivalent to a roughly 5% market share of the estimated 110,000 viable candidate restaurant store property universe in Tokyo and the three surrounding prefectures, based on the total number of 160,000 restaurants from the 2016 Economic Census of Business Activity. In order to achieve this target, a key initiative in the Company’s Medium-Term Management Plan is to boost its salesforce from the current 40 professionals (15 store procurement, 25 finding subleasing tenants) to 100 (30 store procurement, 70 finding subleasing tenants).
PART ② BUSINESS
Business description and strengths and attractive features of the business model
When you go to the Company’s website and open the home page, you are presented with an aerial view of central Tokyo. Then if you click on the lower right-hand corner, a 1:24 minute flashy YouTube video with a catchy soundtrack starts playing, highlighting some headline bullet points about the attractiveness of the Tokyo restaurant market.
TOKYO × TENPO INNOVATION
Grab Tokyo.
The world’s largest number of passengers Shinjuku Station: 3.59 million
The world’s largest number of restaurants Metropolitan Tokyo: 79,601
The world’s top gastronomic city No. of Michelin-star restaurants: 226
We compete in this city with the highest potential.
The world’s most traversed pedestrians Shibuya
The world’s best subculture district Akihabara
There is more we can do.
99% untapped market.
We will not stop and will keep pushing forward.
It will become a big swell and envelop this city.
From because we can do it → so we will do it.
TENPO INNOVATION: Restaurant store property subleasing specialist
TENPO INNOVATION is a real estate company, but it does not handle agency brokerage business and management business as in the case of a general real estate company. Further, TENPO INNOVATION is a real estate company specializing in stores. General real estate companies handle residential properties, offices, warehouses, parking lots, among others. The Company doesn’t handle any of these, and only specializes in store properties. And roughly 90-95% of contracts are for restaurants, so the Company is a specialist in store subleasing business for restaurants.
The Company leases mainly vacated-furnished store properties from real estate owners, and then subleases them to restaurant operators. According to the Company, the standard format of lease contracts with owners stipulates 3-months notice required to cancel a contract, and it is automatically granted a lease right, whereby unless the Company cancels a contract, in principle it can continue to renew the lease. This lease right is a key factor in the long-term stability of the Company’s subleasing business, as demonstrated in the exhibits on P10. Standard sublease contracts with restaurant operators stipulate 7-months notice required to cancel a contract. Store operators are required to give a deposit equivalent to 10-months rent, provide a co-signer on the lease, and enter a rent fulfillment guarantee agreement, now handled mainly in-house, as described on the following page.
Revenue from store subleasing business is divided into “initial” and “running.” Initial revenue consists of 1) non-refundable “key money,” a custom specific to the Japanese market, which is a mandatory payment from a new tenant to a landlord, and is not returned when the lease is cancelled, and 2) proceeds from the sale of fixtures to the new tenant entering a vacated-furnished property. Running revenue consists of monthly rent payments from store tenants. According to the Company, the breakdown is roughly 10% from initial revenue and 90% from running. While the restaurant industry itself is known to be plagued with a relatively high number of failures, making average contract length effectively immaterial, the Company says average turnover has been quite consistent over time, equivalent to roughly 10% every year, or 50% every 5 years.
Expertise in finding and subleasing relatively small, low rent, vacated- furnished restaurant store properties, mainly in central Tokyo.
Store rent guarantee business of Tenpo Safety Inc. commenced on April 1, 2022
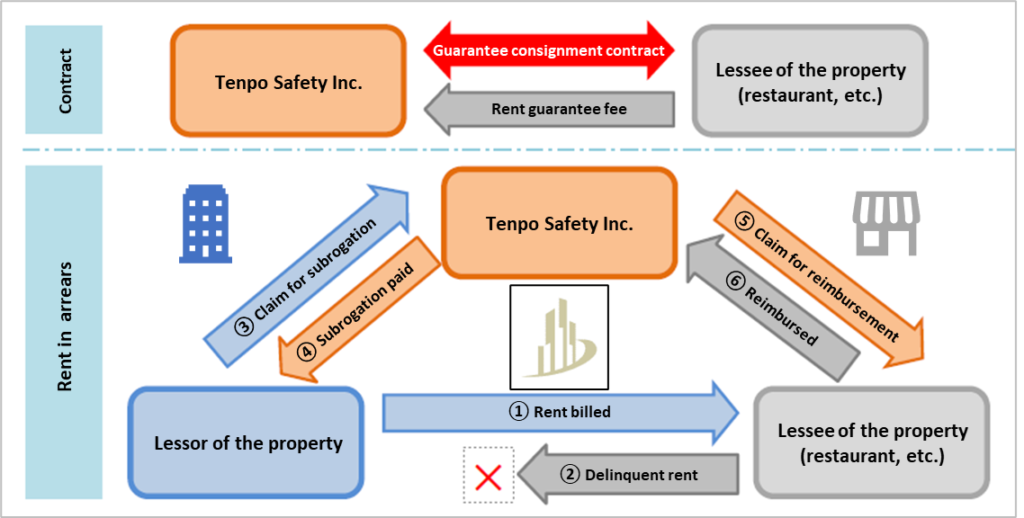
Since the Revised Civil Code went into effect from April 2020, rent guarantees for store lease properties are expanding socially as a system that benefits both property landlords and tenants. In the past, the Company had tenants enter a rent guarantee contract automatically upon application, and the business was consigned to outside providers of rent guarantees. However, with over 17 years experience in subleasing over 2,000 restaurant store properties, and unique screening know-how, the Company is fully capable of assessing the risk of its subleased properties. The Board of Directors resolved on March 24, 2022 to establish a wholly-owned subsidiary with the aim of keeping this income stream in-house.
According to the Company, every contract signed requires entering a rent guarantee agreement, and the rent guarantee fee is equivalent to roughly 1 month’s rent. The newly established Tenpo Safety Inc. handles 70-80% of these contracts, the remainder deemed to carry a higher level of risk are outsourced. Therefore, with signed contracts running at over 100 per quarter, roughly 80 contribute directly to Group profits each quarter. As described on the cover page, this business carries a virtual 100% OPM, and growth is linked directly to signed contracts. Along with the rise in profitable successor contracts, store rent guarantee business will be a structural driver of margins going forward.
Tenpo Safety Inc. Store Rent Guarantee Business Overview
The company is also engaged in real estate sales business, which is revenue recorded from the sale of real estate for sale, etc. For subleasing business, procuring attractive store properties is a key point, and real estate agents are a prime source of good information on viable candidate properties meeting the Company’s requirements. However, from a real estate agent’s point a view, one month’s rent, or roughly 200-300,000 yen, is the standard commission to find a tenant, which is not a significant amount of money. At the same time, commission on the purchase or sales of a property can be several million yen up to 10,000,000 yen.
The primary motivation to engage in this business is to establish and maintain good relationships with real estate agents, since they have valuable information on properties to procure for subleasing. The average size of a real estate purchase is small, averaging around one hundred million yen, and is quickly turned around for resale, for an average holding period of roughly 8 months (sometimes over 1 year). The average gross profit margin is around 30%. Next, we look at the typical workflow for the 3 main areas of operation for mainstay restaurant store subleasing business.
Store property leasing from owners (procurement)
Through sales activities to real estate agents by sales representatives assigned by major train station areas, introductions from business partners and existing store operators, etc., as well as through in-house website “TENPOKAITORI.com,” (‘Store buy-backs’.com) which specializes in store purchases, the Company collects information on stores that are considering withdrawing from the market, and proceeds to research properties to be handled by the Company. TENPO INNOVATION has accumulated expertise in property evaluation based on lengthy experience in handling store properties and subsequent verification and analysis of such properties.
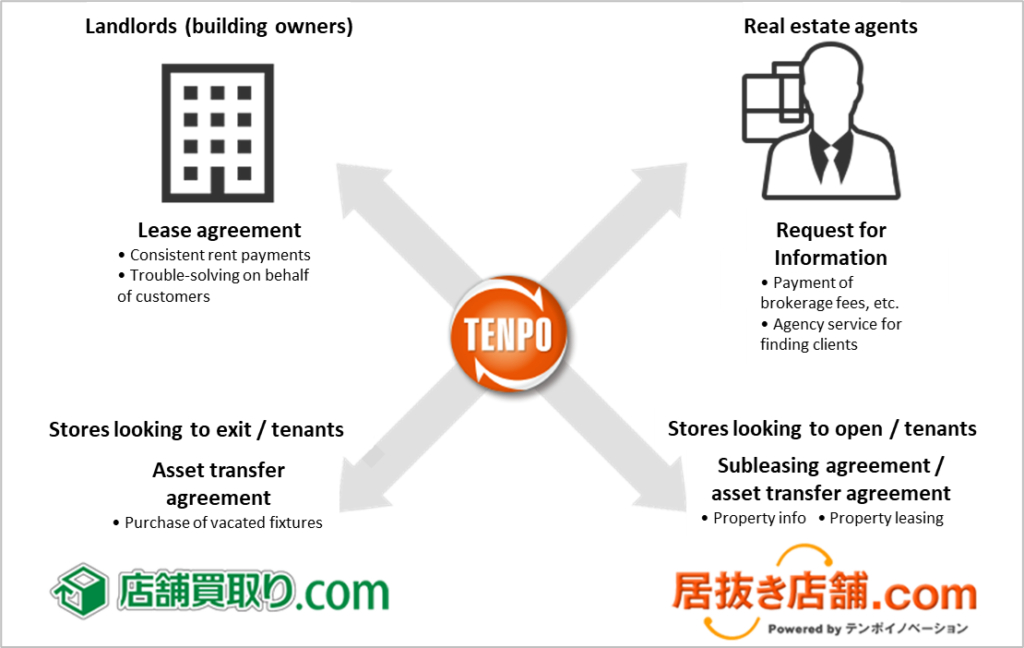
Note: TENPOKAITORI.com (‘Store buy-backs’.com) and INUKITENPO.com (‘Vacated-furnished stores’.com) are websites operated by the Company.
In addition, each property survey is conducted based on the know-how cultivated through the experience and expertise of our property management staff, which supports the handling of properties. After the property survey, we negotiate with the lender or real estate agent of the candidate property, negotiate the details of the lease agreement, pay the deposit and other contractual fees, and conclude the lease agreement between the property owner and the Company.
Store property subleasing to tenants
For store properties for which we have concluded lease contracts, we solicit prospective tenants by using real estate agents as intermediaries and by introducing them to members of our website “INUKITENPO.com” (‘Vacated-furnished stores’.com), which provides information mainly on vacated-furnished store properties, a mechanism that facilitates those who wish to open stores to search for properties. The site enhances the value of information by quickly posting and updating property information obtained daily.
As of April 30, 2023, the site has 82,114 registered applicants seeking to open stores, which is one of the Company’s strengths in matching prospective tenants with stores. In addition, the Company also conduct sales activities to approach a wide range of people who are interested in opening new stores. After receiving an application for a property from a prospective tenant, staff conduct a credit screening, negotiate the details of a sublease agreement, receive a security deposit and other contractual payments, and conclude a sublease agreement between the Company and the tenant.
Store property management
In property management work, TENPO INNOVATION is building operations by utilizing its accumulated know-how to address issues such as rent collection and troubleshooting that plague real estate owners and property management companies. In addition, in order to prevent problems or detect and deal with them at an early stage, it checks properties, collects information, and builds relationships with store operators and others.
Property Management
Property management is based on the results of on-site surveys of subleased properties. The company focuses on preventing problems before they occur, and from the property procurement stage, a detailed inspection record is prepared for each property, including leaks and equipment problems.
Screening management is conducted according to the nature and stage of the problem, and an organizational structure has been established to respond to the problem in the shortest possible time and to do everything possible to prevent serious problems. The number of properties handled by each property management staff member is approximately 130, and the department is dispatched more than 1,000 times a year.
TENPO INNOVATION Corporate History
| Date | Summary |
| 2007.11 | In preparation for spin-off, Tenpo Renovation Spin-off Unit Co., Ltd. established in Roppongi, Minato-ku, Tokyo (capital 50,000 yen, now the Company) |
| 2007.12 | Took succession of a portion of the restaurant store open and exit support business from the former Tempo Renovation Co., Ltd. through spin-off |
| 2008.01 | Company name changed to Tenpo Renovation Co., Ltd. |
| Increased capital to 10 million yen | |
| 2008.05 | Telewave Co., Ltd. (now iFLAG Co., Ltd.) acquired all shares (became a consolidated subsidiary of Telewave Co., Ltd.) |
| Head office relocated to Nishi-Shinjuku, Shinjuku-ku, Tokyo | |
| 2009.06 | Launched INUKITENPO.com (i-tenpo.com), a website for information on vacated furnished properties for restaurant stores |
| 2009.07 | CROPS CORPORATION acquired all shares (became a consolidated subsidiary of CROPS CORPORATION) |
| 2009.09 | Head office relocated to Ebisu, Shibuya-ku, Tokyo |
| 2010.04 | Increased capital to 90 million yen |
| 2010.06 | Launched TENPOKAITORI.com (k-tenpo.com), a website for buyout of vacated furnished properties for restaurant stores |
| 2012.02 | Head office relocated to Nishi-Shinjuku, Shinjuku-ku, Tokyo |
| 2012.12 | Shinbashi Branch opened in Shinbashi, Minato-ku, Tokyo |
| 2013.04 | Ikebukuro branch opened in Higashi-Ikebukuro, Toshima-ku, Tokyo |
| 2013.05 | Company name changed to Tenpo Innovation CO., LTD. |
| 2014.11 | Ueno Branch opened in Ueno, Taito-ku, Tokyo |
| 2015.05 | Roppongi Branch opened in Roppongi, Minato-ku, Tokyo |
| 2016.05 | Head office relocated to Shinjuku, Shinjuku-ku, Tokyo (4 branches including Shinbashi branch closed and integrated into head office) |
| 2017.10 | Listed on the Tokyo Stock Exchange Mothers Market |
| 2018.10 | Changed listing designation to the First Section of the Tokyo Stock Exchange |
| 2022.04 | Established Tenpo Safety Inc. (now a consol. subsidiary) and commenced store rent guarantee business |
| 2022.04 | Moved to the Tokyo Stock Exchange Prime Market |
Source: FY23/3 Annual Securities Report (YUHO financial statements), June 14, 2023
Corporate history
In November 2007, the Company was established as Tenpo-Renovation Inc. to prepare for the spin-off of Tenpo-Renovation Inc. in December 2007, and took over a part of the restaurant exit support business (introduction of properties and support for those who wish to open new restaurants, and purchase of restaurant facilities and support for those who wish to exit) from Tebpo-Renovation.
The former Tenpo-Renovation Inc. was established in October 2001 as a subsidiary of REINS International Inc. for the purpose of managing restaurants (the trade name at the time of incorporation was Rayfields Corporation, with brands such as “Gyu-Kaku,” the largest yakiniku chain in Japan, as well as Izakaya and Shabu-Shabu restaurants). In April 2005, the company started a new restaurant opening/closing support business (the actual beginning of the present Company’s business activities). At the time of the corporate spin-off in December 2007, the restaurant opening/closing support business was divided into the business related to REINS International properties and the business related to properties other than REINS International properties, and the Company took over the business related to properties other than those related to REINS International properties.
It became a consolidated subsidiary of Telewave (now iFlag) in the same year, a consolidated subsidiary of CROPS CORPORATION (9428) in 2009, and changed the Company’s name to TENPO INNOVATION in 2013.
Yasuo Hara (born December 25, 1964)
| Date | Summary |
| Nov-05 | Joined Reins International Inc., seconded to former Tenpo-Renovation Inc. |
| Jan-08 | Seconded to the Company |
| May-08 | Director and General Manager of Sales Dept. of the Company |
| Oct-09 | Director, in charge of Web Sales Dept. and Planning Sales Dept., and General Manager of Web Sales Dept. of the Company |
| Jan-10 | Director, in charge of Business Start-up Support Sales Dept. of the Company |
| Jun-11 | Representative Director, President and General Manager of Business Start-up Support Sales Dept. of the Company |
| Apr-12 | Representative Director, President and General Manager of Restaurant Store Leasing Dept. of the Company |
| Sep-14 | Representative Director, President and General Manager of Store Leasing Business Dept. of the Company |
| Oct-15 | Representative Director and President of the Company (to present) |
Note: Yasuo Hara owns 100,000 shares of the Company.
Yohei Shimura (born August 20, 1977)
| Date | Summary |
| Apr-01 | Joined Reins International Inc. |
| Apr-05 | Director of the former Tenpo-Renovation Inc. |
| Nov-07 | Director and General Manager of Administration Dept. of the Company |
| Jun-11 | Managing Director, in charge of Administration Dept. and General Manager of Administration Dept. |
| Apr-14 | April 2014 Managing Director of the Company, in charge of Administration Dept. |
| Oct-15 | October 2015 Managing Director, in charge of Business Administration Dept. and Property Management Dept. and General Manager of Business Administration Dept. of the Company |
| Jun-16 | June 2016 Managing Director, in charge of Business Administration Dept. and General Manager of Business Administration Dept. of the Company |
| Apr-18 | April 2018 Managing Director of the Company, in charge of Business Administration Dept. |
| Apr-19 | April 2019 Senior Managing Director of the Company, in charge of Business Administration Dept. of the Company (to present) |
Note: Yohei Shimua owns 504,000 shares of the Company.
Source: compiled by Omega Investment from FY23/3 Annual Securities Report (YUHO financial statements).
Major Shareholders (as of March 31, 2023)
| Name or designation | Shares Owned | Pct Ownership* |
| CROPS Corporation | 10,044,400 | 59.00% |
| The Master Trust Bank of Japan, Ltd. (trust account) | 1,124,700 | 6.60% |
| UNION BANCAIRE PRIVEE | 784,000 | 4.60% |
| Yohei Shimura | 504,000 | 2.96% |
| Nomura Trust & Banking Co., Ltd. (trust account) | 339,100 | 1.99% |
| Custody Bank of Japan, Ltd. (trust account) | 180,400 | 1.05% |
| TENPO INNOVATION Employee Stock Ownership Plan | 105,100 | 0.61% |
| Yasuo Hara | 100,000 | 0.58% |
| MSIP CLIENT SECURITIES (Standing Proxy: Morgan Stanley MUFG Securities Co., Ltd.) |
37,700 | 0.22% |
| Yushun Moriyama | 35,200 | 0.20% |
| Top 10 total | 13,254,600 | 77.85% |
| Total number of shares issued and outstanding | 17,674,400 | |
| Treasury shares | 650,588 | |
| Number of unit shareholders | 12,469 |
Source: compiled by Omega Investment from FY23/3 Annual Securities Report (YUHO financial statements).
*Note: pct ownership excludes treasury shares.
Origin of TENPO INNOVATION’s current attractive business model
When the Company was originally established in 2007, it was not real estate business, rather, consulting business to support restaurant store exiting and opening. The only thing that had been decided was to engage in business related to restaurant store openings in Tokyo, but without a clear idea of what operations would be profitable. The most important focus at that time was not only handling restaurant store properties, but also introducing the business model of prosperous restaurants in the form of franchises, undertaking construction work on store properties, consulting work for unprofitable restaurants to help them improve their sales, etc., however, the Company stopped all of these activities when demand was low and the business was unprofitable. Management found the highest demand was for introductions to vacated-furnished store properties in good locations in Tokyo, and accordingly focused efforts in that area.
TI converted its consulting business into real estate business in order to earn recurring stock income from subleasing. This was a critical turning point for the Company. It would likely have been difficult for professionals well-versed in real estate to be successful in this area. The market for store properties is quite small and highly specialized, even within the real estate industry. Management’s background was in a company that operated “Gyu-Kaku” yakiniku restaurants, and they were admittedly amateurs in the real estate field. However, they did have professional expertise in restaurant business, and significant accumulated store property know-how.
Rather than a clear plan to engage in real estate business, management’s aim was to leverage their know-how for store properties as if they were opening a restaurant for themselves. It took a while to find the right model, but this put the Company on a sustainable growth path.
Subleasing store property selection criteria, general policy on tenant selection
There are 3 main criteria when selecting properties to lease for the purpose of subleasing: 1) The store is on the ground floor facing a street, 2) rent is affordable in absolute terms, and 3) it is a vacated-furnished store. Conventional wisdom is that a “good store property” has high pedestrian traffic, is near a station and/or is located on a main street. For fast food and other major restaurant chain stores, that is likely a requirement. However, for individual or small business restaurant operators, the corresponding high rents for those store properties is simply a non-starter economically, considering initial start-up costs in addition to running costs. In TI’s accumulated experience, there is always high demand for store properties with low rent and that are vacated-furnished stores, even if the location is slightly further away from a station. Similar to low rent, the key point about vacated-furnished properties is lowering the initial investment cost.
According to the Company, there are actually not many requirements when selecting prospective tenants. The Company is quite strict in selecting store properties to procure for subleasing, however in the case of prospective tenants, after undergoing a routine credit screening, incoming tenants are required to put down a 10-month security deposit, have a co-signer on the lease as guarantor, and enter a rent guarantee agreement. In the end, it is very difficult to judge whether a new tenant will have a successful restaurant business or not, since the restaurant industry itself has a high open and close ratio, and many restaurants are prone to failure. TENPO INNOVATION’s business model is designed such that, even if a tenant opens a restaurant that fails, if the store property meets the aforementioned criteria, the Company can simply recruit the next tenant, as these store properties are always in high demand.
Attributes of prospective tenants that work in their favor would include having existing store (s) with a good track record, as well as being able to fund the opening without taking out a loan. Regarding type of restaurant format, TENPO INNOVATION’s portfolio reflects general trends in the overall market. For example, there are a large number of Izakaya (Japanese-style pubs) and ramen (Chinese noodles) shops as tenants.
Reasons TENPO INOVATION’s business model can deliver both growth and stability
Regarding stability, a key point is the lease right automatically granted when TI leases a store property from an owner. In principle, unless the Company cancels the lease contract, it can continue to renew it. In the case of the global outbreak of COVID-19 from Feb-2020, confronted with declarations of a state of emergency, stay-at-home orders and shortened/suspended business hours for restaurants by the Governor of Tokyo, out of an abundance of caution, TI decided to give 3-months notice on a certain number of lease contracts in April, resulting in the pickup in contract cancellations in July through October of that year. However, strong underlying demand for TI’s carefully selected store properties supported a rapid turnaround.
Regarding growth, there is the growth achieved from steadily increasing the number subleased store properties. However, there is also a less understood structural growth element from rising profit margins on store subleasing business. Specifically, there are initial acquisition costs associated with entering a new lease agreement, including one-time costs of non-refundable key money, contract-related costs, etc. Annual subleasing contract cancellations have been consistent over time, averaging 10% every year, or 50% every 5 years. When one of TI’s existing tenants exits the business, and a new tenant is recruited, the aforementioned acquisition costs of the store property were sunk on the first subleasing contract, and from the second contract onward, key money and other initial income are effectively pure profits, without an associated acquisition cost. Roughly 35% of current sublease contracts have been replaced by successor tenants, but this ratio is steadily rising over time, resulting in a steady structural increase in profit margins going forward.
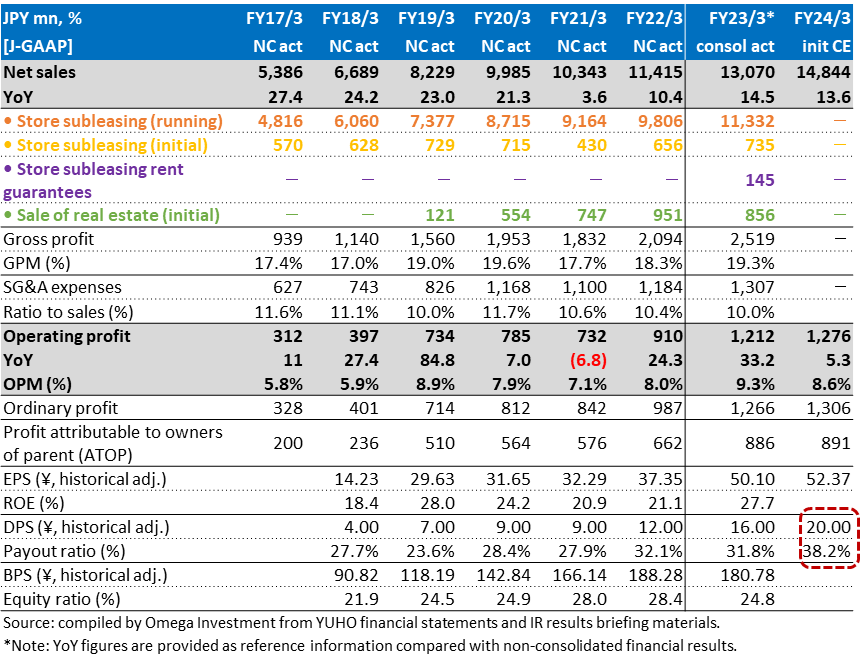
FY23/3 consolidated net sales +14.5% and OP +33.2%
Since the Company began consolidating the accounts of newly established wholly-owned subsidiary Tenpo Safety Inc. (rent guarantee business explained on P15) from FY23/3, YoY figures are provided for reference versus non-consolidated results the previous term. Net sales increased +14.5% YoY, OP increased +33.2% YoY, GPM rose from 18.3% → 19.3%, and OPM rose from 8.0% → 9.3%. In addition to the contribution from new high-margin rent guarantee business, store subleasing business got a boost from the increase in new successor contracts from 135 → 197 (+45.9% YoY). Store subleasing sales increased +16.7% (sublease properties rose to 2,216, +13.6%), and store subleasing OP of ¥962mn increased +32.9%.
Real estate trading business got a boost from the sale of 5 properties which included several large-scale profitable properties (see graph below). In FY23/3, 5 properties were sold and 8 properties were acquired (Q4-only: 0 properties sold, 3 properties acquired), bringing the number of properties held by the Company to 6 at the end of FY23/3. Real estate trading sales declined -9.6%, however real estate trading OP of ¥251mn increased +34.7%. Although the primary objective of this business was to maintain a good relationship with RE brokers by paying meaningful commissions in return for good information on sublease candidates, the Company has recently also received interest from existing owner landlords to purchase properties, enhancing a stable supply pipeline without referrals, and this is now a full-fledged business.
4Q FY23/3 Quarterly Trend of Sales Breakdown by Revenue Category (JPY mn)
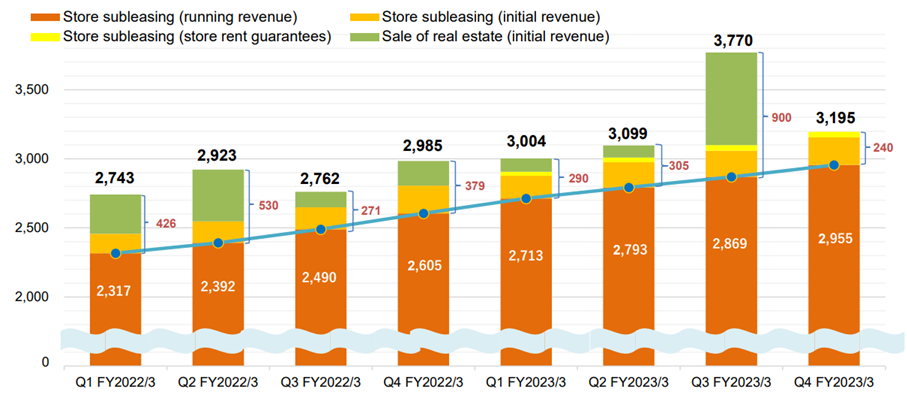
Note: initial income includes one-time payments of key money, contract-related fees and proceeds from the sale of fixtures from vacated-furnished store properties. Running income includes rent income and contract renewal fees from sublease tenants. Store sublease rent guarantees include some running income. Figures for 1Q FY23/3 are consolidated; figures for 4Q FY22/3 and earlier are non-consolidated. Source: excerpt from IR results briefing materials.
TENPO INNOVATION 4Q FY23/3 Financial Results Summary
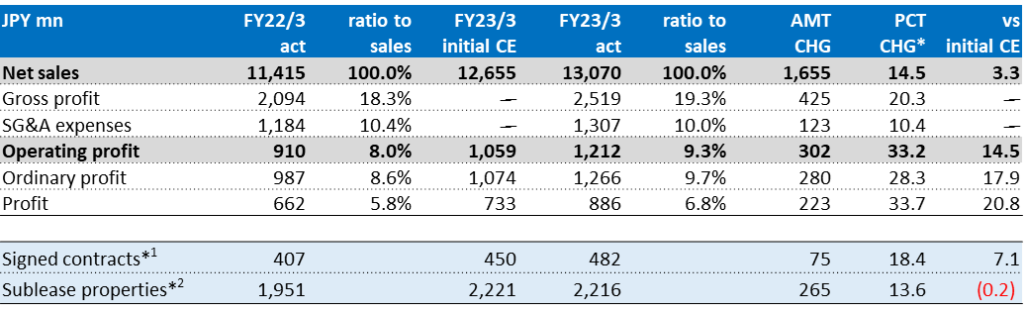
*YOY comparisons are provided as reference values versus the previous year’s non-consolidated figures.
Note: *1 = new plus successor contracts signed. *2 = number of active sublease contracts at FY end.
Source: compiled by Omega Investment from IR results briefing materials.
1Q FY24/3 consolidated net sales +13.5% and OP -14.6%
While the environment for the restaurant industry continued to gradually improve during the 1Q given the first Golden Week with COVID restrictions on movement lifted and resumption of inbound tourism, restaurant operators faced headwinds from the sharp rise in meal ingredients and utilities costs, as well as chronic labor shortage. Nevertheless, interest remained strong among individual and small restaurant business operators for the Company’s relatively small, ground floor facing, affordable rent and vacated-furnished subleasing store properties. Store subleasing sales increased +12.4% (sublease properties rose to 2,272, +12.8%). However, store subleasing OP declined -14.0% due to GPM declining 1.8pp on the increase in vacant rents due to aggressive procurement of new sublease store properties, while the ratio of SG&A to sales deteriorated 0.5pp on increased salary and recruiting expenses, executive compensation linked to the previous year’s strong performance, and DX system investments such as the move to electronic contracts, etc.
Real estate trading business sold 2 properties and acquired 5, bring the total inventory to 9 as of the end of June. While sales increased +44.3%, OP declined -18.4% on lower margins reflecting the weak market. Although the table below shows the 1Q progress ratio for OP was slightly behind at only 19.2%, the key takeaway from 1Q results is that margins were depressed due to aggressive procurement of new sublease stores and recruitment, which the Company expects to leverage over the next 9 months.
1Q FY24/3 Quarterly Trend of Sales Breakdown by Revenue Category (JPY mn)
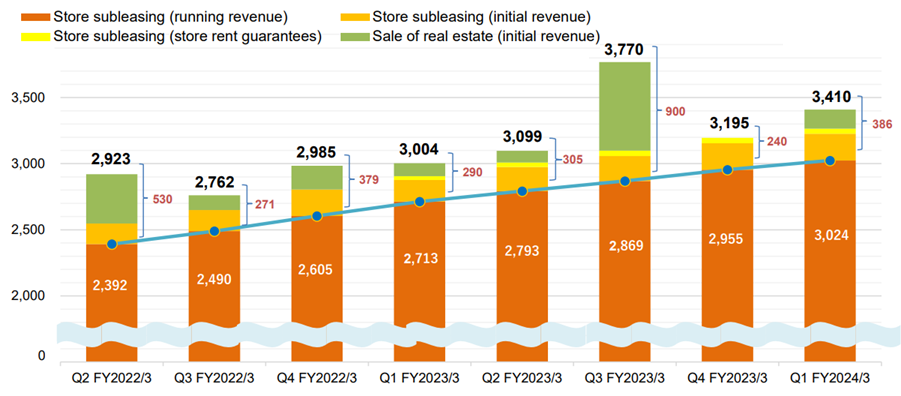
Note: initial income includes one-time payments of key money, contract-related fees and proceeds from the sale of fixtures from vacated-furnished store properties. Running income includes rent income and contract renewal fees from sublease tenants. Store sublease rent guarantees include some running income. Source: excerpt from IR results briefing materials.
TENPO INNOVATION 1Q FY24/3 Financial Results Summary
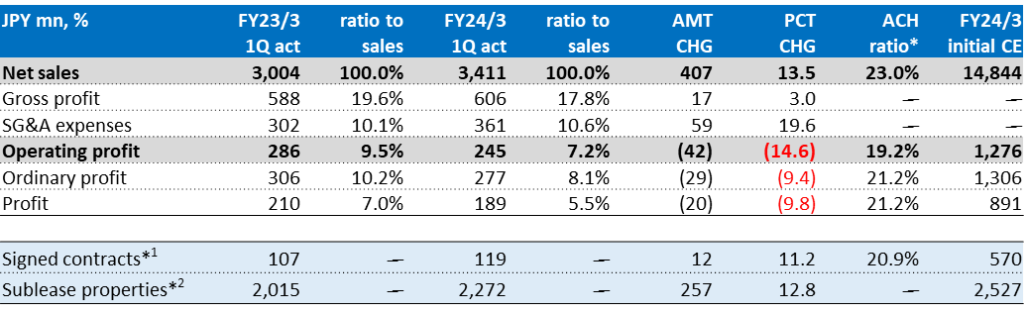
Note: *1 = new plus successor contracts signed. *2 = number of active sublease contracts at FY end.
Source: compiled by Omega Investment from IR results briefing materials.
*ACH ratio = percent progress relative to full-term initial guidance.
TENPO INNOVATION Medium-Term Management Plan
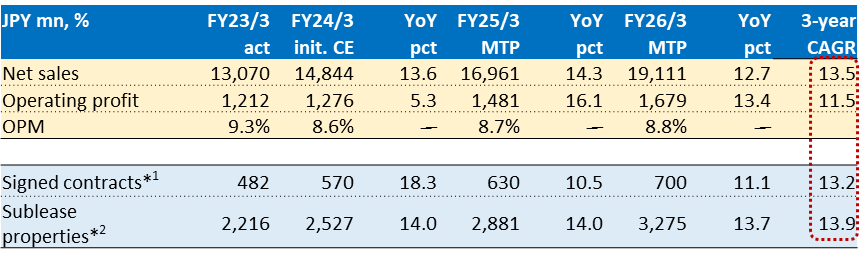
Note: *1 = new plus successor contracts signed. *2 = number of active sublease contracts at FY end.
Source: compiled by Omega Investment from IR results briefing materials.
Priority initiative to strengthen and enhance the sales force (see exhibit on P24)
The Company has the following medium-term and long-term targets.
By FY26/3, increase the Sales Dept. from 36 professionals to 100 (currently 14 in charge of property procurement → 30, 19 in charge of finding tenants → 70, 3 dual roles).
(Depending on the success of DX etc., optimal sales team size may be 80-90)
As of the end of June, there are 15 procurement staff and 25 tenant leasing staff (40), and separately 4 executives/managers from other departments, some involved with purchasing. ▶Subleased store property net adds to 600 per year (by FY27/3) ▶Contracts signed to 1,000 per year (by FY28/3) ▶
By FY29/3, increase the number of active subleased store properties to 5,500 ▶Net sales ¥30 billion ▶Operating profit ¥3 billion ▶OPM 10.0%
As TENPO INNOVATION is the only specialist firm engaged in this restaurant store property subleasing business, this is no easy task, and cannot be accomplished by simply directing a headhunting firm to find the required personnel (they simply do not exist). Management fully recognizes that the way forward is to find suitable personnel and provide advanced level on-the-job training by existing professional staff. The point is that there is a lot of technical background knowledge required about property specifications such as the correct amperage requirements for electricity supply, drainage pipe diameter, etc., as well as expertise and know-how in retail properties, the restaurant industry, the city, restaurant facilities, and legal matters.
The Company summarizes its HR strategy for the Sales Dept. in a 3-point plan: ① increase staff, ② provide advanced OTJ training and ③ assign capable sales staff to property procurement. Management envisions this extensive training for sales staff to find tenants for subleasing will take one year. Specifically, it will try to develop a standard method of passing on the expert knowledge involving the 237 items/steps from introduction of the property to concluding a subleasing agreement. Then, recognizing that procurement has a high level of difficulty and strategically holds the highest importance to future growth, it will optimize transfer and assignment of capable sales staff.
Then, in order to achieve the second long-term goal above of increasing the number of active subleased store properties to 5,500 by FY29/3, management will employ a strategy of ④ procurement area focus. Specifically, roughly 30 procurement staff will cover approximately 1,000 station areas and 2,000 real estate agents. For terminal stations with more than 1 million passengers and major real estate agencies, multiple procurement staff will be assigned. The target is to achieve procuring roughly 600 store properties per year (or 50 per month) by FY27/3.
The biggest risk to achieving medium-term targets lies in successful execution of its sales force recruitment/training/assignment plan, particularly for sublease store property procurement. At the same time, management is proactively working to offset the risk of failing to secure sufficient human resources through reorganization of sales methods, assigning executives from other departments, and proactive deployment of DX system investments. The table below shows that key management indicators particularly for growth and profitability made significant advances in FY23/3.
Trend of Key Management Indicators
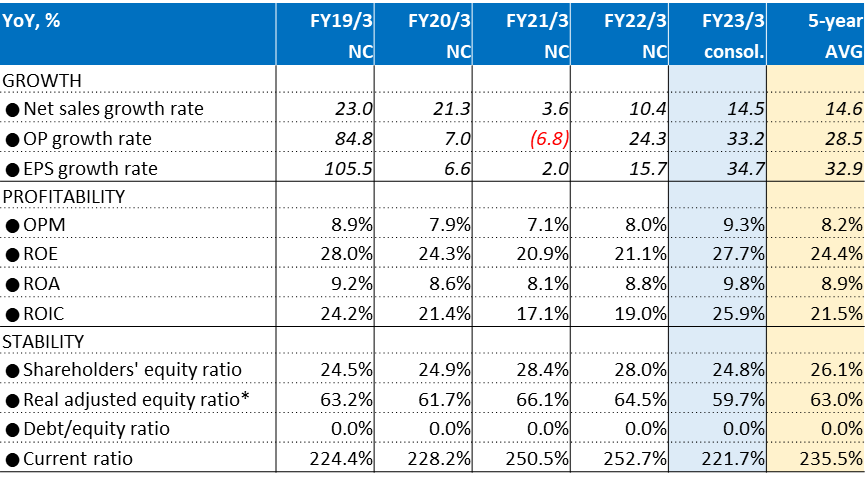
Source: compiled by Omega Investment from FY23/3 IR results briefing material.
*Note: calculated to net out the large amount of security deposits and advances received, highlighted in yellow on P26.
[Reference] Overview of Sales Force Strategy
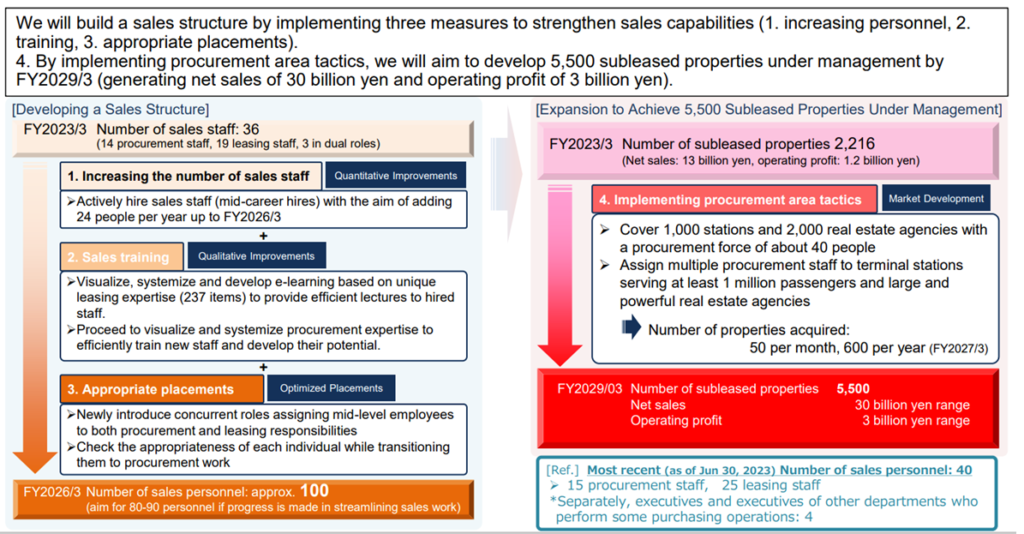
Source: excerpt from 1Q FY24/3 company IR results briefing materials.
PART ④ SHARE PRICE
3Y Share Price Chart, 13W/26W/52W MA, Volume and Trend of Valuations
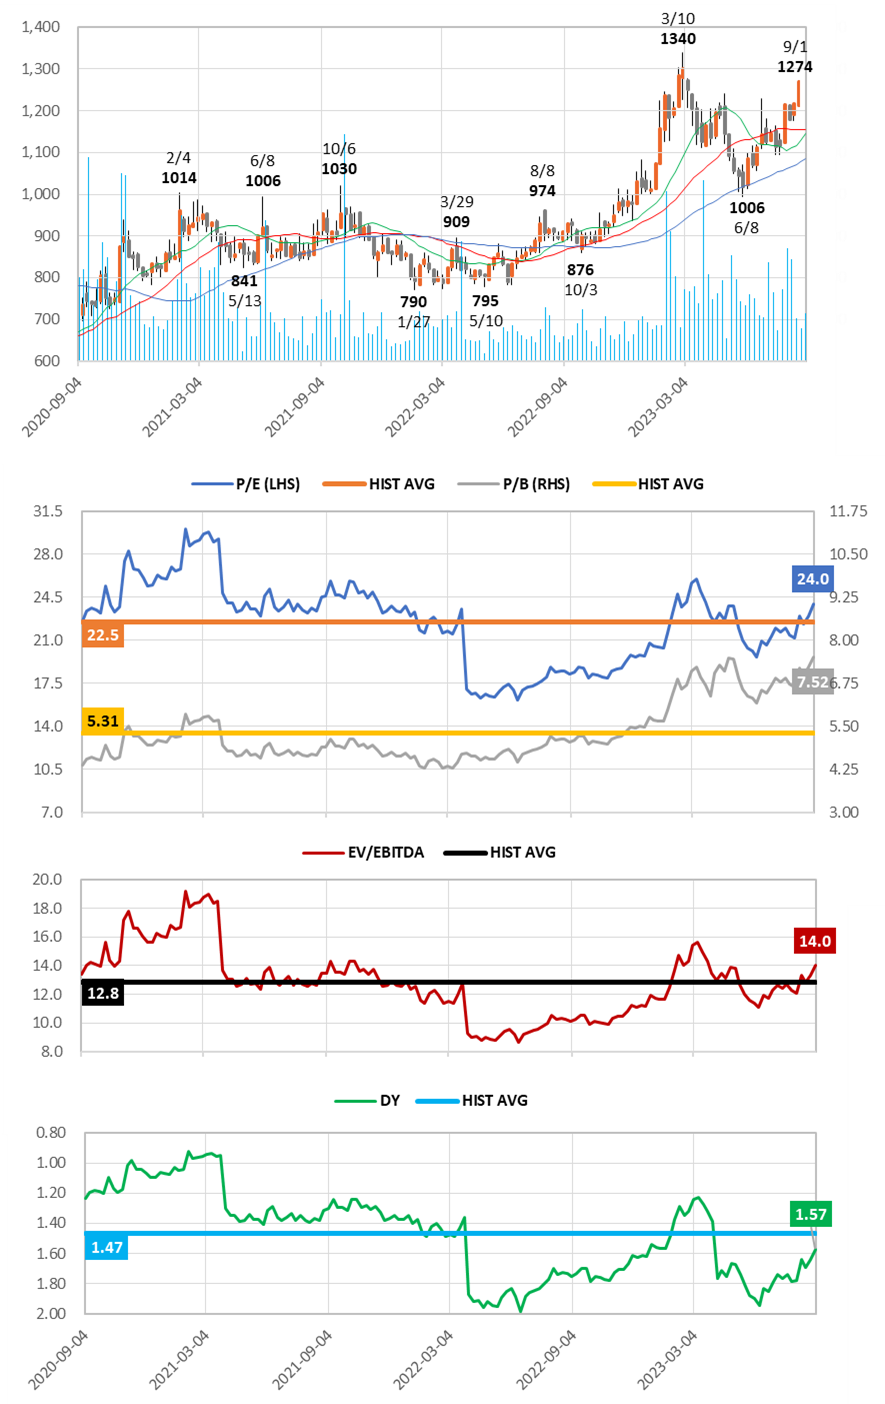
Source: compiled by Omega Investment from historical price data. Forecast values based on current Company estimates.
Key takeaways:
❶ Following the natural adjustment after the rise on two share buybacks, as well as the steady rise in profitability driven by the two structural growth drivers of new high-margin rent guarantee business as well as increase in successor contracts, the share price has basically seen right through weak 1Q profits as temporary, rallying toward a new high. And despite the rally, valuations are still trading near historical averages.
❷ The equity ratio on the surface may appear low at 22.5%, however this reflects the fact that the B/S is comprised of a large amount of deposits paid and received (see B/S on next page). The Company is debt-free, and the B/S is extremely healthy.
❸ Following the revised dividend policy from FY24/3 raising target payout from 30% → 40% (see P28 for details), the current dividend yield is still on a slight discount.
Consolidated balance sheets
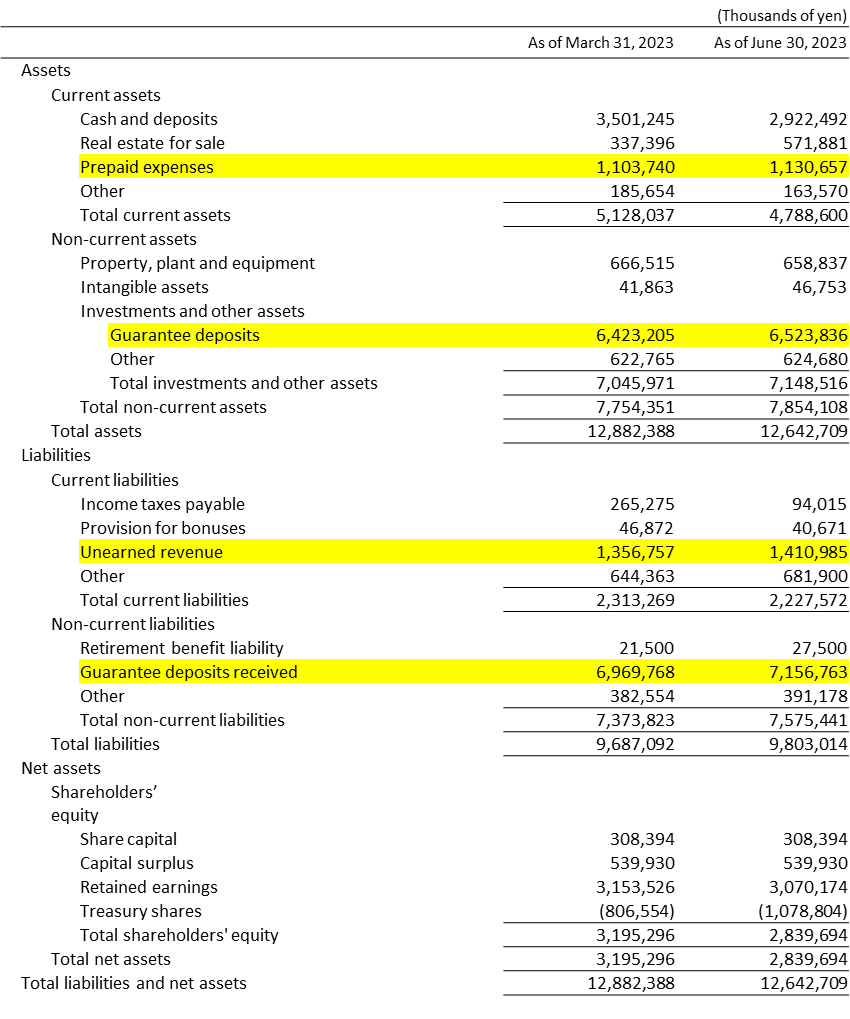
Source: Summary of Consolidated Financial Results (TANSHIN financial statements)
3Y Relative Share Price Performance and 5Y Trend of GP/OP and GPM/OPM
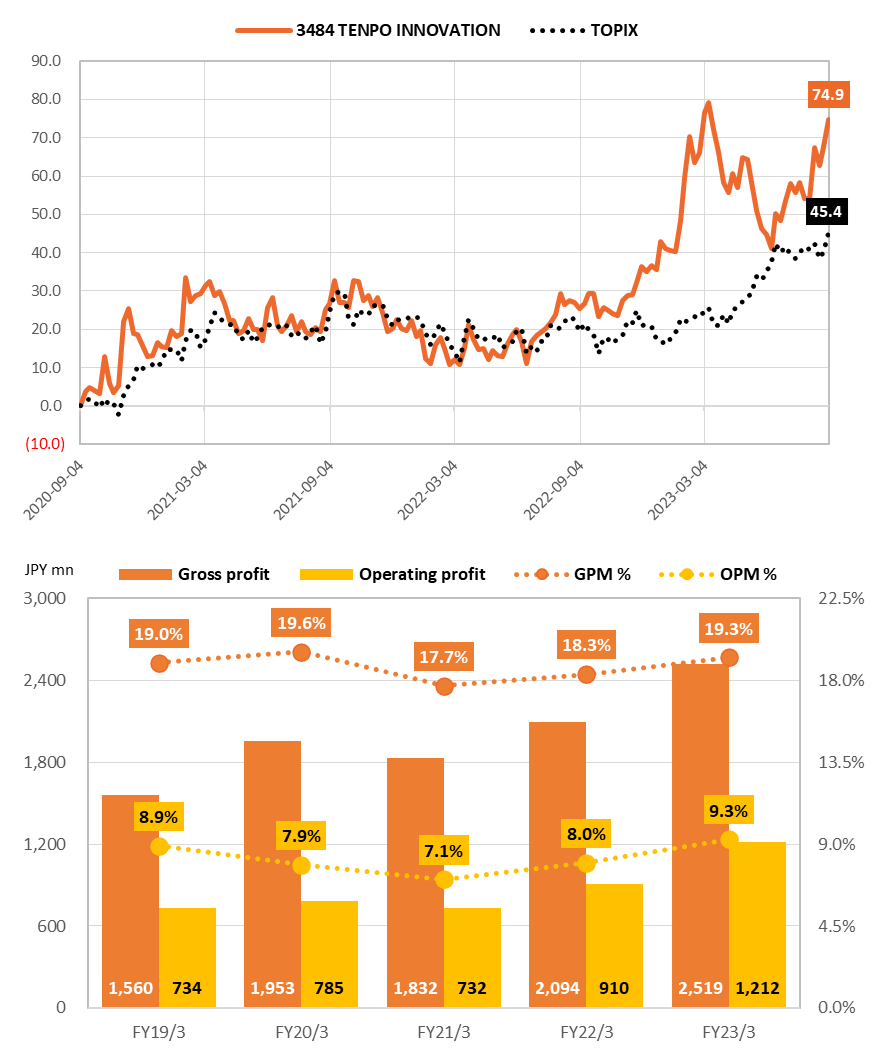
While COVID-19 gave a boost to the Company’s business by increasing turnover, the current phase has even more potential as the number of individual and small restaurant business operators seek to open new restaurants in preparation for the recovery phase. Omega Investment believes current valuations remain attractive ahead of this growth opportunity with stability manifesting itself.
Shareholder Return Policy
The Company’s basic policy is to pay stable dividends while strengthening its management base. The revised dividend policy from FY24/3 shown below aims to raise the target payout ratio from the 30% level ➡ the 40% level.
Trend of Dividends Paid and Payout Ratio
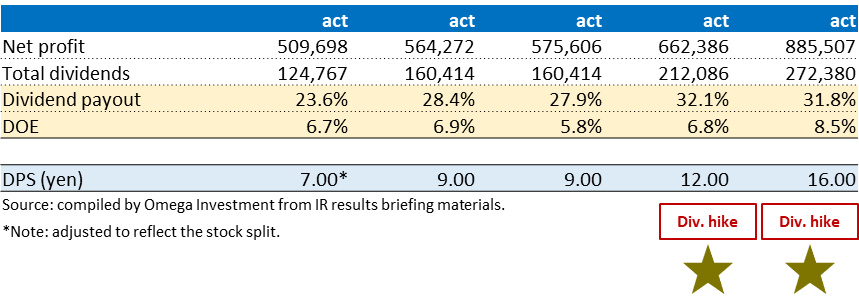
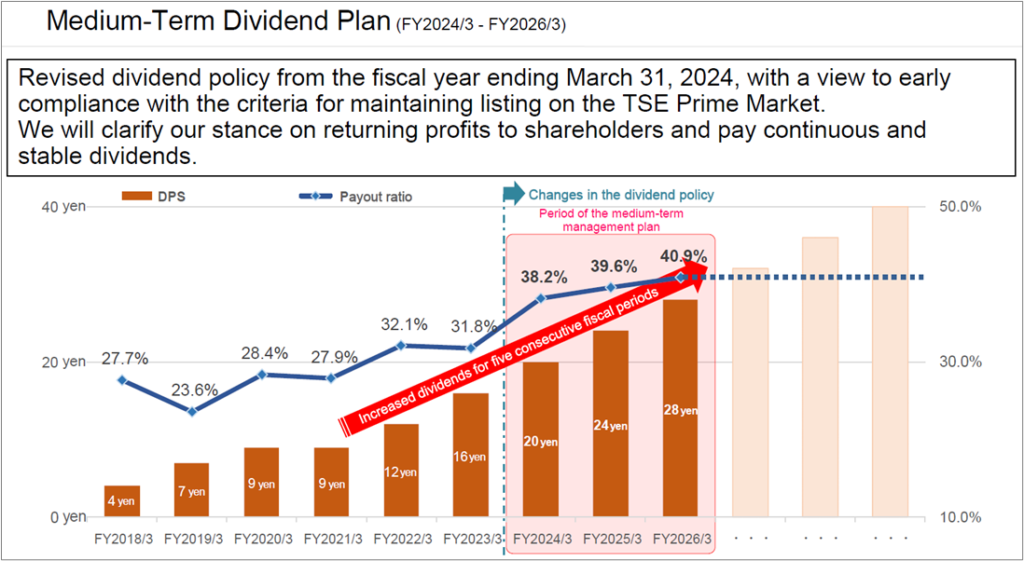
Source: excerpt from IR results briefing materials. Note: Figures from FY2023/3 onward are consolidated. Figures up to FY2022/3 are non-consolidated. Listed amounts for dividends per share have been retroactively adjusted to reflect stock splits. Dividends per share and dividend payout ratios during the medium-term management plan (FY2024/3 to FY2026/3) are company estimates.