2026-07-27
Home
Japanese

Omega Investment Co., Ltd.
Hamee (Company note – basic)

| Share price (11/7) | ¥969 | Dividend Yield (24/4 CE) | 2.3 % |
| 52weeks high/low | ¥1,210 / 677 | ROE(23/4) | 11.1 % |
| Avg Vol (3 month) | 87 thou shrs | Operating margin (23/4) | 9.1 % |
| Market Cap | ¥15.4 bn | Beta (5Y Monthly) | 1.7 |
| Enterprise Value | ¥13.9 bn | Shares Outstanding | 15.9 mn shrs |
| PER (24/4 CE) | 10.3 X | Listed market | TSE Standard |
| PBR (23/4 act) | 1.7 X |
| Click here for the PDF version of this page |
| PDF Version |
The company plans to spin off the Platform Business and list it. Positive expectations that it may well maximise business value and the corporate value will be reassessed.
Summary
◇Hamee Corp. was founded in 1997, listed on the TSE Mothers in 2015 and is currently listed on the TSE Standard Market, shifting from the Prime Market. Its primary businesses are the Commerce Business and the Platform Business, which sells services developed in developing the Commerce Business. Both are profitable. The company’s consolidated results for FY4/2023 were sales of JPY 14 billion, operating income of JPY 1.3 billion, total assets of JPY 12.3 billion, net assets of JPY 9 billion and 428 employees. According to the current Mid-Term Management Plan, the company aims to grow both businesses to achieve sales of JPY 22.5 billion and an operating income of JPY 3.3 billion in FY4/2026.
◇‘Commerce Business’, the ancestral business: To date, the mainstay of this business has been the planning, development and manufacture of mobile accessory products, as well as e-commerce sales and wholesale to mass retailers. The iFace series of in-house designed products is gaining recognition, particularly amongst younger consumers. Although the business scale is growing in the medium term, and segment net sales for FY4/2023 rose to 10.66 billion (+3% YoY), segment profit declined to 700 million (-63% YoY). Consumption trends and new smartphone sales trends appear to have had an impact. The company has been using its expertise in the mobile accessories business to diversify its business into Gaming Accessories, Cosmetics and Global Business. It is currently in the process of seeing the results of these efforts.
◇‘Platform Business’: For e-commerce businesses that are developing internet shopping, the company has developed ‘Next Engine’, a cloud (SaaS) EC Attractions that automates operations related to online shop management, cross-mall type order processing for multiple shops and centralised management of inventory status, and provides it to more than 5,000 medium-sized businesses. The business has a high marginal profit ratio as its net sales structure is linked to the number of orders processed. Therefore, if the number of subscribers and their utilisation rates increase, high profitability will be achieved. The company has been steadily growing sales and profits. Furthermore, it is developing measures such as cultivating small businesses, raising APRU by reviewing fee rates and developing a B2B matching platform between businesses to bolster growth going forward.
◇Mid-Term Management Plan and Reorganisation: The company revised its previous Mid-Term Management Plan and announced it as a three-year plan in June 2023. It aims to grow both businesses and achieve maximum profits by FY4/2026.
In 2022, the Commerce and Platform Businesses were separated to create a more flexible operating structure. Moreover, In July 2023, the company announced plans for a share-distribution-type spin-off of NE Inc., which runs the platform business, by 2025 and to list NE Inc. on the stock exchange.
◇Points of interest: The company has announced its financial results for Q1 of FY4/2024; these show an increase in sales and a decrease in profits. On the other hand, the seeds of results from project measures are also beginning to emerge, such as an increase in Next Engine Business contracts and a significant increase in sales in the Cosmetics Business. On the other hand, the share price is highly linked to short-term financial performance trends while being cool about medium-term growth potential. Financially, the company has a net cash position, and there is little cause for immediate concern.
For the time being, the investment focus is on when the company will return to a growth trend in sales and profits, whether KPIs such as the number of subscribers and ARPU in the Platform Business will grow steadily, whether the Cosmetics Business in the Commerce Business will be on track to become profitable and whether the Commerce Business as a whole will move towards stable growth as the product mix expands, and whether the share price will again factor in growth potential.
Table of contents
| Summary | 1 |
| Key financial data | 2 |
| Company profile | 3 |
| History | 4 |
| Business overview | 5 |
| Platform business | 5 |
| Commerce business | 10 |
| Mid-Term Management Plan (FY4/2024 – FY4/2026) | 12 |
| Corporate reorganisation (spin-off of subsidiary NE Inc. and the IPO plan) | 15 |
| Financial results | 16 |
| Share price trend | 21 |
| Equity stories and equity investors’ focus | 22 |
| Useful information | 23 |
Key financial data
| Fiscal Year | FY4/2017 | FY4/2018 | FY4/2019 | FY4/2020 | FY4/2021 | FY4/2022 | FY4/2023 | |
| Net sales | JPY, mn | 8,502 | 9,377 | 10,303 | 11,325 | 12,364 | 13,413 | 14,038 |
| Ordinary profit | JPY, mn | 1,048 | 1,267 | 1,179 | 1,757 | 2,149 | 2,330 | 1,400 |
| Net income | JPY, mn | 696 | 873 | 821 | 1,069 | 1,556 | 1,744 | 945 |
| Number of shares outstanding | Shares, mn | 15.8 | 16.1 | 16.1 | 16.1 | 16.3 | 16.3 | 16.3 |
| Net asset | JPY, mn | 2,756 | 3,597 | 4,189 | 4,824 | 6,528 | 8,253 | 8,961 |
| Total asset | JPY, mn | 4,240 | 5,042 | 5,761 | 8,097 | 8,339 | 10,518 | 12,320 |
| Book value per share*1 (JPY) | JPY | 170 | 216 | 254 | 297 | 405 | 513 | 557 |
| EPS*1 (JPY) | JPY | 44 | 55 | 51 | 67 | 98 | 110 | 59 |
| Equity to asset (%) | % | 64 | 69 | 70 | 58 | 77 | 78 | 72 |
| ROE (%) | % | 30 | 28 | 22 | 25 | 28 | 24 | 11 |
| Cash flow from operating activities | JPY, mn | 576 | 1,246 | 651 | 1,934 | 1,941 | 1,186 | 695 |
| Cash flow from investing activities | JPY, mn | -433 | -674 | -671 | -1,020 | -412 | -886 | -1,507 |
| Cash flow from financing activities | JPY, mn | 69 | -230 | -7 | 933 | -1,736 | 298 | 263 |
| Cash and cash equivalents at end of period | JPY, mn | 1,324 | 1,695 | 1,660 | 3,453 | 3,355 | 4,026 | 3,536 |
| Number of employees | Person | 233 | 285 | 309 | 353 | 387 | 403 | 428 |
Source: Omega Investment from company data, rounded to the nearest whole number.
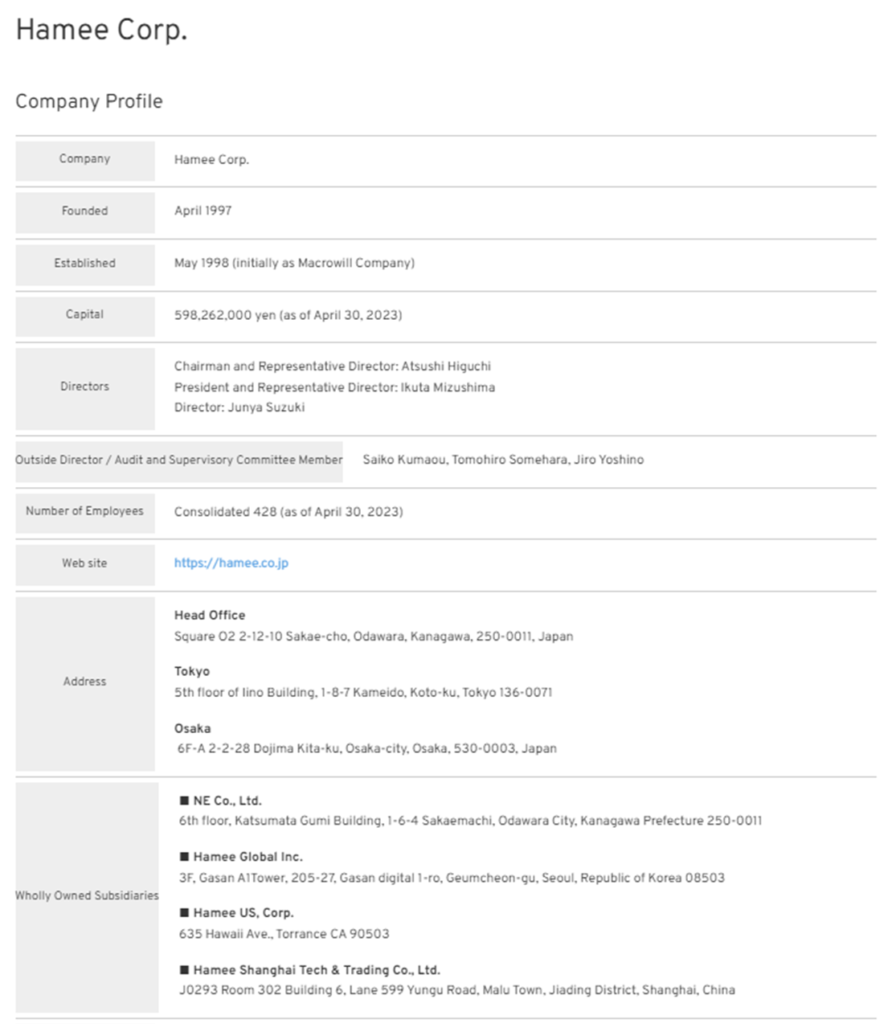
Company profile
Hamee Corp. (“the company”) was founded in 1997 by Atsushi Higuchi, Chairman and Officer.
The company currently has two primary businesses: the Commerce Business, which focuses on planning, wholesale sales and in-house e-commerce of accessories for mobile devices such as smartphones. The other is the Platform Business, which provides SaaS-type services such as streamlined ordering and inventory management to businesses that open multiple EC sites.
According to consolidated results for FY4/2023, the company delivered net sales of JPY 14 billion, operating income of JPY 1.3 billion, total assets of JPY 12.3 billion, net assets of JPY 9 billion and employs 428 people.
The company’s business performance has expanded steadily. As shown in the performance trends for the last seven years (previous page), revenues have continued to increase, and the company has consistently generated profits every year. By division, the Commerce Business has fluctuated from year to year, but the Platform Business has continued to increase revenues and profits steadily. These businesses generate a good balance of earnings. Cash flow has remained strong, the equity ratio is high and return on equity (ROE) has maintained a double-digit level despite a gradual downward trend. Although sales increased and profits declined in FY4/2023, the company expects rising sales and earnings in FY4/2024 YoY.
The shares were listed on the TSE Mothers in 2015, on the TSE First Section in 2016, on the TSE Prime Market in 2022 and currently are traded on the TSE Standard Market.
Trends in net sales and their composition
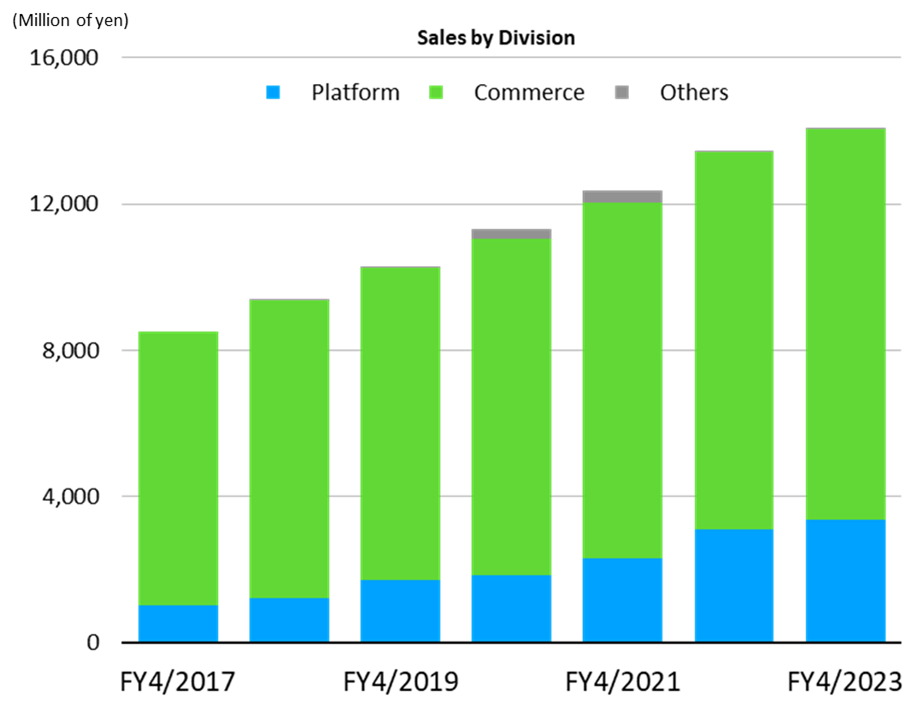
Source: Omega Investment from company materials.
History
The company’s ancestral business is the ‘Commerce Business’. First, the company developed the planning, wholesale sales, and in-house e-commerce of accessories for mobile devices such as mobile phones and smartphones, and the iFace series of in-house designed products, in particular, became well-known domestically and internationally. Next, the company is bolstering its business base by applying its expertise in business development to gaming accessories and cosmetics.
The Platform Business was developed as a solution for the Commerce Business and is now a stand-alone business. The Next Engine Business system, which was developed in-house to reduce the management burden of inventory, order receipt/placement, product management, and other aspects of the multi-store online e-commerce business, was made available to external parties in 2008 and offered in a SaaS format, which is easy for customers to start, and business has grown steadily since then.
A chart showing highlights of this transition is shown below.
In 2022, the company spun off its Platform Business through a corporate spin-off and transferred it to NE Inc. (currently a consolidated subsidiary, hereafter referred to as NE), which merged with Hamee Consulting Corp. The company plans to spin off NE from the company and list it on the Tokyo Stock Exchange.
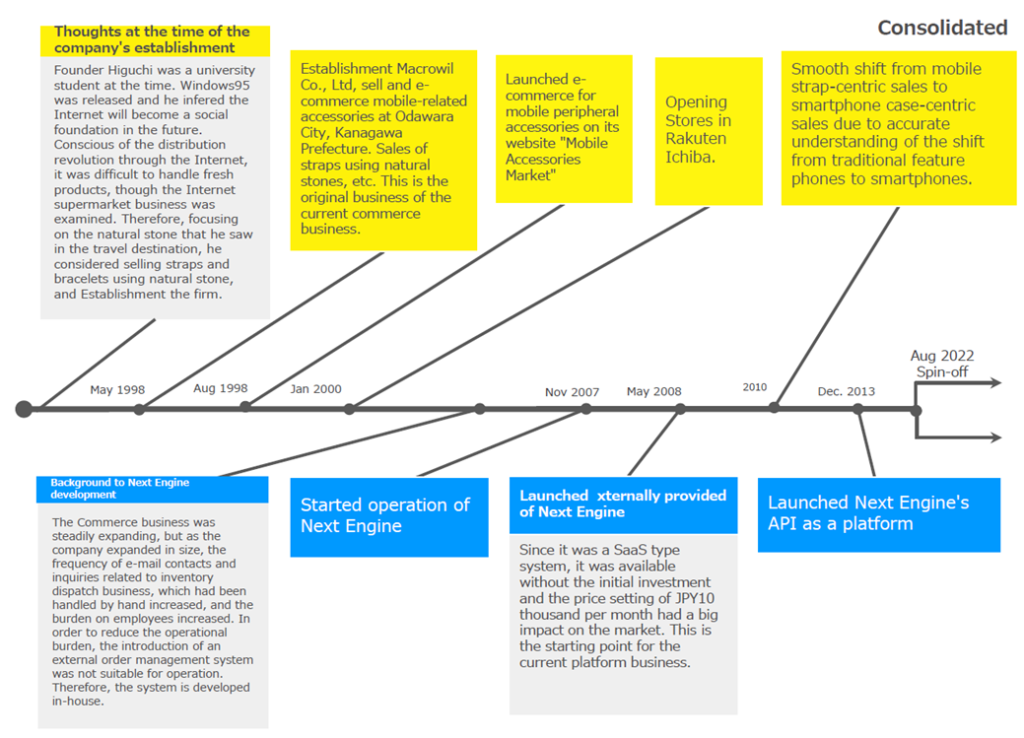
Source: company materials
Business overview
The Platform Business
Currently, NE is this business’s parent body. This wholly-owned subsidiary has a separate management structure from the Commerce Business. It is developing into the Consulting Business and Localco Business in addition to the main Next Engine Business.
Segment net sales for FY4/2023 were JPY 3.38 billion (+9% YoY), of which JPY 2.40 billion came from Next Engine Business, JPY 470 million from Consulting Business and JPY 510 million from Localco Business. Segment profit (before segment adjustments) was JPY 1.51 billion (+23% YoY), and the segment profit margin on net sales was 44.6% (+5.1 percentage points YoY), proving high profitability.
This high profitability results from the Next Engine Business being a SaaS-type business with pay-as-you-go billing, which delivers high marginal profits as the number of customers and the utilisation of each customer increases (to be explained later).
Net sales and segment profit of the Platform segment
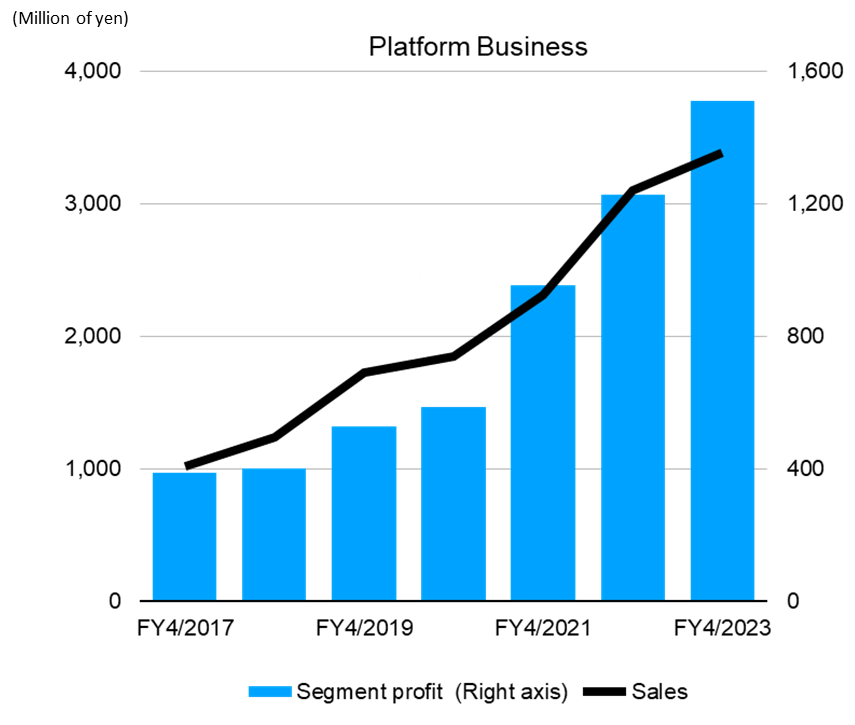
Source: Omega Investment from company materials
Next Engine is, in short, a “centralised management system for multiple EC sites”. It provides EC businesses with functions such as automatic email support, batch management of order slips, automatic stock linkage, and batch uploading of product pages.
The attractions for customers include;
- The ability to reduce backyard-related workloads and focus on creative work.
- The basic fees are pay-as-you-go billing (basic fees start at JPY 3,000 per month, and pay-as-you-go billing is based on the number of orders exceeding a certain number; it is not GMV-based), which makes it easy to introduce even for businesses that are not large.
- Besides the main functions, various applications are available to meet diverse needs.
- API has been open to the public since 2013, and there is an ecosystem where others can develop applications.
- The company has built a development system based on the needs of more than 5,000 clients.
While several similar competing systems exist in Japan, Next Engine Business is widely chosen, particularly by e-commerce businesses that operate multiple shopping sites. According to the company’s research, it has the top domestic market share in this genre.
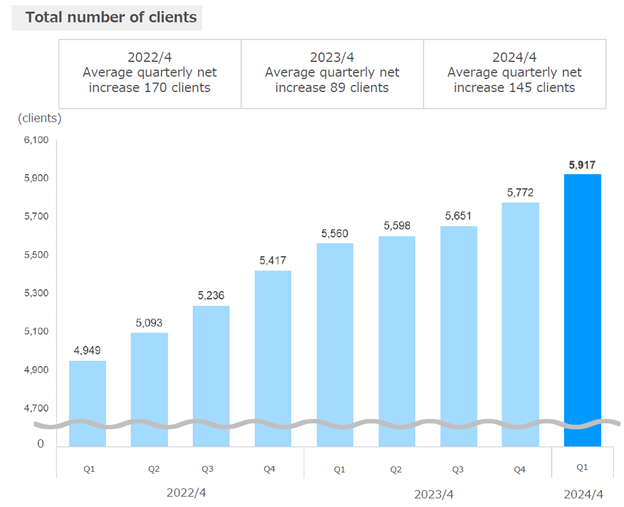
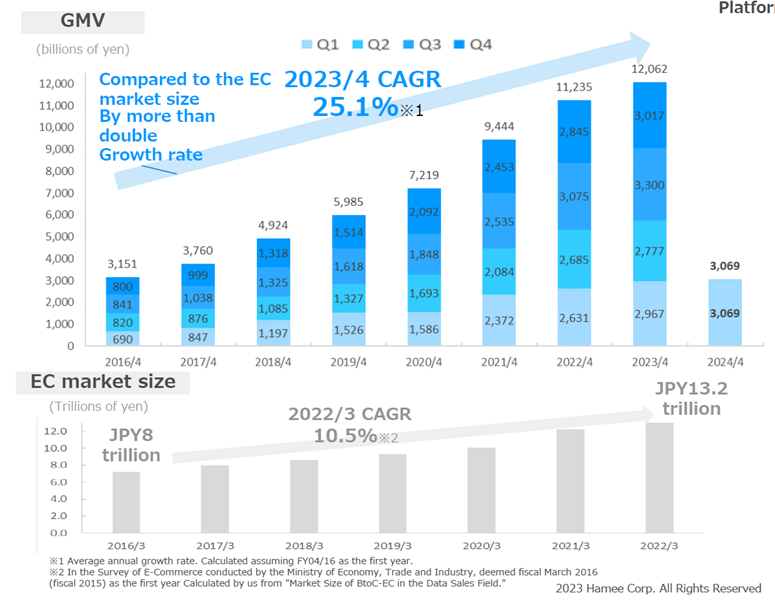
As of the end of FY4/2023, the number of Next Engine subscribers was 5,772 clients (up 355 from the end of the previous financial year), and the number of shops using Next Engine was 45,937 (up 4,342). The total transaction value of those shops using Next Engine was JPY 1,206.2 billion (up JPY 82.6 billion, according to in-house research).
Next Engine overview and current fee structure
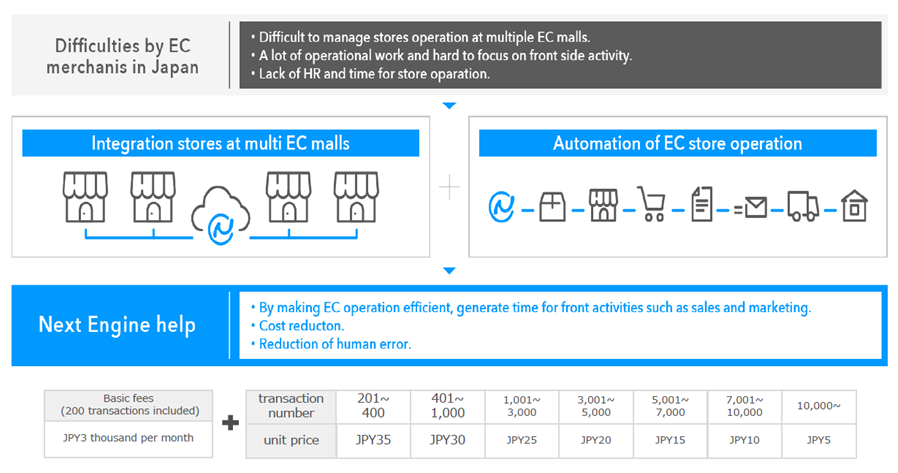
Source: company materials
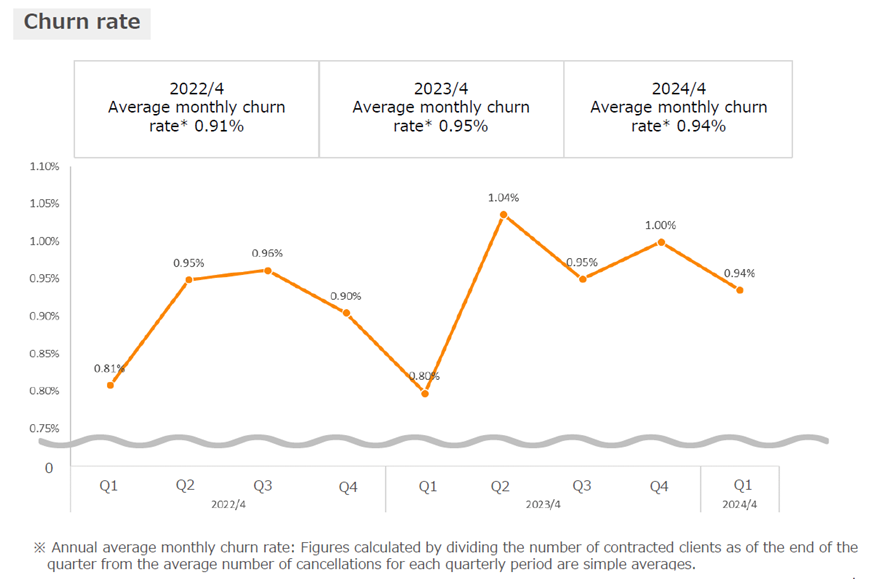
KPIs for Next Engine Business include number of clients, monthly churn rate, ARPU (average monthly charge per client), GMV (amount of orders processed), number of orders received, LTV and cost of acquiring new clients.
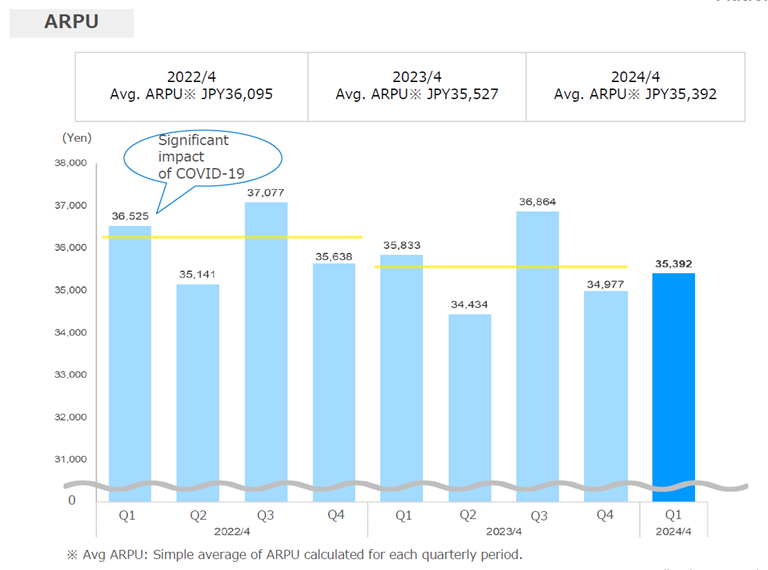
The chart below shows the most recent changes in these KPIs up to Q1 FY04/2024. It can be seen that the company has been steadily increasing the total number of subscribers each quarter while keeping churn rates under control, ARPU has maintained a constant level, and GMV has grown consistently as a result.
The slight decline in ARPU in recent quarters appears to be mainly due to a decrease in the number of orders received by customers, as the activation of the EC market was suspended by COVID-19. Therefore, it is assumed that as the penetration of the EC market increases going forward, the utilisation of the company’s contract customers will grow naturally, boosting APRU.
In addition, the cost of acquiring new customers appears to be well managed as the business has a strong presence in the market.
The Platform Business has two further components: Consulting Business and Localco Business.
The Consulting Business provides EC consulting services to promote the EC business through a broad range of consultants, EC store opening and construction consulting services to support new EC store openings, and EC website management agency services. In addition to support for existing customers, the business aims to expand its customer base by providing EC business support to smaller firms than existing customers, utilising Next Engine.
The Localco Business service applies Next Engine Business know-how to hometown tax donation support. Due to the nature of the business, sales tend to increase in Q3.
As mentioned above, the current scale of the business is around JPY 500 million in net sales each, and this is an area where growth is anticipated.
KPIs of the Next Engine Business
Source: company materials
KPIs of Next Engine Business (continued)
Source: all from the company’s IR materials
Commerce Business
Centred on its Mobile Life Business, the company ‘s ancestral business which designs and sells smartphone accessories and other products, the company is expanding its business by applying the know-how it has developed in this business to its Gaming Accessories Business, Cosmetics Business and Global Business.
Segment net sales for FY4/2023 were JPY 10.66 billion (+3% YoY) and continue to grow. However, the segment profit was JPY 700 million (-63% YoY), and the segment profit margin on net sales was 6.5% (-11.6 percentage points YoY). While the Mobile Life Business, a source of revenue, faced a headwind of changing consumer behaviour due to the relaxation of voluntary restraint, the other businesses all saw an increase in revenue. However, this was not enough to compensate for the earnings.
The breakdown is as follows. The Mobile Life Business recorded net sales of JPY 7.16 billion (-14% YoY) and a segment profit of JPY 1.22 billion (-29% YoY); the Gaming Accessories Business recorded net sales of JPY 0.77 billion (+94%) and segment profit of JPY 20 million (slightly higher YoY); The Cosmetics Business registered net sales of JPY 0.29 billion (+880% YoY) and segment loss of JPY 490 million (deficit increased YoY); New Business Investment posted net sales of JPY 0.1 billion (+80%) and loss of JPY 0.26 billion (deficit reduced YoY); Functional Departments expenses were JPY 0.11 billion (larger YoY); Global Business saw net sales of JPY 2.33 billion (+53%) and segment profit of JPY 0.32 billion (-56%).
Net sales and segment profit of the Commerce Business

Source: Omega Investment from company materials.
Next, the characteristics of the Mobile Life Business are described, followed by an overview of the other businesses.
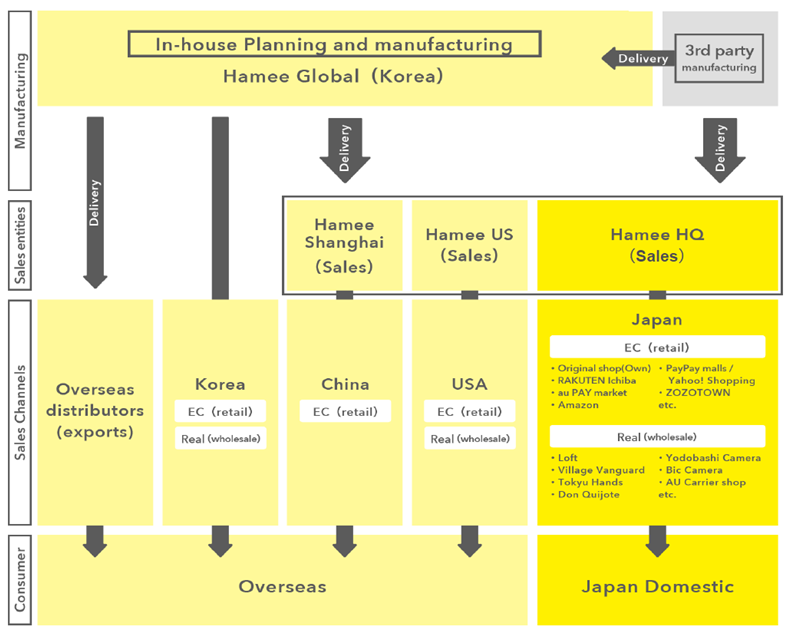
The Mobile Life Business plans, develops and manufactures mobile phone cases and other mobile accessories and sells these products via the internet and wholesale to major general merchandise retailers, etc. The features of this business are as follows.
– iFace brand: penetration of the iFace brand, especially amongst young people, and the expansion of the product range.
– Diverse sales channels: In Japan, the company operates multiple shops for B2C via its own EC and third-party EC sites and has also established B2B wholesale sales channels for general merchandise mass retailers and electronics mass retailers. In addition, the company has B2C (EC) and B2B (wholesale) sales channels in South Korea, China and the USA through overseas subsidiaries.
– Wide range of product procurement routes: trading with over 500 suppliers.
– A system capable of overseeing the entire flow of the company’s products, from planning and production to distribution and sales.
The chart below shows the supply chain of the business, with overseas operations grouped as Global Business.
In the Gaming Accessories Business, the company became the exclusive distributor of the gaming monitor brand Pixio in Japan in 2021 to utilise its e-commerce sales know-how and conduct sales promotion.
Cosmetics business: the expertise gained from the development of the iFace brand is being used to develop the Korean cosmetics brand ByUR in Japan, with the launch of a base make-up line in January 2022, a sheet mask line in July and a skincare line in September of the same year.
The supply chain of the Commerce Business
Source: company materials
Mid-Term Management Plan (FY4/2024 – FY4/2026)
Mid-Term Management Plan (FY4/2024 – FY4/2026)
The current Mid-Term Management Plan is a revised version of the one announced in June 2022 (‘the old Mid-Term Plan’), reiterated in June 2023.
The main point of the old Mid-Term Management Plan was the complete separation of the two businesses through a spin-off, which replaced the integrated management of the Commerce and Platform businesses and the pursuit of synergies between the businesses.
This is based on the recognition that the commerce business has built its supply chain from planning to sales, mainly of its products, while the Platform Business has a customer base suitable for a platform, and that it would be better for the company to aim for business expansion in an optimal way for each, including personnel and management aspects. Presumably, the decision was made to maximise corporate value and improve stakeholder accountability.
The current Mid-Term Management Plan follows the primary line of the former Mid-Term Management Plan, with the following additions and changes.
– In the Commerce Business, products and services based on the mission of “By your side, a pal called yourself, beside you” will be deployed worldwide.
– In the Platform Business, the company aims to create a ‘New frenzy’ that goes beyond mere enjoyment with all people involved in commerce by accompanying all Commerce Businesses to pursue the mission of ‘Bringing Frenzy into Commerce’.
– Revised financial targets: set three-year targets to April 2026
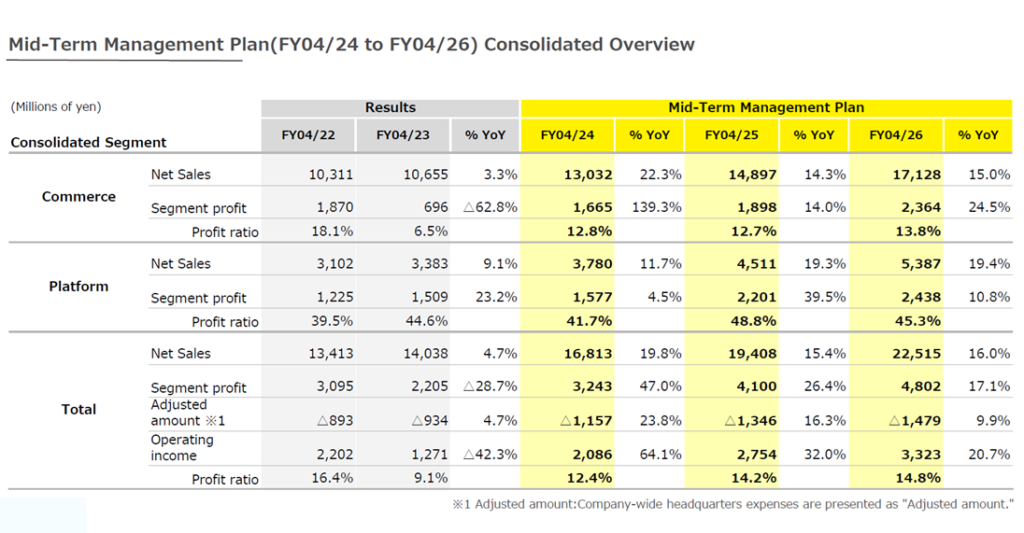
The financial targets are shown in the table below. The aim is to restore operating income in FY4/2024, which fell in the previous year, and to achieve record-high net sales and operating income for two consecutive years from FY4/2025 onwards. The plan intends to recover the operating income margin on net sales to 14.8%.
Mid-Term Management Plan – Consolidated Overview
Source: company materials
The following is an overview of the current Mid-Term Management Plan by segment. Key points are;
- Maintain sustainable growth in the Platform segment, with a sales growth rate in the 10% range and a segment profit margin on net sales in the 40% range, as befits a SaaS operator.
- In the Commerce Business, continue double-digit revenue growth driven by the Cosmetics Business and Global Business and restore the segment profit to near its record high (JPY 2.5 billion in FY4/2021).
- Maintain a segment profit composition ratio of approximately 1:1.
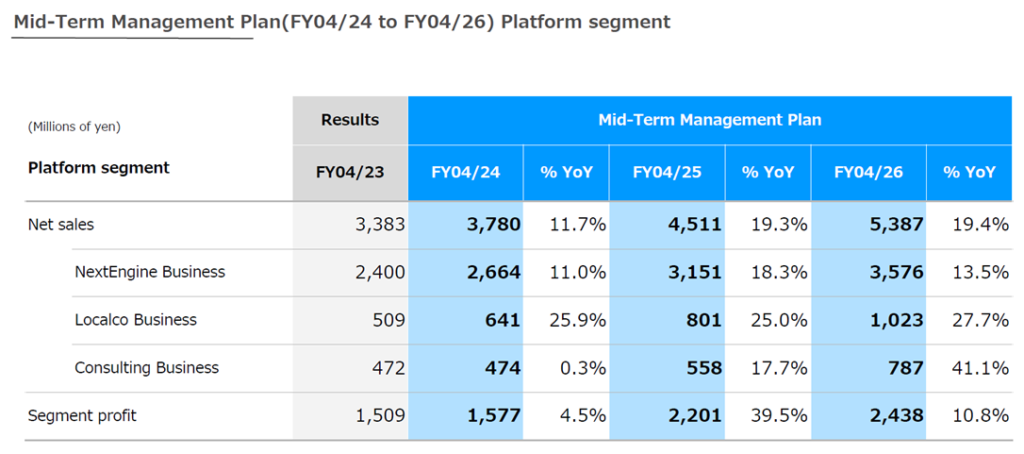
Here is supplementary information on business development in the Platform Business.
- Adding Next Engine functions: Four additional functions are planned for the latter half of 2023- Building contracts with small businesses: Significantly increase the number of Next Engine Business clients by targeting smaller companies than before and using the Consulting Business as a lever.
- Revision of Next Engine Business fee structure: To promote contracts with small businesses, the basic fees will be lowered from JPY 10,000 to JPY 3,000 per month, excluding tax. The rate table for additional pay-as-you-go billing will also be revised, resulting in an actual price increase for medium-sized businesses of a specific size. The new tariff plan will apply to new contracts from 1 June 2023 and existing contracts from November 2023 onwards.
- Wholesale marketplace ‘encer mall’: A B2B mall will be set up to connect manufacturers, sales firms with manufacturer functions and sales firms. It offers sellers the benefits of sales channel expansion and order scale expansion and for buyers the benefits of source expansion and decreased sales opportunity losses for buyers. It is estimated to have a high affinity with Next Engine’s existing customers, and a beta version is scheduled for release in January 2024.
Mid-Term Management Plan – Segmental Overview
Source: company materials
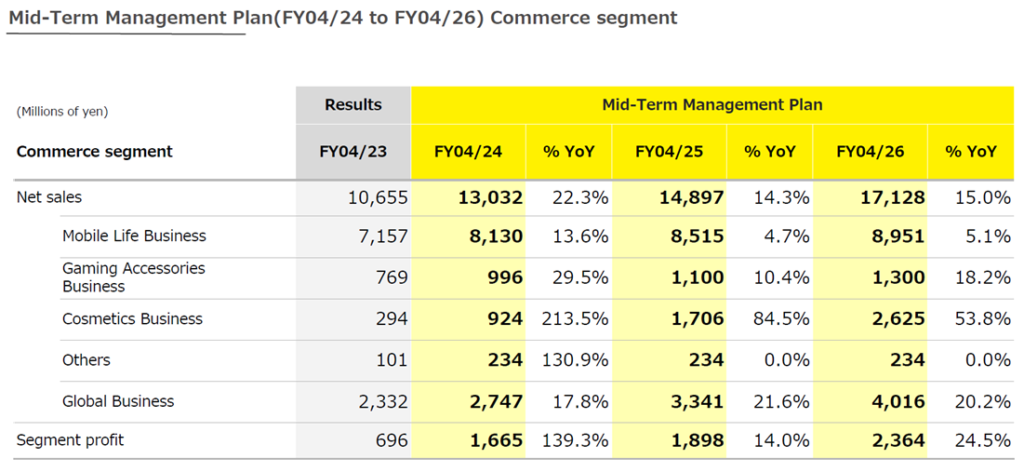
Supplementary information on the business development of the Commerce business is as follows.
- In the Mobile Life Business, new products will be released continuously for the iFace series, the flagship brand. In addition, a concept store, iFace Lab, opened in Harajuku, Tokyo, in August 2023, where various experiments are conducted.
- In the Gaming Accessories Business, the company will expand its product line-up by developing new high-performance monitors and peripheral accessories such as original monitor arms. Furthermore, the company will realise the results of strengthening its relationship with the manufacturer Pixio USA Inc. through capital investment.
- In the Cosmetics Business, advertising expenses were spent on brand awareness in conjunction with the launch of the base make-up series in January 2022 and the skincare line in September 2022. Furthermore, sales channels such as ES stores and wholesale customers steadily expand. Thanks in part to the introductions on TV programmes. net sales have started to grow since spring 2023, and the company aims to achieve positive profitability in FY4/2025.
- In Global Business, in January 2023, Hamee US took over the overseas sales business of Otamatone, which is selling well.
Mid-Term Management Plan – Overview by segment
Source: company materials
Corporate reorganisation (spin-off of subsidiary NE Inc. and the IPO plan)
In parallel with implementing the current Mid-Term Management Plan, a change of listing market and a corporate reorganisation plan were announced in July 2023. As this corporate reorganisation is considered noteworthy from the perspective of corporate value, the key points are summarised below.
- The company has been listed on the TSE Prime Market but will move to the TSE Standard Market from 20 October 2023, as only the market capitalisation of tradable shares still needs to be fulfilled among the criteria for maintaining listing (the requirements for the Standard Market are met). As discussed below, the plan is to split off the subsidiary NE Inc. and list it. The subsequent business of the remaining Hamee (commerce business) was also considered.
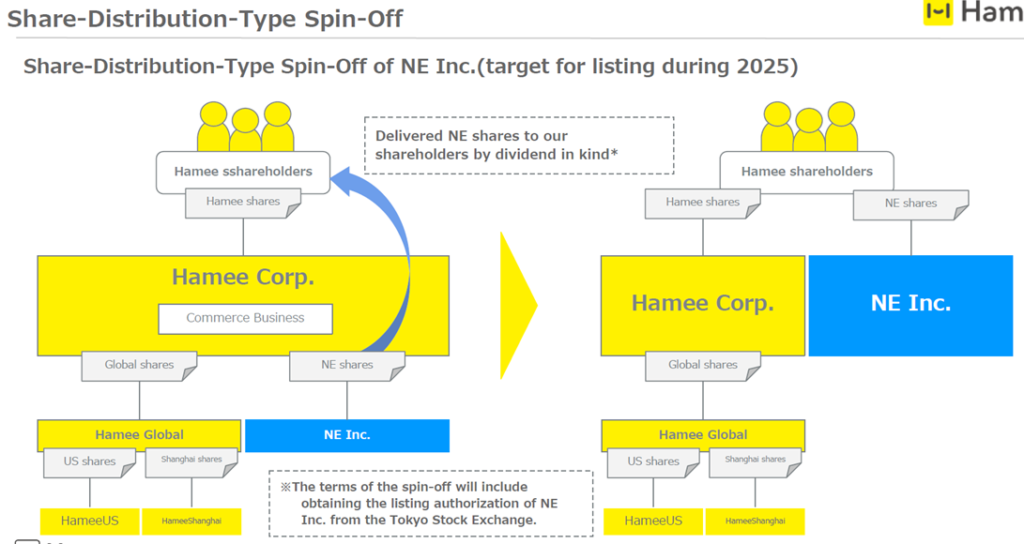
- The plan is to spin off NE Inc., currently a wholly-owned subsidiary of Hamee that consolidated the platform business within the Hamee Group in 2022, and list it on the TSE (the spin-off will take place upon listing approval). The timing is assumed to apply for listing during 2025.
- NE’s spin-off will be a share-distribution type. Put simply, current Hamee shareholders will continue to hold Hamee shares and receive NE shares, and after NE is listed, they will own two types of listed shares, i.e., Hamee shares and NE shares.
- Through this process, the current Hamee share price is expected to reflect the underlying corporate value of the Commerce and Platform Businesses.
- At the same time, the respective governance structures will be clarified, and faster decision-making is also expected.
How a share-distribution-type spin-off works
Source: company materials
Financial results
Full-year financial results
| Financial period | FY4/2017 | FY4/2018 | FY4/2019 | FY4/2020 | FY4/2021 | FY4/2022 | FY4/2023 | FY4/2024 | FY4/2025 | FY4/2026 |
| Consolidated, Japanese GAAP | Company forecast |
Medium-term management plan |
Medium-term management plan |
|||||||
| [Statements of income] | ||||||||||
| Net sales | 8,502 | 9,377 | 10,303 | 11,325 | 12,364 | 13,413 | 14,038 | 16,813 | 19,408 | 22,515 |
| Operating income | 1,106 | 1,380 | 1,164 | 1,745 | 2,180 | 2,202 | 1,271 | 2,086 | 2,754 | 3,323 |
| Ordinary profit | 1,048 | 1,267 | 1,179 | 1,757 | 2,149 | 2,330 | 1,400 | 2,069 | ||
| Net profit before income taxes | 1,010 | 1,259 | 1,179 | 1,582 | 2,144 | 2,463 | 1,396 | |||
| Net profit attributable to owners of the parent | 696 | 873 | 821 | 1,069 | 1,556 | 1,744 | 945 | 1,537 | ||
| [Balance Sheets] | ||||||||||
| Total assets | 4,240 | 5,042 | 5,761 | 8,097 | 8,339 | 10,518 | 12,320 | |||
| Total liabilities | 1,484 | 1,445 | 1,572 | 3,272 | 1,811 | 2,265 | 3,360 | |||
| Total net assets | 2,756 | 3,597 | 4,189 | 4,824 | 6,528 | 8,253 | 8,961 | |||
| Total borrowings | 468 | 298 | 500 | 1,740 | 104 | 544 | 1,300 | |||
| [Statements of cash flows] | ||||||||||
| Cash flow from operating activities | 576 | 1,246 | 651 | 1,934 | 1,941 | 1,186 | 695 | |||
| Cash flow from investing activities | -433 | -674 | -671 | -1,020 | -412 | -886 | -1,507 | |||
| Cash flow from financing activities | 69 | -230 | -7 | 933 | -1,736 | 298 | 263 | |||
| Cash and cash equivalents at end of period | 1,324 | 1,695 | 1,660 | 3,453 | 3,355 | 4,026 | 3,536 | |||
| [Efficiency] | ||||||||||
| Ratio of ordinary profit to sales | 12% | 14% | 11% | 16% | 17% | 17% | 10% | 12% | ||
| ROA | 19% | 15% | 15% | 19% | 18% | 8% | ||||
| ROE | 30% | 28% | 22% | 25% | 28% | 24% | 11% | |||
| [Per-share] Unit : JPY | ||||||||||
| EPS | 44 | 55 | 51 | 67 | 98 | 110 | 59 | 94 | ||
| BPS | 170 | 216 | 254 | 297 | 405 | 513 | 557 | |||
| DPS | 4.5 | 5.5 | 6.5 | 7.0 | 10.0 | 22.5 | 22.5 | 22.5 | ||
| [Number of employees] | ||||||||||
| Number of consolidated employees | 233 | 285 | 309 | 353 | 387 | 403 | 428 |
Source: (Million of yen)
Omega Investment from company materials.
Rounding half up
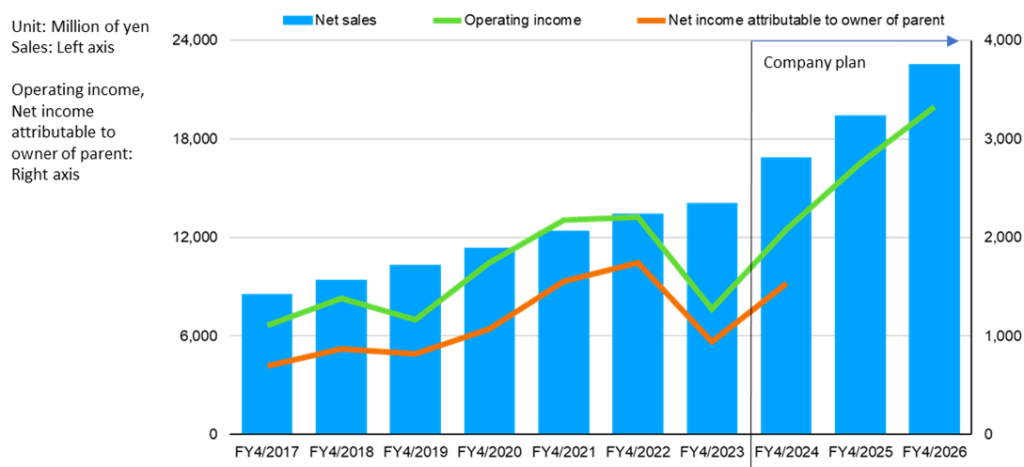
Key PL items
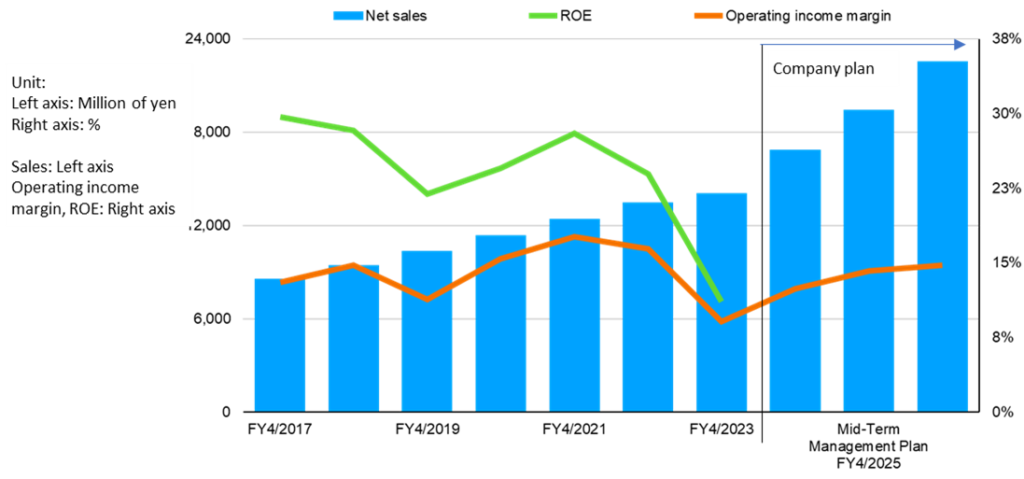
Sales, operating margin, and ROE
Source: Omega Investment from company materials.
Profit and loss trends
The company’s performance has been steadily increasing in terms of sales.
However, in terms of profits, the company has experienced YoY declines in profits twice, in FY4/2019 and FY4/2023. Both were mainly due to the earnings of the Commerce Business. In FY4/2019, net sales in the Commerce Business increased, but SG&A expenses increased, while in FY4/2023, net sales in the Gaming Accessories and Cosmetics businesses grew. Still, the mainstay Mobile Life Business experienced a significant decline due to sluggish sales of new smartphone products, resulting in a considerable drop in sales and segment profit.
However, profits have not fallen for two consecutive years, and the company’s forecast for FY4/2024 is for increased sales and profits. Despite fluctuations, profits are on a growth trajectory over the medium term.
The company has maintained an ordinary income margin on sales of at least 10%, comparable to a company in a growth phase.
Cash flow and balance sheet
Cash flow from operating activities and cash flow from investing activities increase and decrease from year to year, and there are periods when free cash flow is negative. However, on a moving average, free cash flow is positive.
As per the balance sheet, the equity ratio is high, and the balance of interest-bearing debt is lower than that of cash and cash equivalents. Overall, the company is considered healthy.
Capital efficiency
ROE was in the 20% range until FY4/2023 when it fell to 11%. This is mainly due to a decline in the net income margin on sales following a significant profit fall. Hence, ROE is expected to recover as profits recover.
However, from a medium-term observation, the equity ratio remains high, and there is a trend towards a gradual decline in the net sales turnover ratio on assets. This is not an urgent issue as the company is undergoing a growth phase. Nevertheless, we hope the Company to improve equity capital efficiency in the medium to long term horizon, inclusive of intaking external growth opportunities.
The trend of segment profit
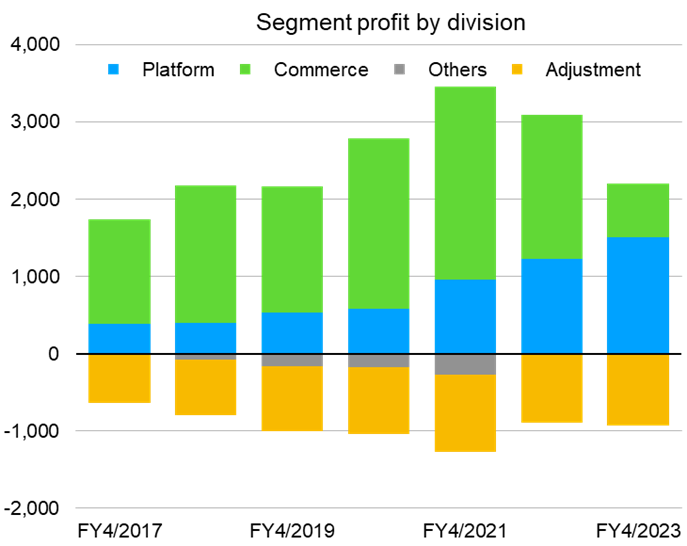
Source: Omega Investment from company materials.
Details of Results for FY4/2023
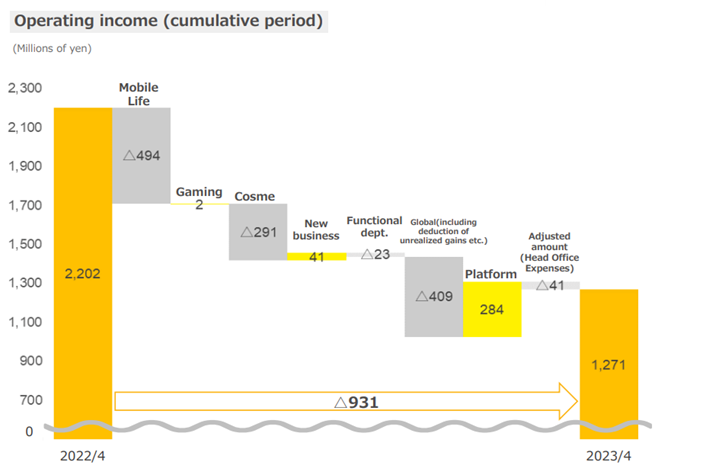
For reference, an analysis of YoY changes in net sales and operating income for FY4/2023 is presented below. Regarding net sales, a decrease in the Mobile Life Business and an increase in the other business segments can be seen. Concerning operating income, the Platform Business saw an increase in earnings. In contrast, the Commerce Business saw a decrease in profits due to a fall in sales in the Mobile Life Business, and the Cosmetics Business is in a period of up-front investment.
Results for FY4/2023 – Analysis of YoY change in net sales
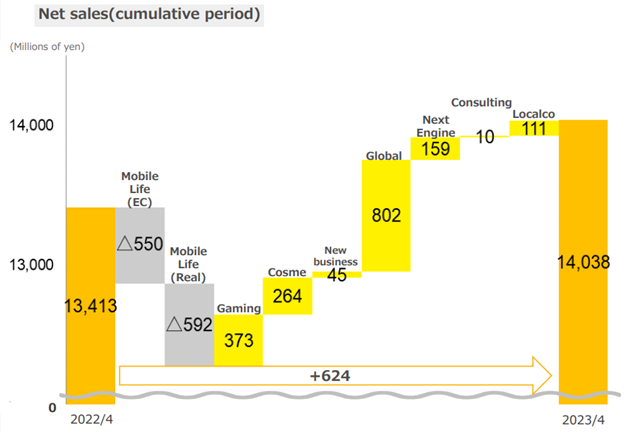
Source: company materials
Results for FY4/2023 – Analysis of YoY changes in operating income
Source: company materials
Results for Q1 FY4/2024
The company’s full-year forecasts for FY4/2024 are net sales of JPY 16.8 billion (+20% YoY), operating income of JPY 2.09 billion (+64% YoY), ordinary income of JPY 2.07 billion (+48% YoY) and net profit attributable to owners of parent of JPY 1.54 billion (+63% YoY). These forecasts suggest a return to increased revenues and profits.
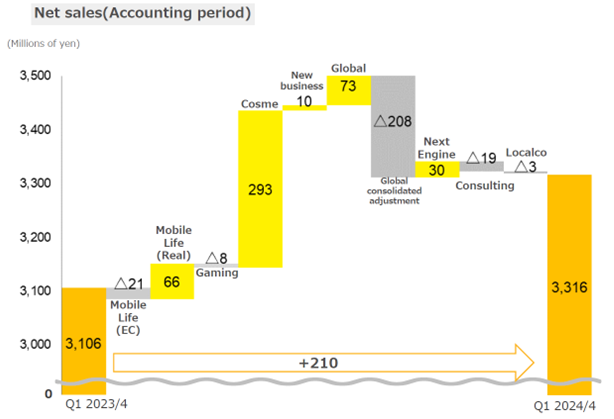
In contrast, Q1 results (May-July 2023) showed net sales of JPY 3.32 billion (+7% YoY), operating income of JPY 170 million (-30% YoY), ordinary income of JPY 200 million (-31% YoY) and net loss attributable to owners of parent of JPY 130 million.
However, according to IR, net sales and operating income for both Commerce and Platform exceeded the initial forecasts, with Mobile Life Business recovering in Commerce and Cosmetics recording a significant increase in sales. In Platform Business, the effect of the fee revision was reflected in an increase in new contracts. We are watching how the Q2 transition goes to see if the company can achieve its full-year plan.
Results for Q1 FY4/2024 – Analysis of YoY change in net sales
Results for Q1 FY4/2024 – Analysis of YoY changes in operating income
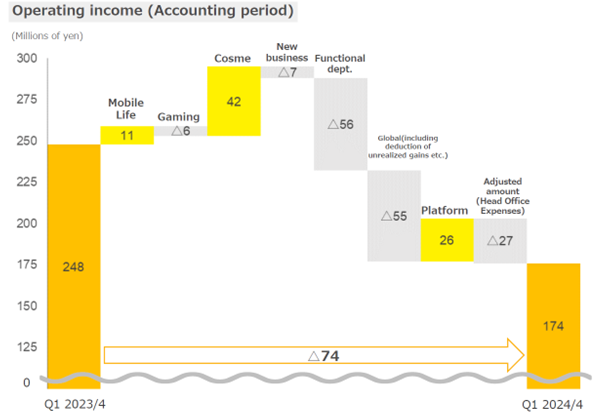
Source: company materials
Share price trend
Hamee share price trends
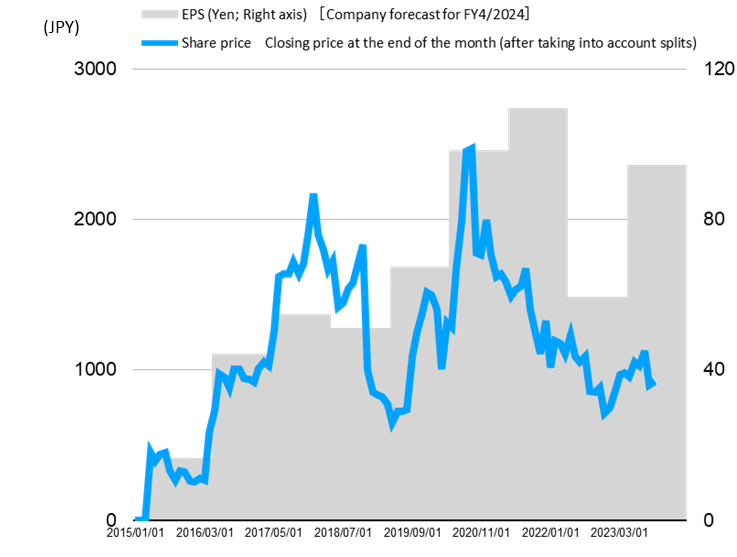
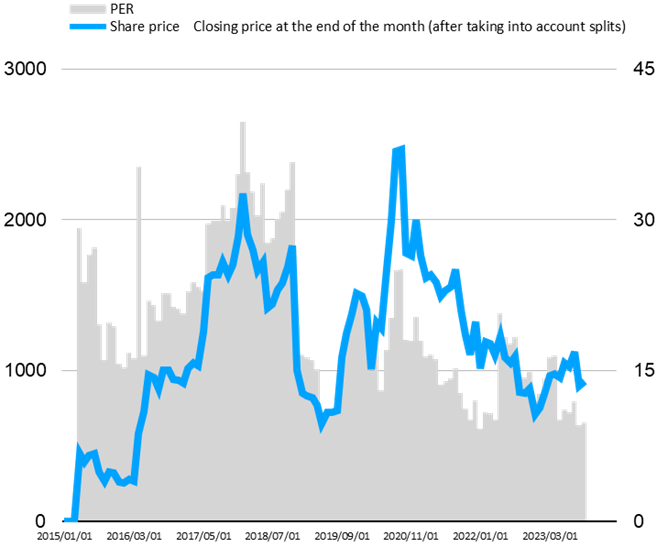
The graph shows the company’s share price at the end of each month, EPS by year (company forecast for FY4/2024), share price and PER. According to this,
- Share price rises and falls are linked to changes in EPS
- The rise in share prices is slow relative to the increase in EPS, i.e. the PER is on a downward trend.
In other words, recent share price formation is linked to earnings, but growth expectations are declining, and PER continues to contract.
Equity stories and equity investors’ focus
As seen in the previous section, recent share price formation has tended to be influenced by current financial performance (in short, EPS trends), and share price multiples such as PER have been shrinking.
For example, the company’s forecast for FY4/2024 assumes increased sales and profits, and the share price is around ten times the company’s forecast EPS of JPY 94 and about 16 times the actual EPS of JPY 59 for FY4/2023. This is presumably because Q1 results showed a YoY increase in revenue and declining profit, and therefore, the investors are not convinced by the company’s full-year forecasts.
However, as we have seen earlier, measures to return to a growth path have been put in place on multiple fronts. It would not be surprising if the share price starts to discount a reassessment of the company’s growth potential when the factors discussed below improve. A trend towards higher sales and profits begins to emerge regarding performance.
- In the Platform Business, the number of Next Engine Business subscribers is showing signs of increasing as the company rigidly targets small businesses and revises its fee structure.
- The pay-as-you-go billing part of the fee revision mentioned above will likely result in a substantial price increase, which may be felt in the second half of the current fiscal year.
- The EC market penetration is seen to have advanced with the outbreak of COVID-19 and then stalled when the pandemic subsided. However, in the long term, the penetration is expected to increase further, and ARPU is likely to grow.
- Small and medium-sized e-commerce operators are likely to continue opening multiple shops.
- Launching the wholesale marketplace ‘encer mall’ will pave the way for raising customer LTV while also encompassing Next Engine’s existing customers.
- In the Commerce Business, while maintaining a superior market position in the Mobile Life Business, the company is utilising its EC expertise to diversify into Gaming Accessories, Cosmetics, and Global. Sales in the Cosmetics Business have started to grow steadily.
When these positive catalysts emerge, the split listing of the Platform and Commerce companies scheduled for 2025 onwards should draw investors’attention. The valuation of the Platform Business, in particular, may well begin to be visibly factored into the share price (i.e., PER and other share price multiples will expand).
It will be interesting to see how the potential catalysts mentioned here materialise and how the return to a profit growth trend is confirmed. It is also essential to pay attention to the impact of foreign exchange rates, raw material prices and the stability of procurement of key commercial materials.
Useful information
Principal shareholders
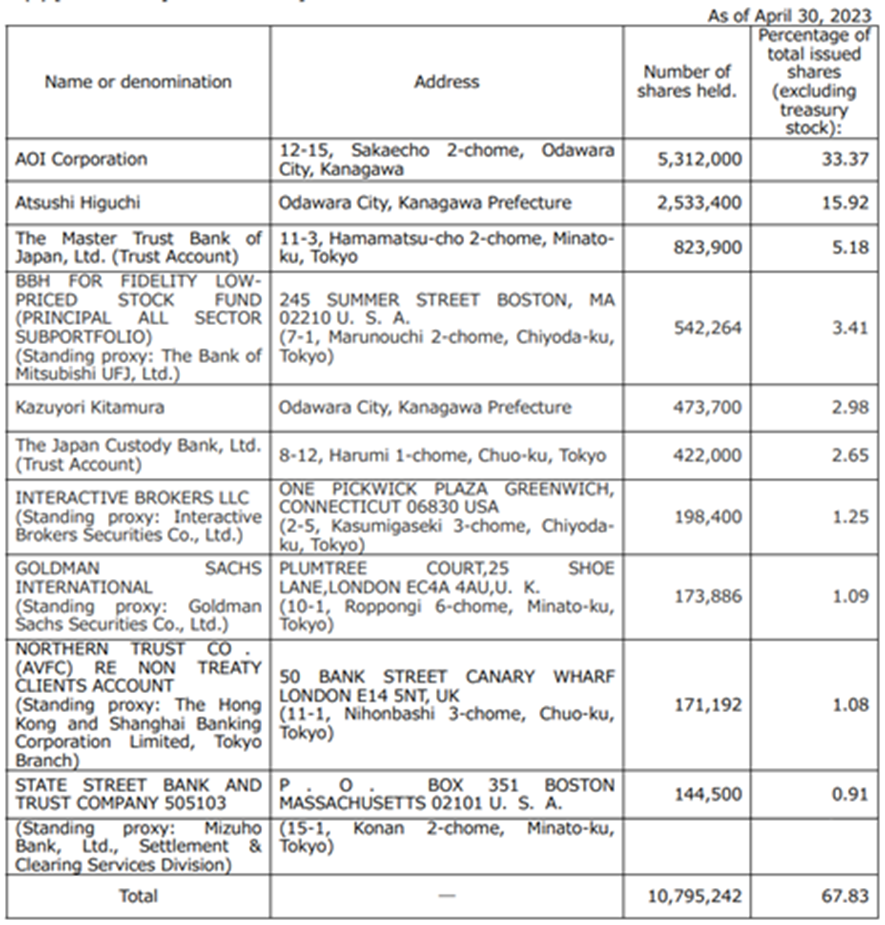
Shareholder composition
